

Pulmonary gas exchange evaluated by machine learning: a computer simulation
- PMID: 35691965
- PMCID: PMC9188913
- DOI: 10.1007/s10877-022-00879-1
Pulmonary gas exchange evaluated by machine learning: a computer simulation
Abstract
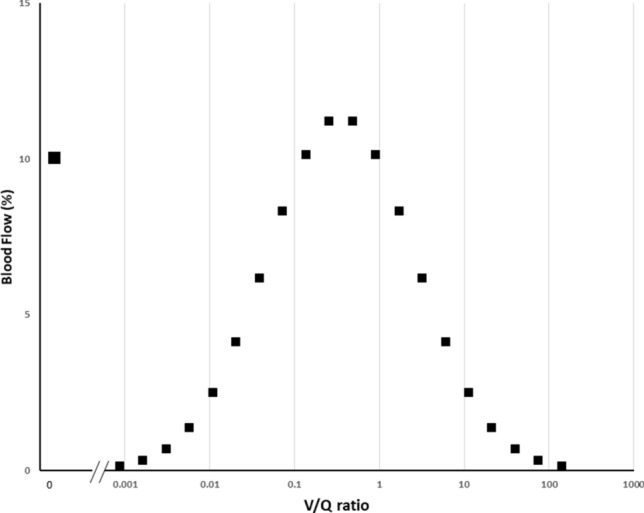
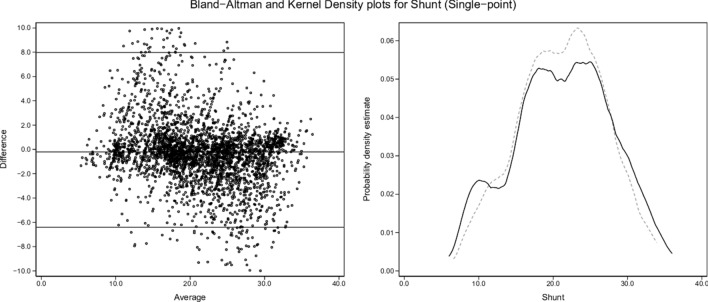
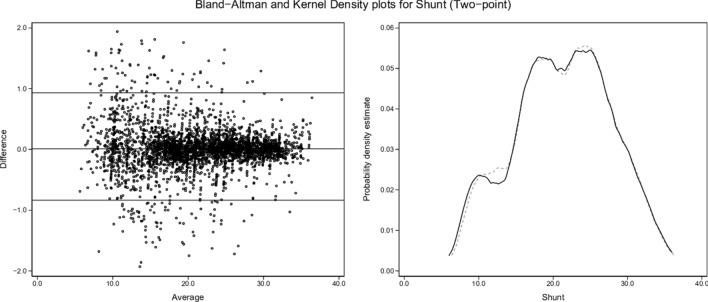
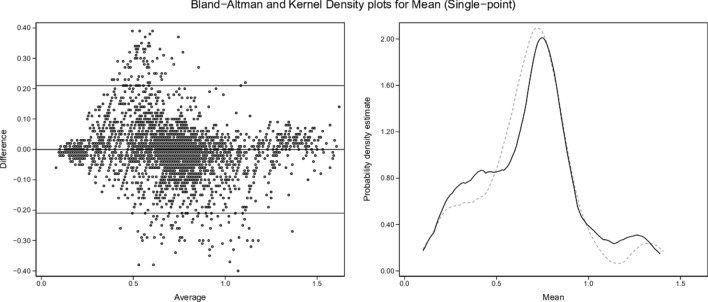
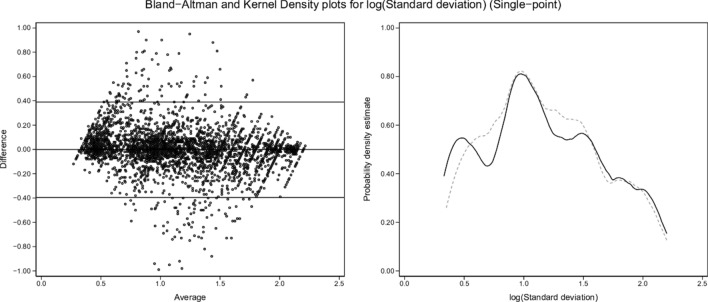
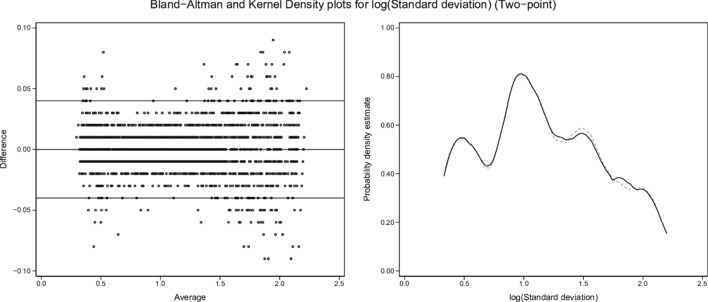
Using computer simulation we investigated whether machine learning (ML) analysis of selected ICU monitoring data can quantify pulmonary gas exchange in multi-compartment format. A 21 compartment ventilation/perfusion (V/Q) model of pulmonary blood flow processed 34,551 combinations of cardiac output, hemoglobin concentration, standard P50, base excess, VO2 and VCO2 plus three model-defining parameters: shunt, log SD and mean V/Q. From these inputs the model produced paired arterial blood gases, first with the inspired O2 fraction (FiO2) adjusted to arterial saturation (SaO2) = 0.90, and second with FiO2 increased by 0.1. 'Stacked regressor' ML ensembles were trained/validated on 90% of this dataset. The remainder with shunt, log SD, and mean 'held back' formed the test-set. 'Two-Point' ML estimates of shunt, log SD and mean utilized data from both FiO2 settings. 'Single-Point' estimates used only data from SaO2 = 0.90. From 3454 test gas exchange scenarios, two-point shunt, log SD and mean estimates produced linear regression models versus true values with slopes ~ 1.00, intercepts ~ 0.00 and R2 ~ 1.00. Kernel density and Bland-Altman plots confirmed close agreement. Single-point estimates were less accurate: R2 = 0.77-0.89, slope = 0.991-0.993, intercept = 0.009-0.334. ML applications using blood gas, indirect calorimetry, and cardiac output data can quantify pulmonary gas exchange in terms describing a 20 compartment V/Q model of pulmonary blood flow. High fidelity reports require data from two FiO2 settings.
Keywords: Computer simulation; Gas exchange; Lung model; MIGET format; Machine learning.
© 2022. The Author(s).
Conflict of interest statement
The authors declare that they have no competing interests.
Figures

References
-
- West JB. State of the art: ventilation–perfusion relationships. Am Rev Respir Dis. 1977;116(5):919–943. - PubMed
-
- West JB, Wagner PD. Pulmonary gas exchange. In: West JB, editor. Bioengineering aspects of the lung. New York: Marcel Dekker; 1977. pp. 361–457.
Publication types
MeSH terms
LinkOut - more resources
Full Text Sources
Research Materials
