. 2022 May 24:16:880859.
doi: 10.3389/fnins.2022.880859. eCollection 2022.

Three-Photon Adaptive Optics for Mouse Brain Imaging

Affiliations

Three-Photon Adaptive Optics for Mouse Brain Imaging

David Sinefeld et al. Front Neurosci. .

Abstract

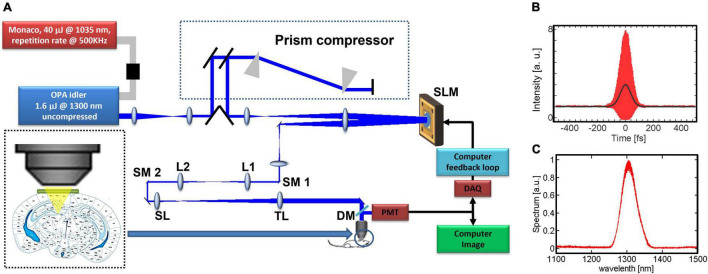
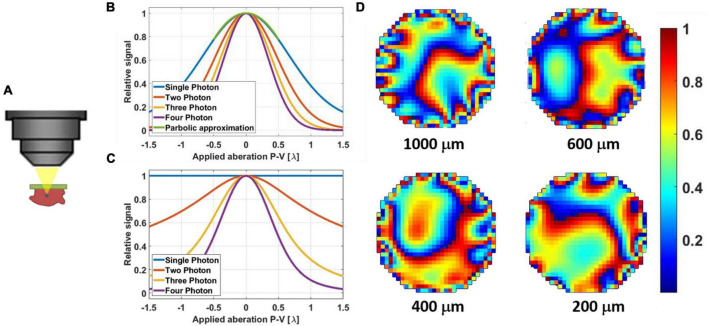
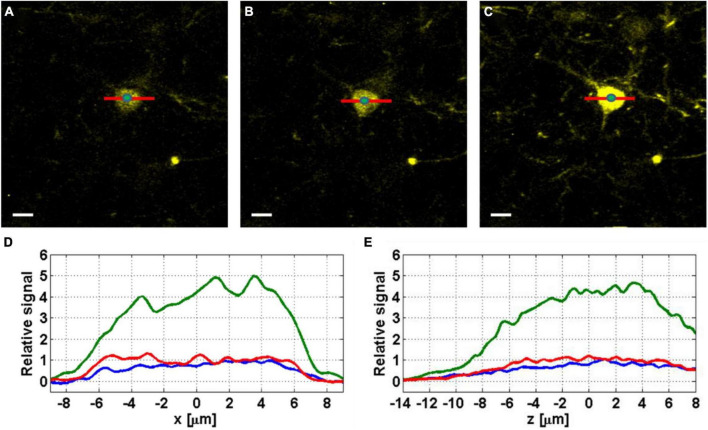
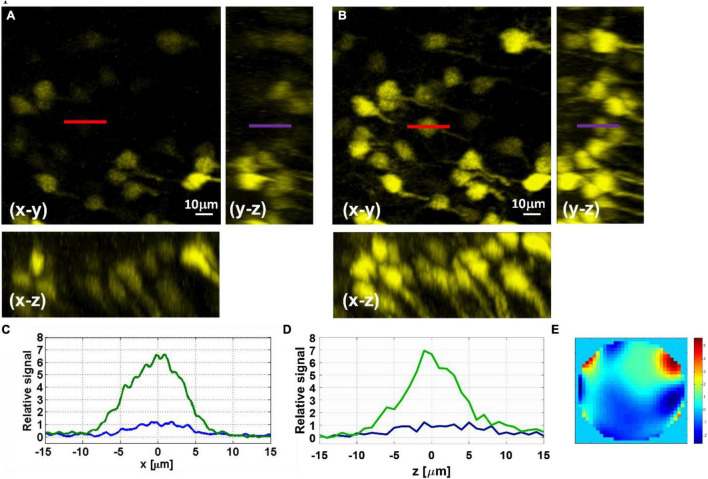
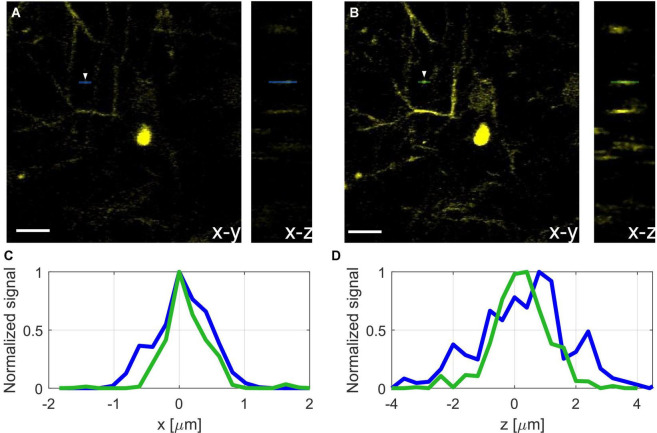
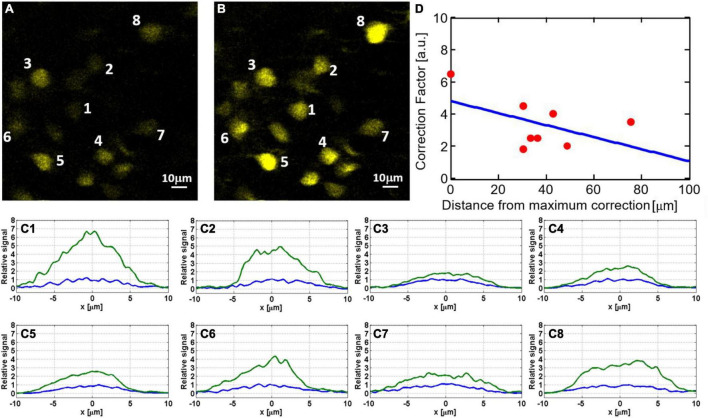
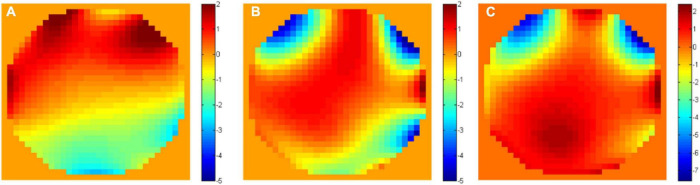
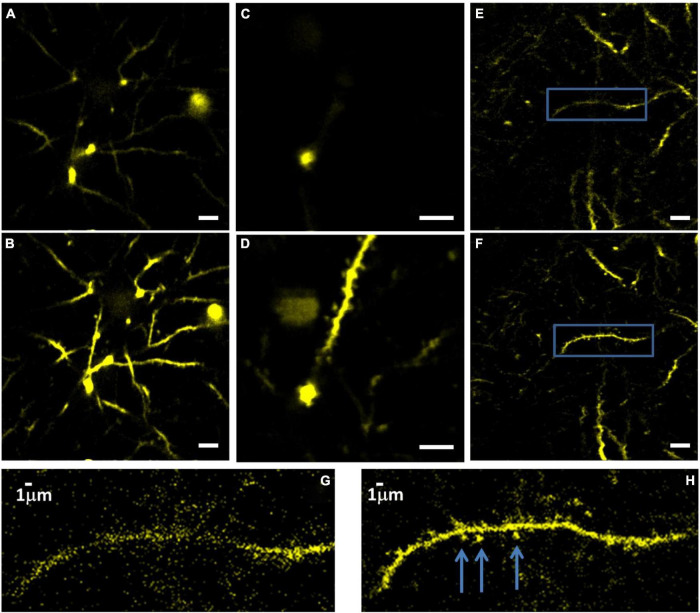
Three-photon microscopy (3PM) was shown to allow deeper imaging than two-photon microscopy (2PM) in scattering biological tissues, such as the mouse brain, since the longer excitation wavelength reduces tissue scattering and the higher-order non-linear excitation suppresses out-of-focus background fluorescence. Imaging depth and resolution can further be improved by aberration correction using adaptive optics (AO) techniques where a spatial light modulator (SLM) is used to correct wavefront aberrations. Here, we present and analyze a 3PM AO system for in vivo mouse brain imaging. We use a femtosecond source at 1300 nm to generate three-photon (3P) fluorescence in yellow fluorescent protein (YFP) labeled mouse brain and a microelectromechanical (MEMS) SLM to apply different Zernike phase patterns. The 3P fluorescence signal is used as feedback to calculate the amount of phase correction without direct phase measurement. We show signal improvement in the cortex and the hippocampus at greater than 1 mm depth and demonstrate close to diffraction-limited imaging in the cortical layers of the brain, including imaging of dendritic spines. In addition, we characterize the effective volume for AO correction within brain tissues, and discuss the limitations of AO correction in 3PM of mouse brain.

Keywords: adaptive optics; brain imaging; in vivo imaging; multiphoton microcopy; three-photon microscopy.


Conflict of interest statement

HP and TB have a financial interest in Boston Micromachines Corporation (BMC), which produced commercially the deformable mirror used in this work. The remaining authors declare that the research was conducted in the absence of any commercial or financial relationships that could be construed as a potential conflict of interest.

Figures

FIGURE 1
FIGURE 1
System description: (A) experimental setup. The prism compressor compensates the dispersion to minimize the pulse width at the focus of the objective lens. The microelectromechanical (MEMS)-based SLM has 1024 elements and is imaged onto two galvo scanning mirrors (SM1, SM2) and the back aperture of the objective. We use the non-linear signal from the image in order to close the feedback loop, L1, L2, lenses for beam relay; SL, scan lens; TL, tube lens; DM, dichroic mirror. (B) Measured interferometric second-order autocorrelation trace of the pulse at the objective focus, with dispersion pre-compensation. The pulse’s full width at half maximum (FWHM) is ∼70 fs assuming a sech2(τ) temporal pulse intensity profile. (C) Measured OPA output spectrum.
FIGURE 2
FIGURE 2
(A) Illustration of a non-linear guide star in 3PM generated even in a thick sample. (B) Simulation results of signal degradation of a fluorescent bead (point source) due to applied aberration (astigmatism). The parabolic approximation for +/– λ is suitable even for single-photon excitation. (C) Simulation results of signal degradation of fluorescent dye pool (thick sample) due to applied aberration (astigmatism). Here the signal from single-photon excitation remains constant since the volumetric integral remains the same. Two-photon excited signal does degrade, but at a slower rate than those of three- and four-photon excitation. (D) Example phase maps of mouse brain in vivo as they were applied with the SLM for different correction depths at 200 μm, 400, 600, and 1000 μm. The phases are 2π wrapped, and the color bar scale is for λ = 1.3 μm.
FIGURE 3
FIGURE 3
Images of YFP labeled neurons at 800 μm below the surface of the mouse brain, before correction (A), with shallow correction (B), and full correction at 800 μm depth (C). Scale bar, 10 μm. The green dots at the center of the neurons indicate the locations where the axial profiles in panel (E) are evaluated. (D) Lateral (x) line profiles were taken without correction (blue), with shallow correction (red), and with full correction (green). (E) Axial (z) line profiles taken from z-stacks with 0.2 μm step around the imaging plane, without correction (blue), with shallow correction (red), and with full correction (green).
FIGURE 4
FIGURE 4
Maximal-intensity projections of YFP-labeled hippocampus neurons at 1150–1100 μm below the surface of the brain measured before (A) and after (B) AO correction. (C) Lateral line intensity profiles, marked in red in the xy image, before (blue) and after (green) correction. (D) Axial line intensity profiles, marked in purple in the yz image, before (blue) and after (green) correction. (E) Phase pattern applied with the SLM for the AO correction of the hippocampal neurons.
FIGURE 5
FIGURE 5
Projection of neurons and dendrites at 600 μm depth before (A) and after (B) AO correction, scale bar, 10 μm. (C) Normalized lateral line profiles of a dendritic spine (see white arrow) before (blue), and after (green) correction. (D) Normalized axial line profile of a dendrite before (blue), and after (green) correction.
FIGURE 6
FIGURE 6
Dependency of signal improvement by AO correction (i.e., the ratio of the sum pixel values of a neuron before and after AO) on the field of view: hippocampal neurons at 1120 μm depth before (A) and after (B) AO correction. To better quantify the signal improvement for neurons labeled in panels (A,B), we show in panels (C1–C8) cross-sections of lateral line profiles measured before (blue) and after (green) AO correction. All plots are normalized so that the maximal signal before correction is one. The numbers correspond to the neurons indicated in panels (A,B). (D) Signal improvement factors as a function of distance from the exact location for AO correction.
FIGURE 7
FIGURE 7
Unwrapped phase maps (A) above (at 800 μm depth) and (B) below (at 1000 μm depth) the white matter. (C) The unwrapped phase difference between the two maps.
FIGURE 8
FIGURE 8
Images of YFP labeled dendrites at 715 μm below the surface of the brain, before (A) and (B) after correction. Imaging conditions: 15 mW with 0.5 MHz repetition rate, 110 μm FOV. Dendrites at 600 μm depth before (C) and after (D) correction. FOV is 55 μm. Dendrites at 565 μm depth before (E) and after (F) correction. FOV is 110 μm, scale bar for panels (A–F), 10 μm. Panels (G,H) show zoomed-in images of the areas within the blue box in panels (E,F), respectively. The arrows mark the dendritic spines after correction.

References

    1. Akbari N., Rebec M. R., Xia F., Xu C. (2022). Imaging deeper than the transport mean free path with multiphoton microscopy. Biomed. Opt. Express 13 452–463. 10.1364/BOE.444696 - DOI - PMC - PubMed
    1. Booth M. J. (2006). Wave front sensor-less adaptive optics: a model-based approach using sphere packings. Opt. Express 14 1339–1352. 10.1364/oe.14.001339 - DOI - PubMed
    1. Booth M. J. (2007). Adaptive optics in microscopy. Philos. Trans. R. Soc. A Math. Phys. Eng. Sci. 365 2829–2843. - PubMed
    1. Cheng H., Tong S., Deng X., Liu H., Du Y., He C., et al. (2019). Deep-brain 2-photon fluorescence microscopy in vivo excited at the 1700 nm window. Opt. Lett. 44 4432–4435. 10.1364/OL.44.004432 - DOI - PubMed
    1. Cheng L.-C., Horton N. G., Wang K., Chen S.-J., Xu C. (2014). Measurements of multiphoton action cross sections for multiphoton microscopy. Biomed. Opt. Express 5 3427–3433. 10.1364/BOE.5.003427 - DOI - PMC - PubMed

LinkOut - more resources