. 2022 May 25:9:873483.
doi: 10.3389/fmed.2022.873483. eCollection 2022.

Putative Biomarkers in Tears for Diabetic Retinopathy Diagnosis

Affiliations

Putative Biomarkers in Tears for Diabetic Retinopathy Diagnosis

Madania Amorim et al. Front Med (Lausanne). .

Abstract

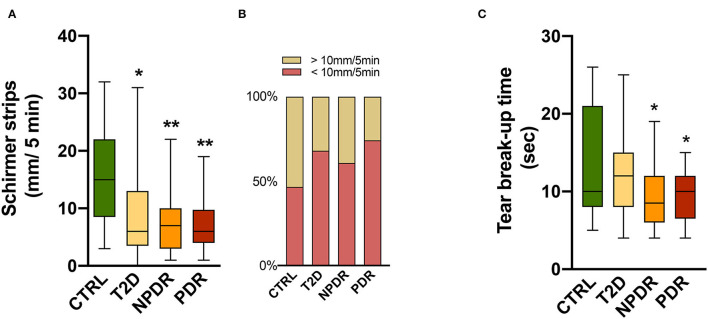
Purpose: Tear fluid biomarkers may offer a non-invasive strategy for detecting diabetic patients with increased risk of developing diabetic retinopathy (DR) or increased disease progression, thus helping both improving diagnostic accuracy and understanding the pathophysiology of the disease. Here, we assessed the tear fluid of nondiabetic individuals, diabetic patients with no DR, and diabetic patients with nonproliferative DR (NPDR) or with proliferative DR (PDR) to find putative biomarkers for the diagnosis and staging of DR.

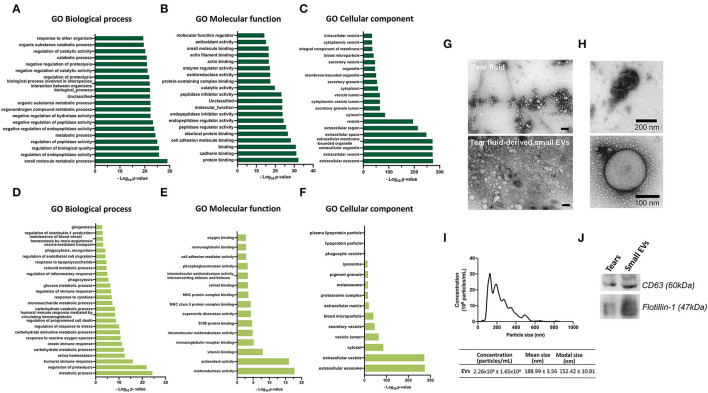
Methods: Tear fluid samples were collected using Schirmer test strips from a cohort with 12 controls and 54 Type 2 Diabetes (T2D) patients, and then analyzed using mass spectrometry (MS)-based shotgun proteomics and bead-based multiplex assay. Tear fluid-derived small extracellular vesicles (EVs) were analyzed by transmission electron microscopy, Western Blotting, and nano tracking.

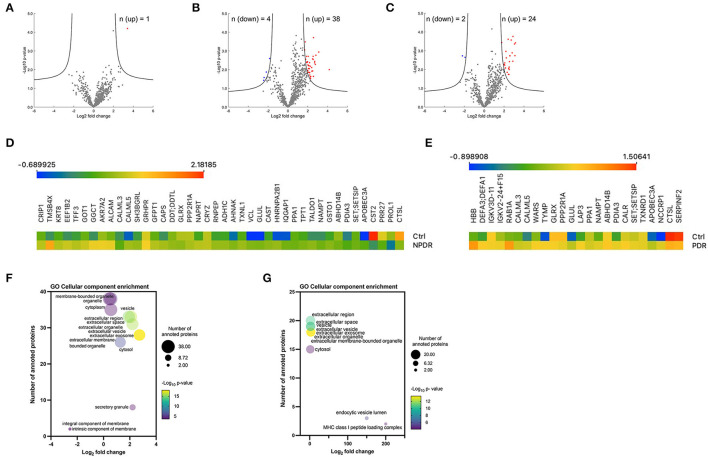
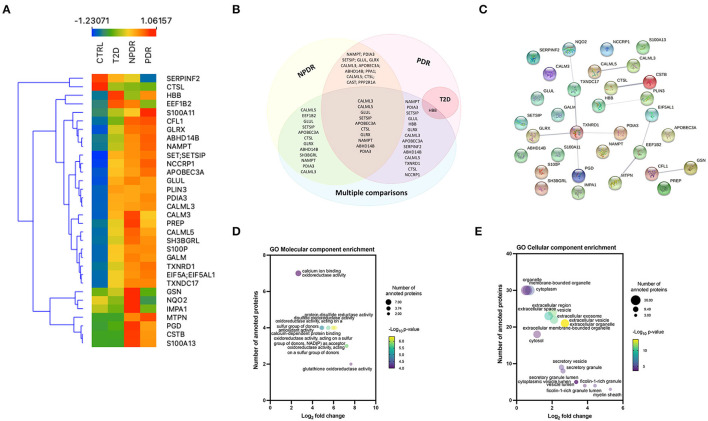
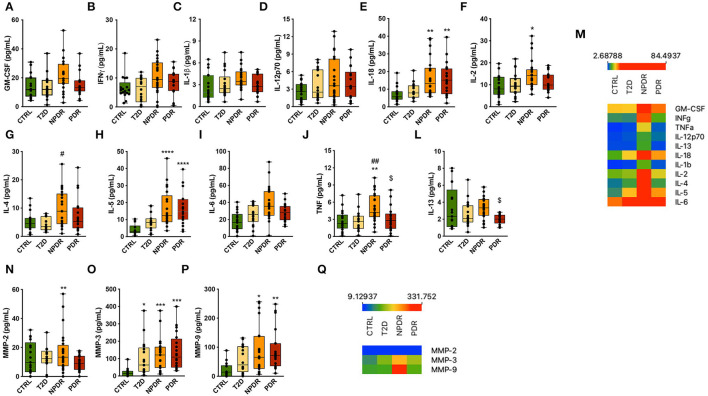
Results: Proteomics analysis revealed that among the 682 reliably quantified proteins in tear fluid, 42 and 26 were differentially expressed in NPDR and PDR, respectively, comparing to the control group. Data are available via ProteomeXchange with identifier PXD033101. By multicomparison analyses, we also found significant changes in 32 proteins. Gene ontology (GO) annotations showed that most of these proteins are associated with oxidative stress and small EVs. Indeed, we also found that tear fluid is particularly enriched in small EVs. T2D patients with NPDR have higher IL-2/-5/-18, TNF, MMP-2/-3/-9 concentrations than the controls. In the PDR group, IL-5/-18 and MMP-3/-9 concentrations were significantly higher, whereas IL-13 was lower, compared to the controls.

Conclusions: Overall, the results show alterations in tear fluid proteins profile in diabetic patients with retinopathy. Promising candidate biomarkers identified need to be validated in a large sample cohort.

Keywords: diabetic retinopathy; exosomes; inflammatory cytokines; metalloproteinases; proteome; tear fluid.


Conflict of interest statement

The authors declare that the research was conducted in the absence of any commercial or financial relationships that could be construed as a potential conflict of interest.

Figures

Figure 1
Figure 1
(A,B) Tear function tests in healthy, nondiabetic controls and T2D patients without DR or with NPDR or PDR. (A) Schirmer test I showing significantly reduced scores in diabetics compared to controls (Kruskal-Wallis test). (B) Above 60% of diabetics have <10 mm/5 min of tears volume, suggesting impairment of tears secretion or production. (C) Tear break-up time (TBUT) showing significantly decreased (One-way ANOVA) values in NPDR and PDR subjects, reflecting changes in tear stability in DR. Values are expressed as mean ± S.D. *p < 0.05, **p < 0.001 vs. CTRL. CTRL, healthy, nondiabetic control; T2D, type 2 diabetes; NPDR, nonproliferative DR; PDR, proliferative DR.
Figure 2
Figure 2
(A–F) Gene Ontology enrichment analysis for GO biological process, molecular function and cellular component terms. Each diagram displays the bar plot of GO category terms along the y-axis and the corresponding degree of enrichment by the –log10 (p-value) on x-axis. Top-ranked 20 enriched significant (A) Biological processes, (B) Molecular functions and (C) Cellular components of quantified proteins by LC-MS/MS. (D–F) Enriched significant biological processes, molecular functions and cellular components of 682 quantified proteins by LC-MS/MS that might be associated with the retina. [Fischer's exact test (FDR p < 0.05)]. (G–J) Tear fluid and tear-derived small EVs from healthy, nondiabetic subjects. (G,H) Transmission electron microscopy images showing small EVs. Small EVs were obtained using Total Exosome Isolation Reagent. Scale bar of panel G: 100 nm. (I) Nanoparticle tracking analysis, showing the small EVs size distributions, mean size, modal size and concentration of particles. (J) Western blot analysis of small EVs using antibodies against CD63 and Flotilin-1.
Figure 3
Figure 3
Overview of significantly regulated proteins in diabetic subgroups compared to control group. (A–C) Volcano plots of proteomic data. Volcano plots were generated in the software Perseus, comparing the differential protein expression in tear fluid between nondiabetic healthy controls and (A) T2D group, (B) T2D with NPDDR, and (C) T2D with PDR. The points indicate different proteins that display magnitude fold-changes (Log2; x-axis) and the p-values (–Log10; y axis) of all proteins quantified in control group and each one of the other groups (two-sample t-test; FDR = 0.05, S0 = 1). Proteins with significant increases are indicated by red circles. Proteins with significant decreases are depicted by blue circles. (D,E) Heatmaps of the differentially expressed proteins. Protein expression values were log2 normalized. Data corresponding to the proteins differentially expressed when comparing (D) NPDR and (E) PDR with the controls. Red indicates a high expression level; blue indicates a low expression level. (F,G) Bubble plots showing the enrichment for GO cellular component terms for the significantly expressed proteins in NPDR and PDR groups. The log2 (fold change) in x-axis represents the ratio of total proteins identified and the different proteins expected to be related to each cellular component; the size of the bubble represents the number of proteins for each cellular component and color represents the –log10 (p-value), which indicates the statistical significancy. No statistically significant enrichment was found in biological process (not presented).
Figure 4
Figure 4
Multiple comparison analysis between the diabetic subgroups and the control group. (A) Heatmap of the 32 significantly expressed proteins across replicates among diabetic subgroups and control group, showing a clear distinction between all the groups, and NPDR and PDR subgroups compared to control group. (B) Venn diagram displaying the overlapping statistically significant proteins between each diabetic subgroup vs. control group and, the comparison of the different groups with each other (multiple comparison). (C) STRING network interactome analysis of statistically significant proteins in multiple comparison. PPI enrichment p-value: 0.00357. Each node represents the 32 statistically significant proteins, the 11 edges represent the protein-protein associations (functionally or physically) and each edge strength represents the confidence of interaction. (D) Bubble plot displaying the significantly enriched GO Molecular function terms for significantly expressed proteins. The log2 fold change in x-axis represents the ratio of proteins; the size of the bubble represents the number of proteins and color represents the statistical significancy. (E) Bubble plot displaying the significantly enriched GO Cellular component terms for the differentially expressed proteins in multiple comparison analysis. Extracellular vesicle and extracellular organelle represented by overlapping yellow bubbles, are the most significant cellular component. No statistically significant enrichment was obtained in biological process (data not shown).
Figure 5
Figure 5
Inflammation-related mediators in nondiabetic controls and T2D patients having no DR or with NPDR or PDR. (A–L) Th1- and Th2-type cytokines (GM-CSF, IFNγ, IL-1β, IL-12p70, IL-18, IL-2, IL-4, IL-5, IL-6, TNF, IL-13) were measured in the tear fluid by multiplex immunoassays. The concentrations of IL-2,−4,−5,−13,−18 and TNF were significantly changed. Increased concentrations of IL-18 and IL-5 were found in NPDR and PDR groups compared to control group, and TNF and IL-2 were found to be increased only in NPDR group. IL-4 and TNF concentrations were also significantly increased in NPDR compared to T2D group. Interestingly, the concentrations of TNF and IL-13 were significantly decreased in PDR group compared to NPDR group. (M) Heatmap of the expression of Th1/Th2 cytokines across replicates among control group and diabetic subgroups. (N–P) Multiplex analysis of MMPs in tear fluid. The concentration of MMP-2 was higher in NPDR group compared to control group. Increased concentrations of MMP-3 and−9 were also found in NPDR and PDR groups. MMP-3 concentration was found to be significantly increased in T2D group. (Q) Heatmap of the MMP's expression across replicates among control group and diabetic subgroups. (n = 17-26 samples/group; Kruskal-Wallis test; *p < 0.05, **p < 0.01, ***p < 0.001 vs. CTRL. ****p <0.0001 vs. Control, #p <0.05 vs T2D, ##p <0.001 vs T2D.

References

    1. Biswas S, Sarabusky M, Chakrabarti S. Diabetic retinopathy, lncrnas, and inflammation: a dynamic, interconnected network. J Clin Med. (2019) 8:1033. 10.3390/jcm8071033 - DOI - PMC - PubMed
    1. Cheung N, Mitchell P, Wong TY. Diabetic retinopathy. Lancet (2010) 376:124–36. 10.1016/S0140-6736(09)62124-3 - DOI - PubMed
    1. Rodriguez ML, Perez S, Mena-Molla S, Desco MC, Ortega AL. Oxidative stress and microvascular alterations in diabetic retinopathy: future therapies. Oxid Med Cell Longev. (2019) 2019:4940825. 10.1155/2019/4940825 - DOI - PMC - PubMed
    1. Youngblood H, Robinson R, Sharma A, Sharma S. Proteomic biomarkers of retinal inflammation in diabetic retinopathy. Int J Mol Sci. (2019) 20:4755. 10.3390/ijms20194755 - DOI - PMC - PubMed
    1. Duh EJ, Sun JK, Stitt AW. Diabetic retinopathy: current understanding, mechanisms, and treatment strategies. JCI Insight. (2017) 2:e93751. 10.1172/jci.insight.93751 - DOI - PMC - PubMed