. 2022 May 26:13:897886.
doi: 10.3389/fgene.2022.897886. eCollection 2022.

Identification of Immune-Related Genes for Risk Stratification in Multiple Myeloma Based on Whole Bone Marrow Gene Expression Profiling

Affiliations

Identification of Immune-Related Genes for Risk Stratification in Multiple Myeloma Based on Whole Bone Marrow Gene Expression Profiling

Qiang-Sheng Wang et al. Front Genet. .

Abstract

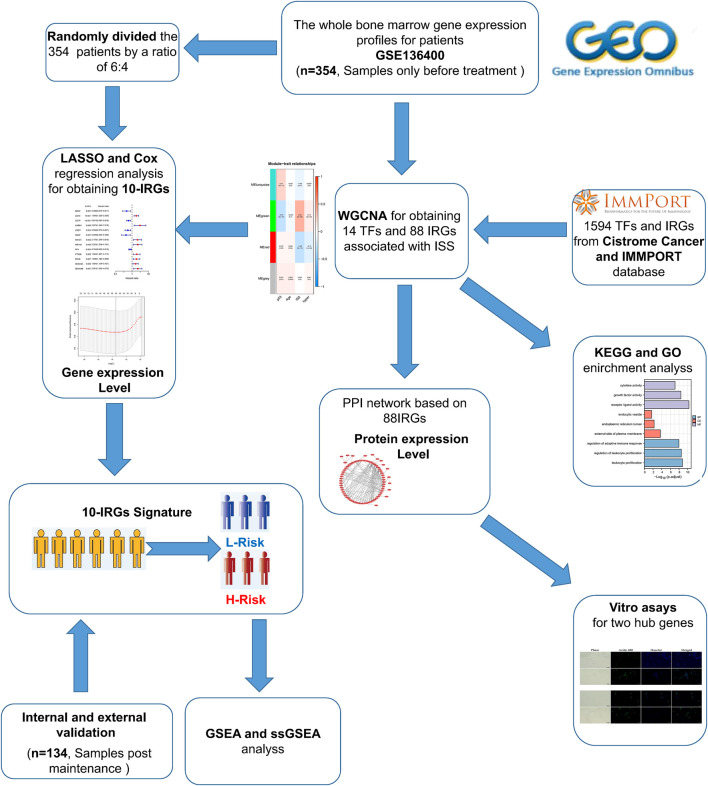
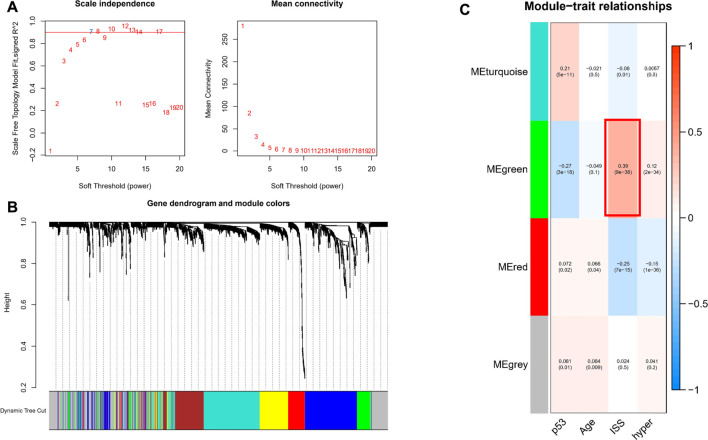
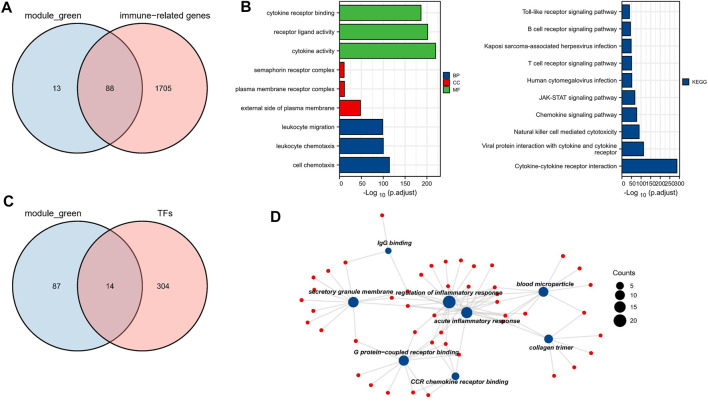
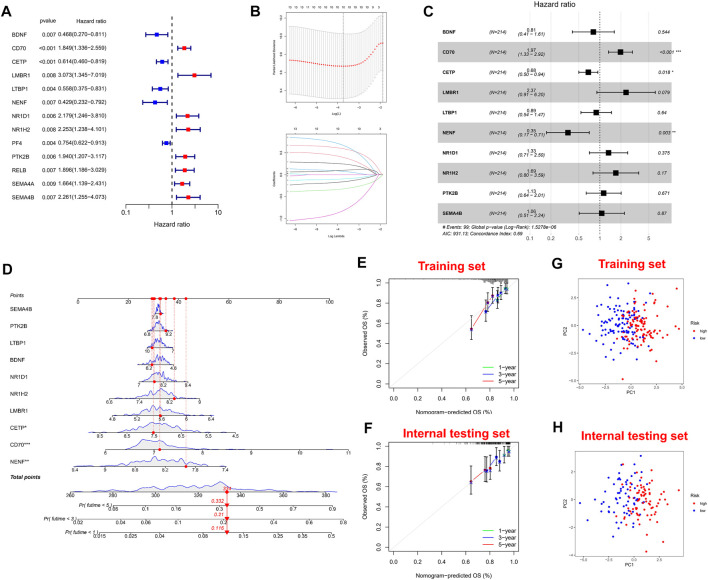
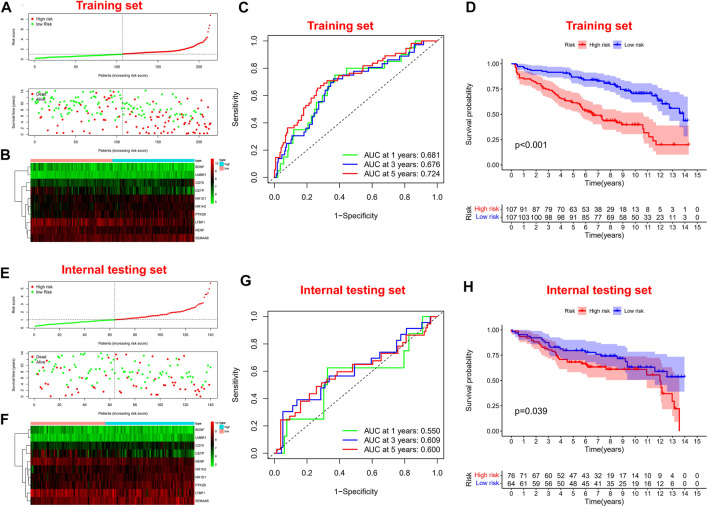
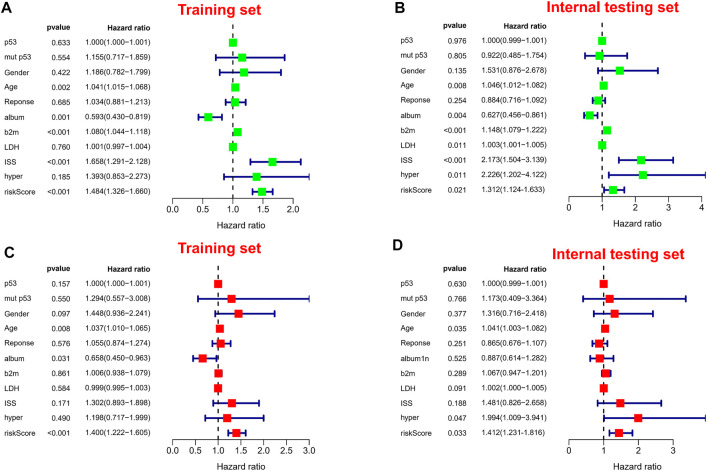
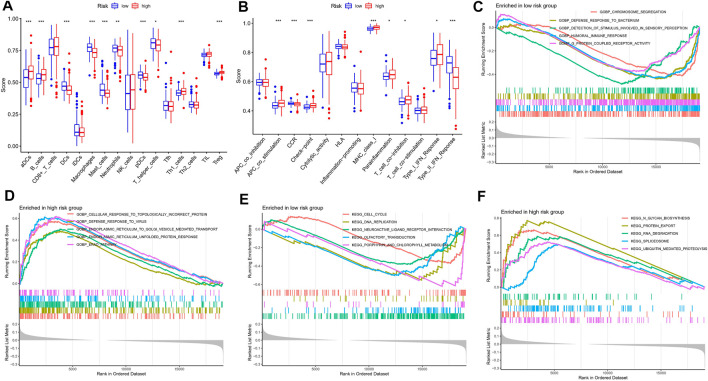
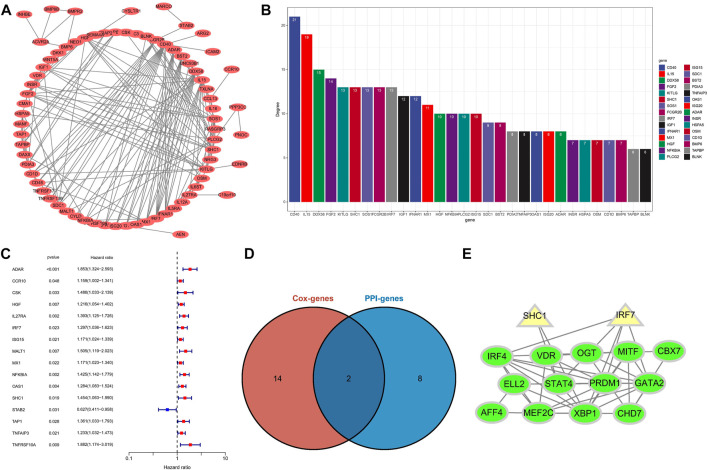
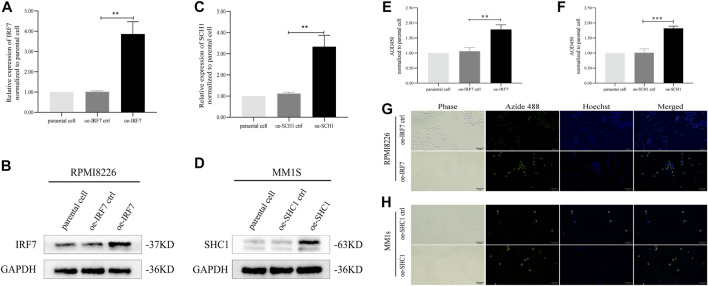
Background: Multiple myeloma (MM) is characterized by abnormal proliferation of bone marrow clonal plasma cells. Tumor immunotherapy, a new therapy that has emerged in recent years, offers hope to patients, and studying the expression characteristics of immune-related genes (IRGs) based on whole bone marrow gene expression profiling (GEP) in MM patients can help guide personalized immunotherapy. Methods: In this study, we explored the potential prognostic value of IRGs in MM by combining GEP and clinical data from the GEO database. We identified hub IRGs and transcription factors (TFs) associated with disease progression by Weighted Gene Co-expression Network Analysis (WGCNA), and modeled immune-related prognostic signature by univariate and multivariate Cox and least absolute shrinkage and selection operator (LASSO) regression analysis. Subsequently, the prognostic ability of signature was verified by multiple statistical methods. Moreover, ssGSEA and GSEA algorithm reveled different immunological characteristics and biological function variation in different risk groups. We mapped the hub IRGs by protein-protein interaction network (PPI) and extracted the top 10 ranked genes. Finally, we conducted vitro assays on two alternative IRGs. Results: Our study identified a total of 14 TFs and 88 IRGs associated with International Staging System (ISS). Ten IRGs were identified by Cox -LASSO regression analysis, and used to develop optimal prognostic signature for overall survival (OS) in MM patients. The 10-IRGs were BDNF, CETP, CD70, LMBR, LTBP1, NENF, NR1D1, NR1H2, PTK2B and SEMA4. In different groups, risk signatures showed excellent survival prediction ability, and MM patients also could be stratified at survival risk. In addition, IRF7 and SHC1 were hub IRGs in PPI network, and the vitro assays proved that they could promote tumor progression. Notably, ssGSEA and GSEA results confirmed that different risk groups could accurately indicate the status of tumor microenvironment (TME) and activation of biological pathways. Conclusion: Our study suggested that immune-related signature could be used as prognostic markers in MM patients.

Keywords: IRF7; SHC1; immune-related genes; multiple myeloma; prognostic model; whole bone marrow sequencing.


Conflict of interest statement

The authors declare that the research was conducted in the absence of any commercial or financial relationships that could be construed as a potential conflict of interest.

Figures

FIGURE 1
FIGURE 1
Flaw chart.
FIGURE 2
FIGURE 2
WGCNA of all samples. (A) Soft threshold was identified by scale independence and mean connectivity. (B) Transcriptome data was classified into different modules. (C) Association between the modules and clinical traits.
FIGURE 3
FIGURE 3
Biological function analysis of TFs and IRGs. (A) The venn plot of green module and IRGs. (B) IRGs for GO and KEGG pathway enrichment analysis (C) The venn plot of green module and TFs. (D) The main biological process of TFs enrichment.
FIGURE 4
FIGURE 4
Construction and validation of immune-related signature. (A) A forest of univariate cox regression analysis in training set. (B) LASSO regression analysis for most suitable λ. (C) A forest of multivariate cox regression analysis. (D) Nomogram based on 10-IRGs. (E) Calibration curve in the training set. (F) Calibration curve in the internal testing set. (G) PCA plot in the training set. (H) PCA plot in the internal testing set. The red dots represent high-risk patients and blue dots represent low-risk patients.
FIGURE 5
FIGURE 5
Survival prognostic prediction to test the prognostic model. (A, B) Distribution of risk scores, survival status and corresponding gene expression levels of patients in the training set. (C) ROC analysis about one, three, and five-year survival prediction in the training set. (D) Kaplan–Meier analysis in the training set. (E, F) Distribution of risk scores, survival status and corresponding gene expression levels of patients in the internal testing set. (G) ROC analysis about one, three, and five-year survival prediction in the internal testing set. (H) Kaplan–Meier analysis in the internal testing set.
FIGURE 6
FIGURE 6
Independent prognostic analysis. (A,B) Forest plots of univariate Cox regression analysis in different sets. (C,D) Forest plots of multivariate Cox regression analysis in different sets.
FIGURE 7
FIGURE 7
Immune infiltration analysis and GSEA. (A) A box plot showed difference of 21 immune cells in different risk subgroups. (B) A box plot showed difference of eight immune related pathways in different risk subgroups. (C,D) GSEA analysis in the high-risk group. (E,F) GSEA analysis in the low-risk group.
FIGURE 8
FIGURE 8
Identification of hub IRGs related to prognosis in PPI network. (A) Based on the STRING database, 88 IRGs ring PPI networks are constructed. (B) PPI network analyzes topological degree. (C) A forest plot of univariate Cox regression analysis in the entire set. (D) Venn plot of the Top10 IRGs of PPI network and prognostic-related IRGs. (E) Analysis of the interaction between TFs and core IRGs.
FIGURE 9
FIGURE 9
IRF7, SHC1 promote tumor cell proliferation. (A–D) qPCR experiment and Western Blot experiment to detect the expression of IRF7 and SHC1. (E–H) CCK8 immunofluorescence staining and EDU test to detect the proliferation of tumor cells in the experiment and the control group MM. Protein expression was determined by western blotting and representative results from one of the three independent experiments are presented. Bar graphs were average of experimental replicates from three independent experiments. Error bars represent mean ± s.d.; **p < 0.01; ***p < 0.001; by unpaired two-sided Student’s t-test.

References

    1. Ahn R., Sabourin V., Bolt A. M., Hébert S., Totten S., De Jay N., et al. (2017). The Shc1 Adaptor Simultaneously Balances Stat1 and Stat3 Activity to Promote Breast Cancer Immune Suppression. Nat. Commun. 8, 14638. 10.1038/ncomms14638 - DOI - PMC - PubMed
    1. Botta C., Di Martino M. T., Ciliberto D., Cucè M., Correale P., Rossi M., et al. (2016). A Gene Expression Inflammatory Signature Specifically Predicts Multiple Myeloma Evolution and Patients Survival. Blood Cancer J. 6 (12), e511. 10.1038/bcj.2016.118 - DOI - PMC - PubMed
    1. Corre J., Munshi N. C., Avet-Loiseau H. (2021). Risk Factors in Multiple Myeloma: Is it Time for a Revision? Blood 137 (1), 16–19. 10.1182/blood.2019004309 - DOI - PMC - PubMed
    1. Gerecke C., Fuhrmann S., Strifler S., Schmidt-Hieber M., Einsele H., Knop S. (2016). The Diagnosis and Treatment of Multiple Myeloma. Dtsch. Arztebl Int. 113 (27-28), 470–476. 10.3238/arztebl.2016.0470 - DOI - PMC - PubMed
    1. Grossman S. R., Lyle S., Resnick M. B., Sabo E., Lis R. T., Rosinha E., et al. (2007). p66 Shc Tumor Levels Show a Strong Prognostic Correlation with Disease Outcome in Stage IIA Colon Cancer. Clin. Cancer Res. 13 (19), 5798–5804. 10.1158/1078-0432.CCR-07-0073 - DOI - PubMed