. 2022 May 25:13:872396.
doi: 10.3389/fneur.2022.872396. eCollection 2022.

Investigating Serum sHLA-G Cooperation With MRI Activity and Disease-Modifying Treatment Outcome in Relapsing-Remitting Multiple Sclerosis

Affiliations

Investigating Serum sHLA-G Cooperation With MRI Activity and Disease-Modifying Treatment Outcome in Relapsing-Remitting Multiple Sclerosis

Roberta Amoriello et al. Front Neurol. .

Abstract

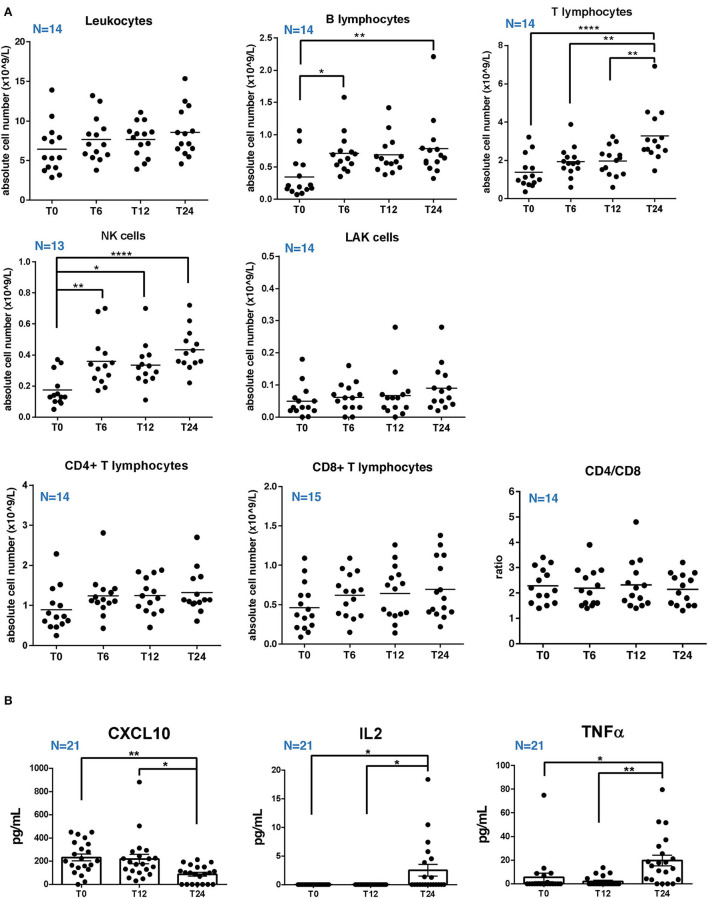
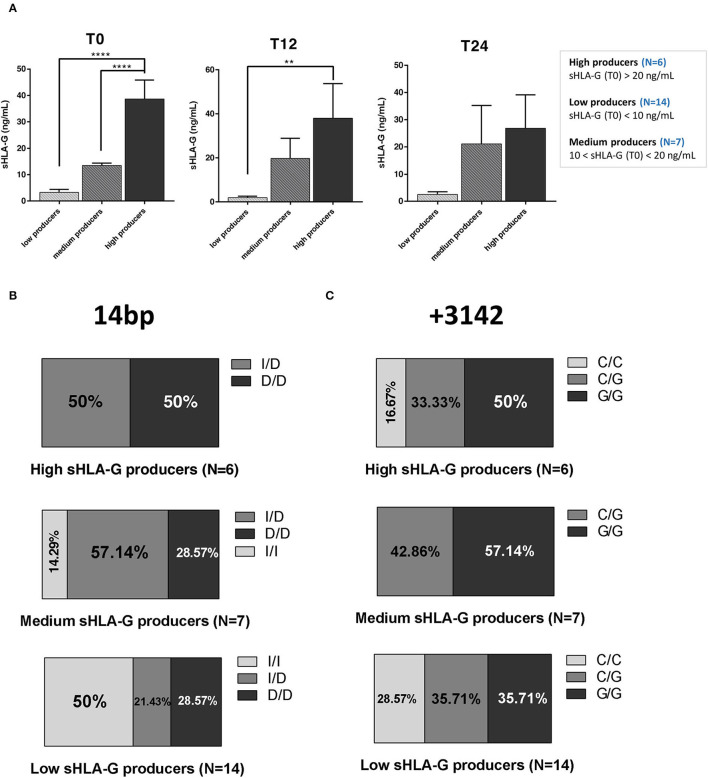
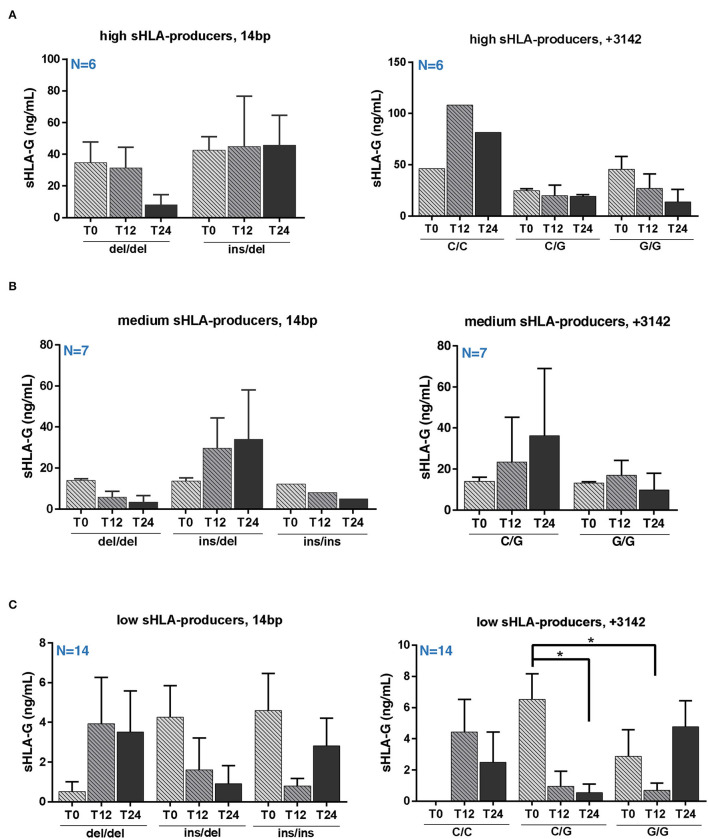
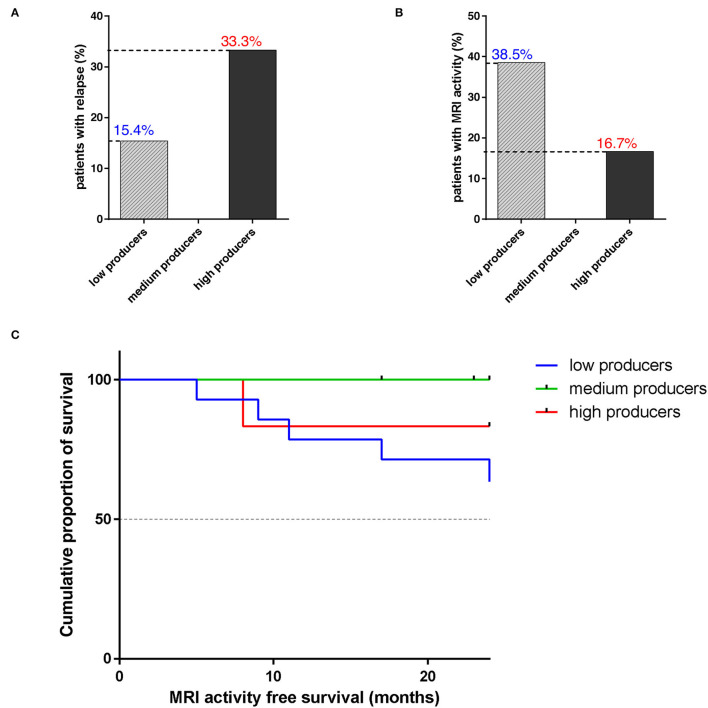
Relapsing-remitting multiple sclerosis (RRMS) is a demyelinating disease in which pathogenesis T cells have a major role. Despite the unknown etiology, several risk factors have been described, including a strong association with human leukocyte antigen (HLA) genes. Recent findings showed that HLA class I-G (HLA-G) may be tolerogenic in MS, but further insights are required. To deepen the HLA-G role in MS inflammation, we measured soluble HLA-G (sHLA-G) and cytokines serum level in 27 patients with RRMS at baseline and after 12 and 24 months of natalizumab (NTZ) treatment. Patients were divided into high (sHLA-G>20 ng/ml), medium (sHLA-G between 10 and 20 ng/ml), and low (sHLA-G <10 ng/ml) producers. Results showed a heterogeneous distribution of genotypes among producers, with no significant differences between groups. A significant decrease of sHLA-G was found after 24 months of NTZ in low producers carrying the +3142 C/G genotype. Finally, 83.3% of high and 100% of medium producers were MRI-activity free after 24 months of treatment, compared to 63.5% of low producers. Of note, we did not find any correlation of sHLA-G with peripheral cell counts or cytokines level. These findings suggest that serum sHLA-G level may partly depend on genotype rather than peripheral inflammation, and that may have impacted on MRI activity of patients over treatment.

Keywords: cytokines; disease activity; multiple sclerosis; natalizumab; serum sHLA-G.


Conflict of interest statement

The authors declare that the research was conducted in the absence of any commercial or financial relationships that could be construed as a potential conflict of interest.

Figures

Figure 1
Figure 1
Absolute cell counts of circulating lymphocytes and serum cytokines level in RRMS patients under natalizumab. (A) Percentage and absolute cell count of total T, B, natural killer (NK), lymphokine-activated killer (LAK) cells, and the ratio between CD4 and CD8 T cells (CD4/CD8) at baseline (T0) and after 6, 12, or 24 (T6, T12, and T24) months of natalizumab (NTZ) treatment. Each dot represents a patient. Patients' number is shown in blue for each graph. Mean ± SEM is reported. Statistical significance was determined by one-way ANOVA followed by post-hoc Tukey test (*p < 0.05; **p < 0.01; and ****p < 0.0001). (B) Concentration (pg/ml) of CXCL10, TNFα, and IL2 in serum of patients with RRMS at T0 or at T12 and T24 of NTZ treatment. Each dot represents a patient. Patients' number is shown in blue for each graph. Mean ± SEM is reported. Statistical significance was determined by one-way ANOVA followed by post-hoc Tukey test (*p < 0.05; **p < 0.01).
Figure 2
Figure 2
RRMS patients under natalizumab are divided into high, medium, and low sHLA-G producers, who are characterized by different 14 bp and +3142 genotypes distribution. (A) sHLA-G production (ng/ml) in low, medium, and high producers at baseline (T0; left graph), at T12 (middle graph), and at T24 (right graph) of NTZ treatment. A total of 27 RRMS were divided into 3 groups (14 low producers, 7 medium producers, and 6 high producers) based on serum sHLA-G concentration, as reported in the legend. Mean ± SEM is reported (one-way ANOVA followed by post-hoc Tukey's test; **p < 0.01; ****p < 0.0001). (B) Percentage of 3 different genotypes of the 14 bp polymorphism of the HLA-G gene in high, medium, and low sHLA-G producers within the RRMS cohort: insertion/insertion (I/I), insertion/deletion (I/D), and deletion/deletion (D/D). (C) Percentage of 3 different genotypes of the +3142 C>G polymorphism (C/C, C/G, and G/G) of the HLA-G gene in high, medium, and low sHLA-G producers within the RRMS cohort. Chi-square test was used.
Figure 3
Figure 3
Serum sHLA-G variation in RRMS patients during natalizumab is partially genotype-dependent. Serum sHLA-G production (ng/ml) in RRMS patients at T0, T12, and T24 of NTZ treatment divided patients into high (A), medium (B), and low (C) sHLA-G producers. Each group of patients is furtherly distinguished based on their HLA-G genotype (14 bp, left graphs; +3142 bp, right graphs) and polymorphisms. Patients' number is shown in blue for each graph. Mean ± SEM is reported; only the mean is shown for groups including a single observation. Statistical significance was determined by one-way ANOVA followed by post-hoc Tukey test (*p < 0.05).
Figure 4
Figure 4
The majority of high and medium sHLA-G producers are free from disease relapse and MRI activity after 24 months of natalizumab. (A) Percentage of patients with RRMS, divided into low (N = 13; 1/14 was lost from follow-up at 17 months), medium (N = 6; 1/7 was lost from follow-up at 17 months), and high (N = 6) sHLA-G producers, who experienced a disease relapse during NTZ treatment. Chi-square test was used. (B) Percentage of patients with RRMS, divided into low, medium, and high sHLA-G producers, who showed MRI disease activity during treatment. (C) Cumulative proportion of survival (percentage) from MRI activity of patients with RRMS over NTZ treatment (time from 0 to 24 months is reported on x-axis) for low (blue line), medium (green line), and high (red line) sHLA-G producers. Chi-square test was used.

References

    1. Jelcic I, Al Nimer F, Wang J, Lentsch V, Planas R, Jelcic I, et al. Memory B cells activate brain-homing, autoreactive CD4+ T cells in multiple sclerosis. Cell. (2018) 175:85–100.e23. 10.1016/j.cell.2018.08.011 - DOI - PMC - PubMed
    1. Walton C, King R, Rechtman L, Kaye W, Leray E, Marrie RA, et al. Rising prevalence of multiple sclerosis worldwide: insights from the Atlas of MS, third edition. Mult Scler Houndmills Basingstoke Engl. (2020) 26:1816–21. 10.1177/1352458520970841 - DOI - PMC - PubMed
    1. Milo R, Kahana E. Multiple sclerosis: geoepidemiology, genetics and the environment. Autoimmun Rev. (2010) 9:A387–94. 10.1016/j.autrev.2009.11.010 - DOI - PubMed
    1. Ballerini C. HLA–multiple sclerosis association in Continental Italy and correlation with disease prevalence in Europe. J Neuroimmunol. (2004) 150:178–85. 10.1016/j.jneuroim.2004.01.015 - DOI - PubMed
    1. Barcellos LF, Oksenberg JR, Green AJ, Bucher P, Rimmler JB, Schmidt S, et al. Genetic basis for clinical expression in multiple sclerosis. Brain J Neurol. (2002) 125:150–8. 10.1093/brain/awf009 - DOI - PubMed