. 2022 May 26:13:919946.
doi: 10.3389/fpls.2022.919946. eCollection 2022.

Family Members Additively Repress the Ectopic Expression of BASIC PENTACYSTEINE3 to Prevent Disorders in Arabidopsis Circadian Vegetative Development

Affiliations

Family Members Additively Repress the Ectopic Expression of BASIC PENTACYSTEINE3 to Prevent Disorders in Arabidopsis Circadian Vegetative Development

Yi-Chen Lee et al. Front Plant Sci. .

Abstract

BARLEY B-RECOMBINANT/BASIC PENTACYSTEINE (BBR/BPC) family members are plant-specific GAGA-motif binding factors (GAFs) controlling multiple developmental processes of growth and propagation. BPCs recruit histone remodeling factors for transcriptional repression of downstream targets. It has been revealed that BPCs have an overlapping and antagonistic relationship in regulating development. In this study, we showed disturbances interfering with the homeostasis of BPC expressions impede growth and development. The ectopic expression of BPC3 results in the daily growth defect shown by higher-order bpc mutants. Oscillations of multiple circadian clock genes are phase-delayed in the quadruple mutant of bpc1 bpc2 bpc4 bpc6 (bpc1,2,4,6). By introducing the overexpression of BPC3 into wild-type Arabidopsis, we found that BPC3 is a repressor participating in its repression and repressing multiple regulators essential to the circadian clock. However, the induction of BPC3 overexpression did not fully replicate clock defects shown by the quadruple mutant, indicating that in addition to the BPC3 antagonization, BPC members also cofunction in the circadian clock regulation. A leaf edge defect similar to that shown by bpc1,2,4,6 is also observed under BPC3 induction, accompanied by repression of a subset of TCPs required for the edge formation. This proves that BPC3 is a repressor that must be confined during the vegetative phase. Our findings demonstrate that BPCs form a meticulous repressor network for restricting their repressive functions to molecular mechanisms controlling plant growth and development.

Keywords: Arabidopsis thaliana; BPC transcription factor; TCP transcription factor; circadian clock; leaf development.


Conflict of interest statement

The authors declare that the research was conducted in the absence of any commercial or financial relationships that could be construed as a potential conflict of interest.

Figures
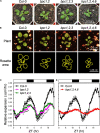
FIGURE 1
FIGURE 1
BPC3 antagonized the circadian growth during the vegetative stage. (A) Plants representing wild-type (Col-0), bpc1,2, bpc1,2,3 and bpc1,2,4,6 grown under the long-day condition (16-h light/8-h dark, 45–55 mmol m–2 s–1) was photographed on day 21 for the size comparison. (B) The hour-growth of the indicated plants was image recorded (upper panel) and outlined by using the tracing tool of ImageJ 1.53c (yellow outlines, lower panel) to project the rosette area. (C,D) Relative expansion of rosette area was measured for each plant line from zeitgeber time 0 (ZT 0) on day 14 to ZT 23 on day 15 based on pixel quantitation of plant outlines. Rosette area across ZT points with a 10-ZT sliding window was averaged to lower leaf movement and nutation effects on the area. Data are mean ± S.E. (n = 7–9). Asterisks indicate ZTs on which the expansion rate of bpc1,2,3 was significantly different from that of bpc1,2 (Student’s t-test; *P < 0.01; n = 9). The expansion rate of Col-0 was duplicated in (C,D) for comparisons with bpc mutantsin plot charts. White and black bars indicate the light and dark periods.
FIGURE 2
FIGURE 2
BPC family members antagonize the transcript level of BPC3. The expression levels of BPC3 were determined in 18-day-old plants of Col-0, bpc4, bpc1,2,4,6 (A), Col-0, bpc1,2, and bpc1,2,3 (B) by using qRT-PCR analyses with the amplicon “b” of BPC3 shown in Figure 3A. Data are mean ± S.E. (n = 3 technical replicates, one independent biological replicate was presented in Supplementary Figure 1). Asterisks indicate BPC3 transcript levels of different genetic backgrounds were significantly different (Student’s t-test; *P < 0.01).
FIGURE 3
FIGURE 3
BPC members are mutually antagonized. (A) Diagrams of gene structures of BPC3 (left panel) and BPC4 (right panel). Translational start and exons are marked with arrows and boxes. Black and gray boxes illustrate the coding region sequence (CDS) and untranslated regions (UTR). Red horizontal bars “a” and “b” illustrate amplicons of qPCR. Numbers denoted in parentheses are positioned relatively to translation start site + 1 for amplicons at CDS or UTR. The illustrated BPC3 5′-UTR of the gene structure is revealed by the EST clone “M44A7” but not shown in the gene model of TAIR10. (B–E) The inducible lines of XVE:BPC4-HA (B,C) and XVE:BPC3-HA (D,E) were treated with 0 (mock) or 50 μmM 17-β-estradiol (β-ES) for 24 h and harvested every 3 h for the next day. The transcription levels of BPC4 (C,E) and BPC3 (B,D) relative to that of UBQ10 were analyzed by qRT-PCRs with amplicons located at the indicated CDS or UTR. Data are mean ± S.E. (n = 27, each data includes 3 technical repeats of 9 biological replicates collected every 3 h across the second day after induction; corresponding individual time points and an independent biological replicate are presented in Supplementary Figure 5). Asterisks indicate transcript levels were significantly changed by β-ES treatments (Student’s t-test; *P < 0.05).
FIGURE 4
FIGURE 4
The expression of clock genes are phase-delayed in the bpc1-1 bpc2 bpc4 bpc6 mutant. (A,B) Eighteen-day-old wild-type (Col-0) and bpc1-1 bpc2 bpc4 bpc6 (bpc1,2,4,6) plants grown under long day (16-h light/8-h dark) were harvested at indicated ZT for profiling circadian clock representative morning gene CCA1 (A) and evening gene ELF4 (B). qRT-PCR analyses were conducted, data are mean ± S.E. (n = 3 technical replicates). Asterisks indicate CCA1 transcript levels were significantly altered in mutants (Student’s t-test; *P < 0.01). (C–J) Eighteen-day-old plants grown under midday (12-h light/12-h dark) were transferred to the constant light (LL) and harvested at 3-h intervals from LL24h to LL72h for CCA1 (C), ELF4 (D), PRR9 (E), PRR7 (F), PRR5 (G), GI (H), PRR3 (I), and TOC1 (J) profiling by qRT-PCR analyses. Data are mean ± S.E. (n = 3 technical replicates; one independent biological replicate was presented in Supplementary Figure 6). White, black, and gray bars denote the light, dark, subjective light, and subjective darkness, respectively.
FIGURE 5
FIGURE 5
Clock genes are phase delayed in bpc1-1 bpc2 bpc4 bpc6. Period lengths of genes phased before (A) and after evening (B) under constant light were calculated by using MFourFit deposited at BioDare2 (Zielinski et al., 2014; https://biodare2.ed.ac.uk/). Data are mean ± S.E. (n = 6, the data include three technical repeats of two independent biological replicates). Asterisks indicate period length was significantly delayed in bpc1,2,4,6 mutant (Student’s t-test; **P < 0.01, *P < 0.05).
FIGURE 6
FIGURE 6
BPC3 is upregulated in the bpc1,2,4,6 and is a negative regulator for CCA1. (A–D) Twelve-day-old plants of XVE:BPC3-HA and XVE:BPC4-HA transgenic lines were treated with 0 (mock) or 50 μM β-estradiol (β-ES) for 24 h when released to LL and harvested at indicated times for profiling CCA1 (A,B) and GI (C,D) by qRT-PCR analyses. Data are means ± S.E. (n = 3 technical replicates; one independent biological replicate was presented in Supplementary Figure 7). Asterisks indicate transcript levels were significantly changed by the β-ES treatment (Student’s t-test; *P < 0.05). (E) BPC3 was associated with the CCA1 promoter in vivo. Leaves of 22-day-old XVE:BPC3-EYFP-HA transgenic plants grown under LD were treated with 0 (mock) or 50 μM β-estradiol at ZT9 for one day and fixed to conduct ChIP-qPCR analyses by using an anti-HA antibody. The diagram shows the translation start site and exons of CCA1 gene structure and upstream region. Gray and black boxes represent untranslated and coding regions, respectively. The amplicons “a,” “b,” and “c” for ChIP-qPCR are indicated by horizontal black bars. Numbers indicate the positions relative to the transcriptional start site + 1 of CCA1. Data are mean ± S.E. (n = 3). Transposable elements At1g50850 and At2g01024 were used as negative controls. Asterisks indicate that amplicons were at least three-fold enriched by the BPC3-EYFP-HA induction significantly (Student’s t-test; *P < 0.01). (F) Chromatin immunoprecipitation qPCR was conducted as described in panel (E). The diagram shows GI gene structure with the amplicons “a” and “b” for ChIP-qPCR assays. Data are mean ± S.E. (n = 3). The asterisk indicates that the amplicon was significantly enriched upon the BPC3-EYFP-HA induction (Student’s t-test; *P < 0.001). An independent biological replicate conducting the GA/TC association tests was shown in Supplementary Figure 7F.
FIGURE 7
FIGURE 7
BPCs negatively regulated circadian clock components. (A–D) qRT-PCR analyses for expression profiles of PRR9 (A,B) and TOC1 (C,D) under the induction of BPC3-HA (A,C) and BPC4-HA (B,D) transgenic lines as described in Figures 6A–D. (E–G) Expression levels of BPC1 (E), BPC2 (F), and BPC6 (G) were profiled under BPC3-HA or BPC4-HA induction. Asterisks indicate the transcript levels were significantly changed by the β-ES treatment (Student’s t-test; *P < 0.05). Data are mean ± S.E. (n = 27, data collected as described in Figure 3; an independent biological replicate and corresponding individual time points are presented in Supplementary Figure 9).
FIGURE 8
FIGURE 8
The ectopic expression of BPC3 impedes leaf development and growth. (A,B) Plants of 14-day-old XVE:BPC3-EYFP-HA were imaged on the 7th (A) and 14th days (B) post induction (DPI) by 0 or 50 μmM β-estradiol (β-ES). Arrowheads indicate the first two true leaves. Arrows indicate the impeded growth and edge formation of younger leaves of the transgenic plants. (C,D) Expressions of TCP3, TCP4, and TCP10 were analyzed by qRT-PCR under the induction of XVE:BPC3-HA (C) and XVE:BPC4-HA (D). (E,F) The expressions of TPC5, TCP13, and TCP17 were analyzed under indicated inductions. The expressions of the indicated TCPs were relative to that of UBQ10. Data are mean ± S.E. (n = 27, data collected as described in Figure 3; an independent biological replicate is presented in Supplementary Figures 10A–D, individual time points are shown in Supplementary Figure 11). Asterisks indicate expressions significantly changed by 50 μmM β-ES treatment (Student’s t-test; *P < 0.05).
FIGURE 9
FIGURE 9
Diagram depicting the repression machinery constituted by BPC members in Arabidopsis vegetative development. Family members BPC1, BPC2, BPC3, BPC4, and BPC6 additively formed a repression network to limit BPC3 expression during the vegetative development. The concurrent mutations on BPC1, BPC2, BPC4, and BPC6 cause the relief of repression on BPC3. The ectopic BPC3 represses multiple clock genes including CCA1 and GI, resulting in the retardation of circadian growth. Simultaneously, BPC3 impedes the formation of leaf edge via repressing a subset of TCPs essential for leaf development. The reciprocal regulations between BPC members are marked with black lines with arrows (positive) or blunt ends (negative) according to the genetic study by Monfared et al. (2011) and BPC3/4 functional assays in this study. BPC3 may activate BPC1 via an indirect mechanism marked as a dashed arrow.

References

    1. Alabadi D., Oyama T., Yanovsky M. J., Harmon F. G., Mas P., Kay S. A. (2001). Reciprocal regulation between TOC1 and LHY/CCA1 within the Arabidopsis circadian clock. Science 293 880–883. 10.1126/science.1061320 - DOI - PubMed
    1. Chang S., Puryear J., Cairney J. (1993). A simple and efficient method for isolating RNA from pine trees. Plant Mol. Biol. Rep. 11 113–116. 10.1385/MB:19:2:201 - DOI
    1. Dowson-Day M. J., Millar A. J. (1999). Circadian dysfunction causes aberrant hypocotyl elongation patterns in Arabidopsis. Plant J. 17 63–71. 10.1046/j.1365-313x.1999.00353.x - DOI - PubMed
    1. Engelmann W., Johnsson A. (1998). “Rhythms in organ movement,” in Biological Rhythms and Photoperiodism in Plants, eds Lumsden P. J., Millar A. J. (Oxford: BIOS Scientific Publishers; ), 35–50.
    1. Fowler S., Lee K., Onouchi H., Samach A., Richardson K., Morris B., et al. (1999). GIGANTEA: a circadian clock-controlled gene that regulates photoperiodic flowering in Arabidopsis and encodes a protein with several possible membrane-spanning domains. EMBO J. 18, 4679–4688. 10.1093/emboj/18.17.4679 - DOI - PMC - PubMed

LinkOut - more resources