. 2022 May 25:13:896691.
doi: 10.3389/fpls.2022.896691. eCollection 2022.

Gene Co-expression Network and Regression Analysis Identify the Transcriptomic, Physiological, and Biochemical Indicators of the Response of Alpine Woody Plant Rhododendron rex to Drought Stress

Affiliations

Gene Co-expression Network and Regression Analysis Identify the Transcriptomic, Physiological, and Biochemical Indicators of the Response of Alpine Woody Plant Rhododendron rex to Drought Stress

Xiong-Li Zhou et al. Front Plant Sci. .

Abstract

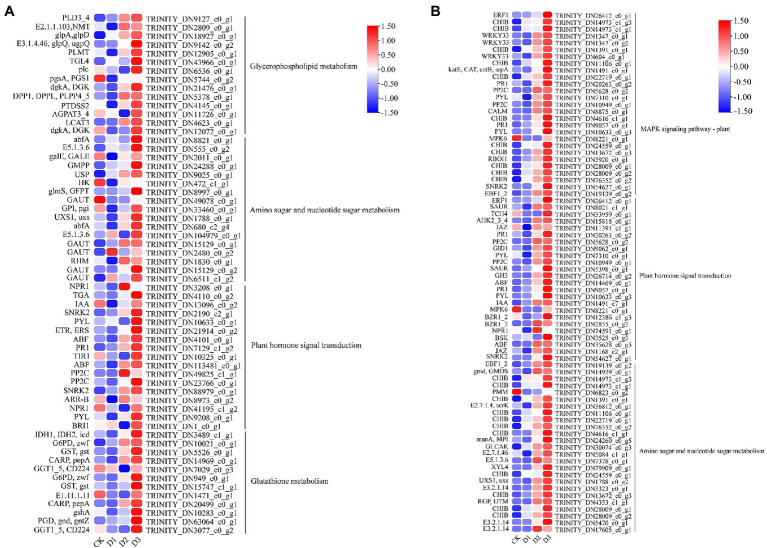
Increasing severity of drought stress due to global change and extreme weather has been affecting the biodiversity, function, and stability of forest ecosystems. However, despite being an important component in the alpine and subalpine vegetation in forest ecosystems, Rhododendron species have been paid rare attention in the study of molecular mechanism of tolerance or response to drought. Herein, we investigated the correlation of transcriptomic changes with the physiological and biochemical indicators of Rhododendron rex under drought stress by using the co-expression network approach and regression analysis. Compared with the control treatment, the number of significantly differentially expressed unigenes (DEGs) increased with the degree of drought stress. The DEGs were mainly enriched in the cell wall metabolic process, signaling pathways, sugar metabolism, and nitrogen metabolism. Coupled analysis of the transcriptome, physiological, and biochemical parameters indicated that the metabolic pathways were highly correlated with the physiological and biochemical indicators under drought stress, especially the chlorophyll fluorescence parameters, such as the actual photosynthetic efficiency of photosystem II, electron transport rate, photochemical quenching coefficient, and the maximum quantum efficiency of photosystem II photochemistry. The majority of the response genes related to the metabolic pathways, including photosynthesis, sugar metabolism, and phytohormone signal pathway, were highly expressed under drought stress. In addition, genes associated with cell wall, pectin, and galacturonan metabolism also played crucial roles in the response of R. rex to drought stress. The results provided novel insight into the molecular response of the alpine woody species under drought stress and may improve the understanding of the response of forest ecosystems to the global climate change.

Keywords: Rhododendron; climate change; drought response; pectin biosynthesis; woody plant.


Conflict of interest statement

The authors declare that the research was conducted in the absence of any commercial or financial relationships that could be construed as a potential conflict of interest.

Figures

Figure 1
Figure 1
The physiological and biochemical indicators differences under drought treatments were observed by one-way ANOVA analysis in Rhododendron rex. (A) malondialdehyde equivalents (MDA, μmol⋅g−1 FW); (B) proline (Pro, μg⋅g−1 FW); (C) total soluble sugar (TSS, μg⋅g−1 FW); (D) the minimal fluorescence from dark-adapted leaf (F0); (E) the maximum fluorescence from dark-adapted leaf (Fm); (F) the maximum quantum efficiency of photosystemIIphotochemistry (Fv/Fm); (G) electron transport rate (ETR, μmol⋅m−2⋅s−1); (H) photochemical quenching coefficient (qP); (I) nonphotochemical quenching (NPQ); (J) nitrogen balance index (NBI); (K) flavoroids (Flv, μg/cm2); (L) anthocyanin (Anth, μg/cm2); (M) chlorophyll (Chl, mg/L); (N) chlorophyll b (Chl b, mg/L); (O) chlorophyll a (Chl a, mg/L). The figures were analyzed and visualized by GraphPad Prism (trial version 9.0). The p values were showed by symbol (*p < 0.05; **p < 0.01; ***p < 0.001; ****p < 0.0001).
Figure 2
Figure 2
The significant differentially expressed unigenes was significant enrichened (p value corrected <0.05) of GO and KEGG pathways. (A) KEGG enrichment pathways; (B) GO enrichment items. The color was represented −log (p value corrected), the red was showed the low p value corrected and the blue was high p value corrected. The up is up-regulated unigenes and the down is down-regulated unigenes. The figures were visualized by TBtools.
Figure 3
Figure 3
The significant differentially expressed unigenes related to cell wall and pectin was significant enriched of GO items in the CK verse D3. The color was showed the expression values (log10(TPM)), and the red represent high TPM. The figures were visualized by TBtools.
Figure 4
Figure 4
The significant differentially expressed unigenes was significant enrichened of KEGG pathways. The (A) is the up- and down-regulated differentially expressed unigenes of D2 and D3 verse CK. The (B) is the up-regulated differentially expressed unigenes of D3 verse CK. The color was showed the expression values (log10(TPM)), and the red represent high TPM. The figures were visualized by TBtools.
Figure 5
Figure 5
The changes in physiology under drought stress are correlated with co-expression networks. Each row corresponds to a module labeled with a color, and it is distinguished by different colors which were arbitrarily assigned by the WGCNA package. Each column corresponds to a tissue type as indicated. The color of each cell at the row–colum intersection indicates the correlation coefficient (R) between the module and the tissue type.
Figure 6
Figure 6
Correlations between specific gene module eigen gene values (first principle component as a representative of the entire module) and corresponding physiological and biochemical indicators for MEred, MEblue, MEbrown, MEgrey. The red line indicates the regression line and lavender shading indicates the 95% confidence interval.
Figure 7
Figure 7
The modules were significant enriched (p value corrected <0.05) KEGG pathways. The color was represented −log (p value corrected), the red was showed the low p value corrected and the blue was high p value corrected. The figures were visualized by TBtools.
Figure 8
Figure 8
The module unigenes correlation with physiological and biochemical indicators was significant enriched of KEGG pathways. (A) is the grey module, (B,C) is the brown module. The color was showed the expression values (log10(TPM)), and the red represent high TPM. The figures were visualized by TBtools.
Figure 9
Figure 9
The module unigenes correlation with physiological and biochemical indicators was significant enrichened of KEGG pathways. The (A) is the green module, (B) is the red module. The color was showed the expression values (log10(TPM)), and the red represent high TPM. The figures were visualized by TBtools.

References

    1. Ahmed I. M., Nadira U. A., Bibi N., Cao F., He X., Zhang G., et al. . (2015). Secondary metabolism and antioxidants are involved in the tolerance to drought and salinity, separately and combined, in Tibetan wild barley. Environ. Exp. Bot. 111, 1–12. doi: 10.1016/j.envexpbot.2014.10.003 - DOI
    1. Ahmed K., Shabbir G., Ahmed M., Shah K. N. (2020). Phenotyping for drought resistance in bread wheat using physiological and biochemical traits. Sci. Total Environ. 729:139082. doi: 10.1016/j.scitotenv.2020.139082, PMID: - DOI - PMC - PubMed
    1. Al-Yasi H., Attia H., Alamer K., Hassan F., Ali E., Elshazly S., et al. . (2020). Impact of drought on growth, photosynthesis, osmotic adjustment, and cell wall elasticity in damask rose. Plant Physiol. Biochem. 150, 133–139. doi: 10.1016/j.plaphy.2020.02.038, PMID: - DOI - PubMed
    1. Andersson J., Wentworth M., Walters R. G., Howard C. A., Ruban A. V., Horton P., et al. . (2003). Absence of the Lhcb1 and Lhcb2 proteins of the light-harvesting complex of photosystem II - effects on photosynthesis, grana stacking and fitness. Plant J. 35, 350–361. doi: 10.1046/j.1365-313x.2003.01811.x, PMID: - DOI - PubMed
    1. Asseng S., Martre P., Maiorano A., Rötter R. P., O’Leary G. J., Fitzgerald G. J., et al. . (2019). Climate change impact and adaptation for wheat protein. Glob. Chang. Biol. 25, 155–173. doi: 10.1111/gcb.14481, PMID: - DOI - PubMed

LinkOut - more resources