. 2022 May 25:13:875788.
doi: 10.3389/fimmu.2022.875788. eCollection 2022.

Bifidobacterium longum Ameliorates Ovariectomy-Induced Bone Loss via Enhancing Anti-Osteoclastogenic and Immunomodulatory Potential of Regulatory B Cells (Bregs)

Affiliations

Bifidobacterium longum Ameliorates Ovariectomy-Induced Bone Loss via Enhancing Anti-Osteoclastogenic and Immunomodulatory Potential of Regulatory B Cells (Bregs)

Leena Sapra et al. Front Immunol. .

Abstract

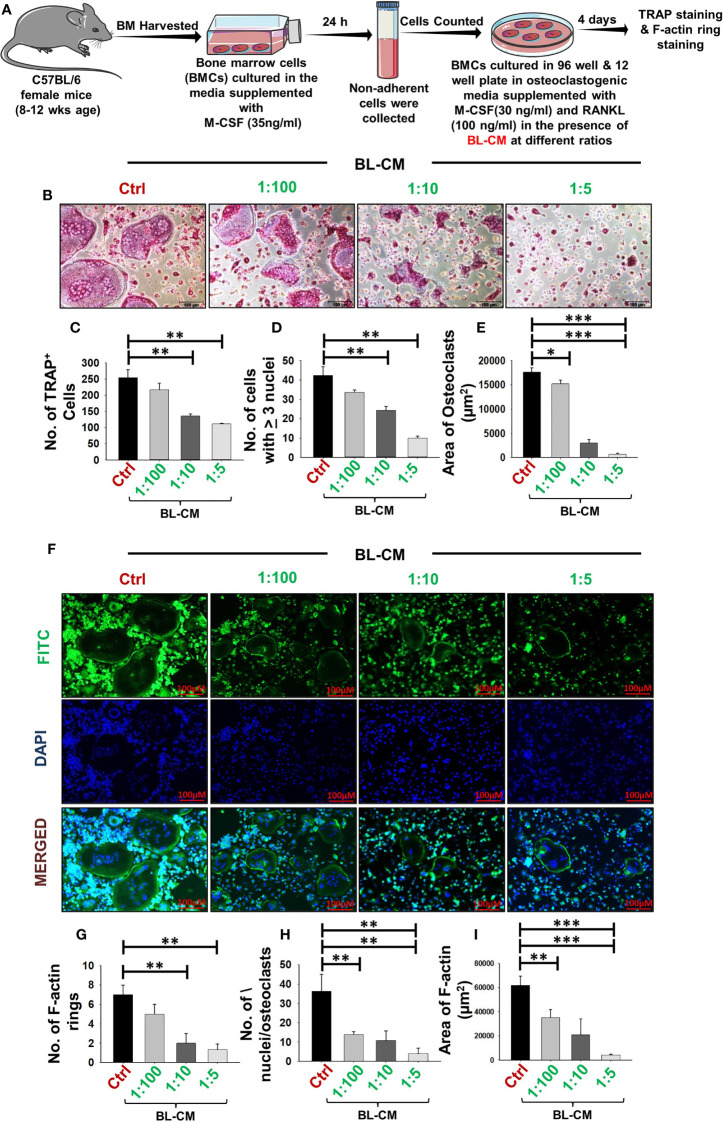
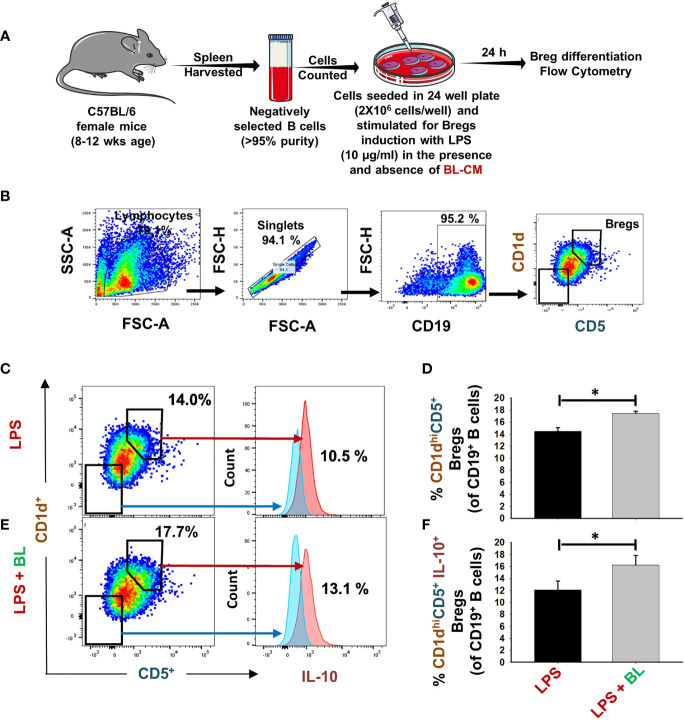
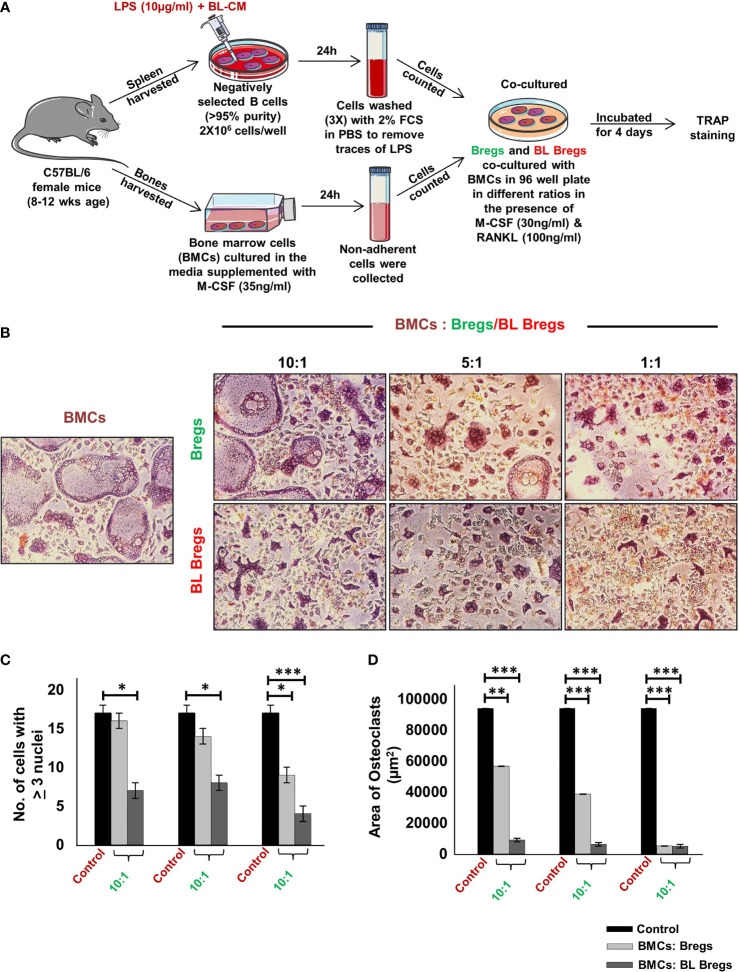
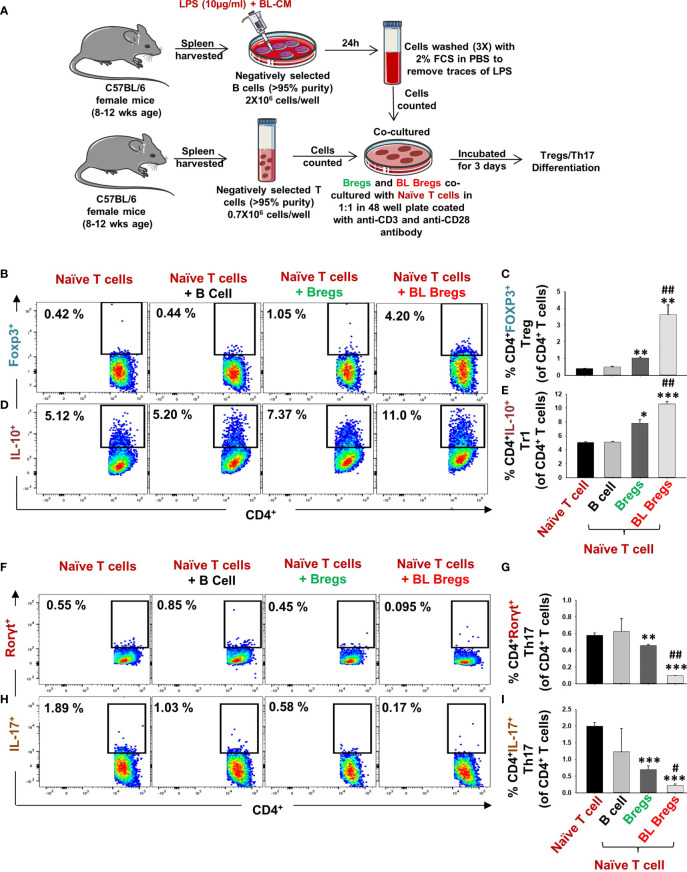
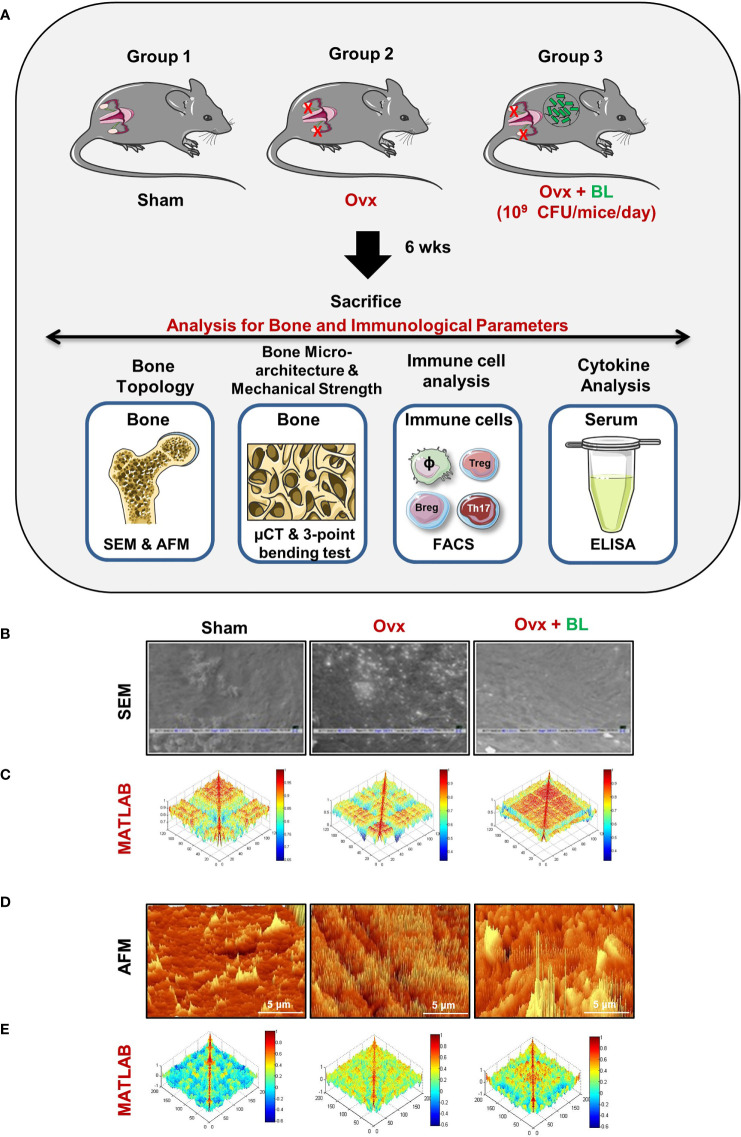
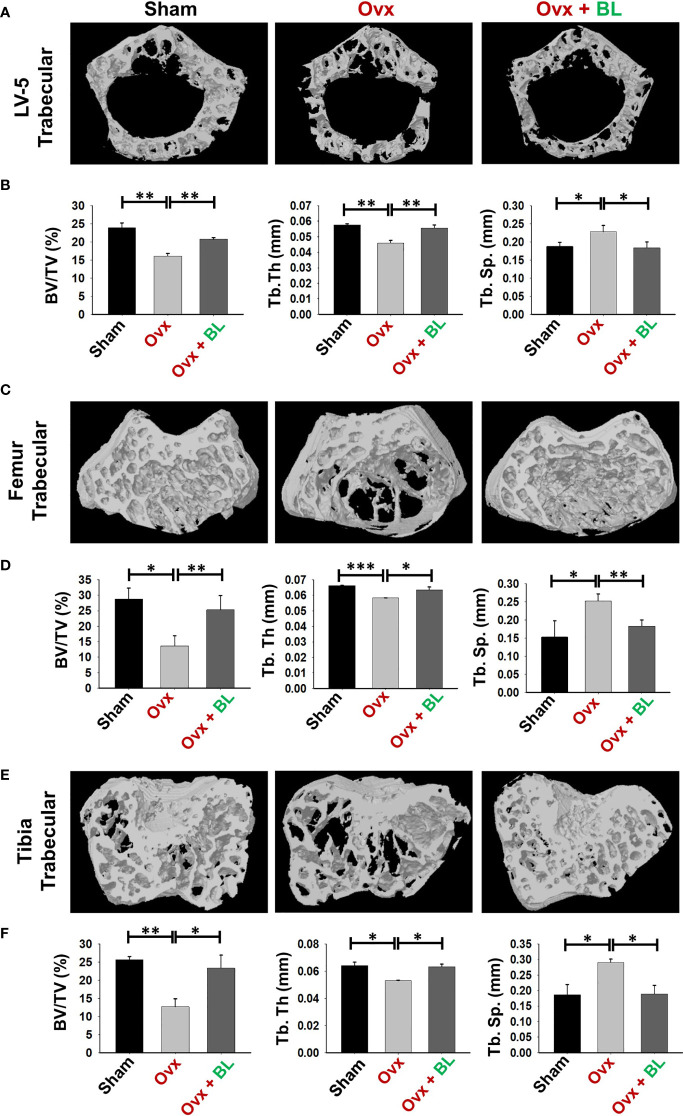
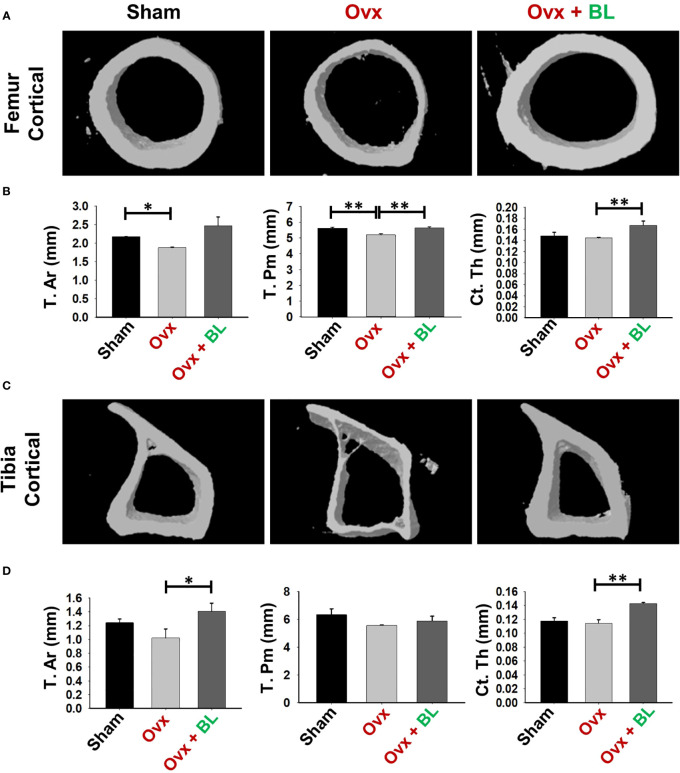
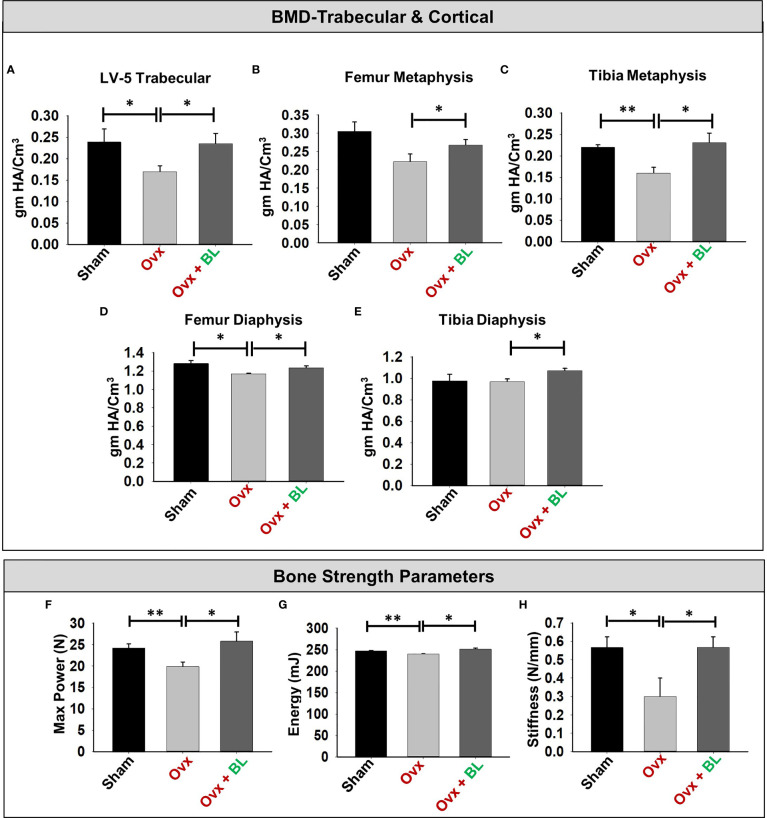
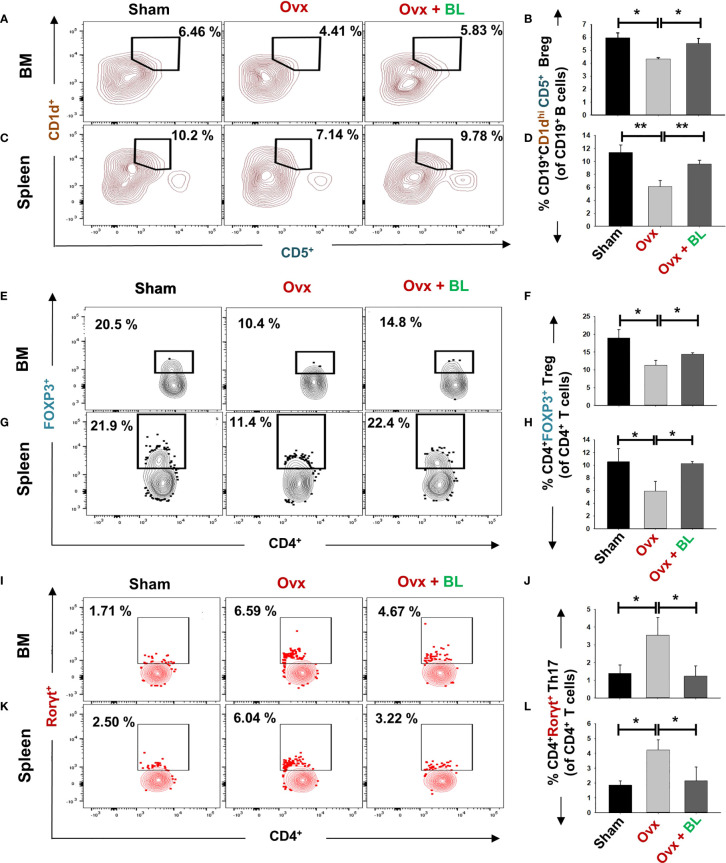
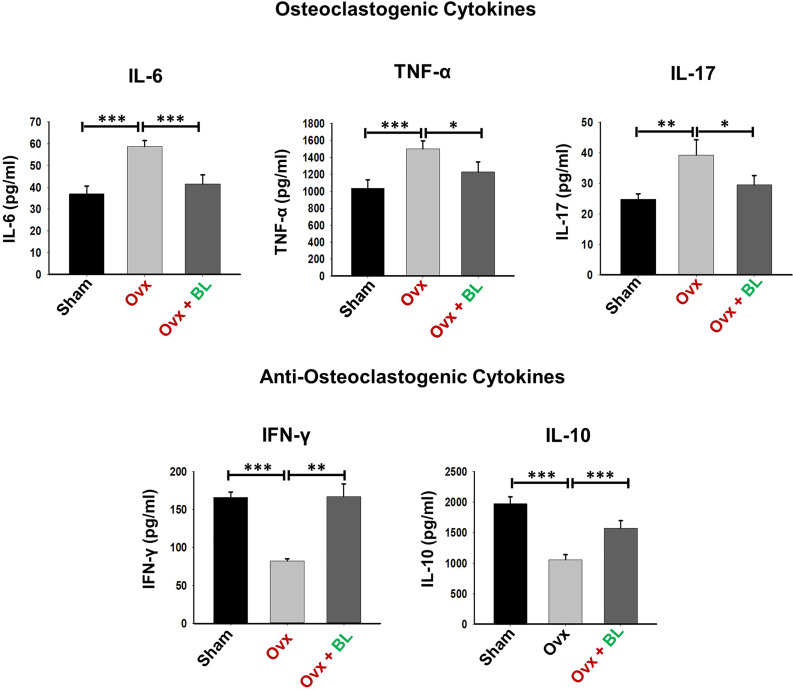
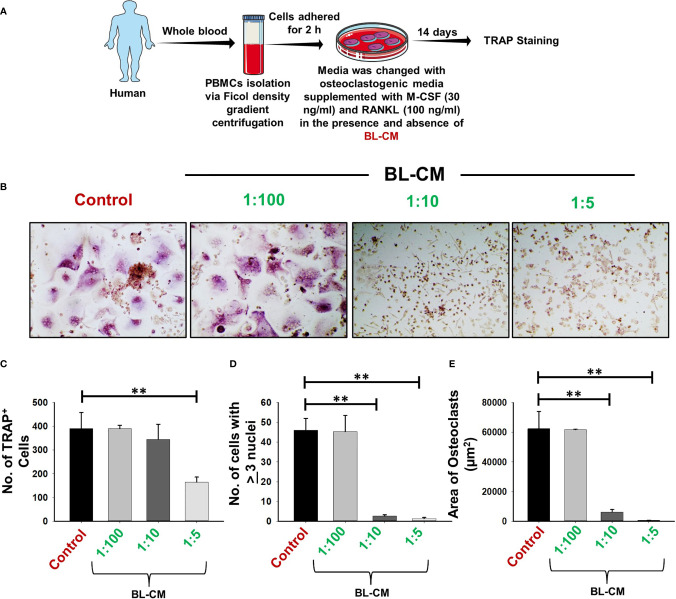
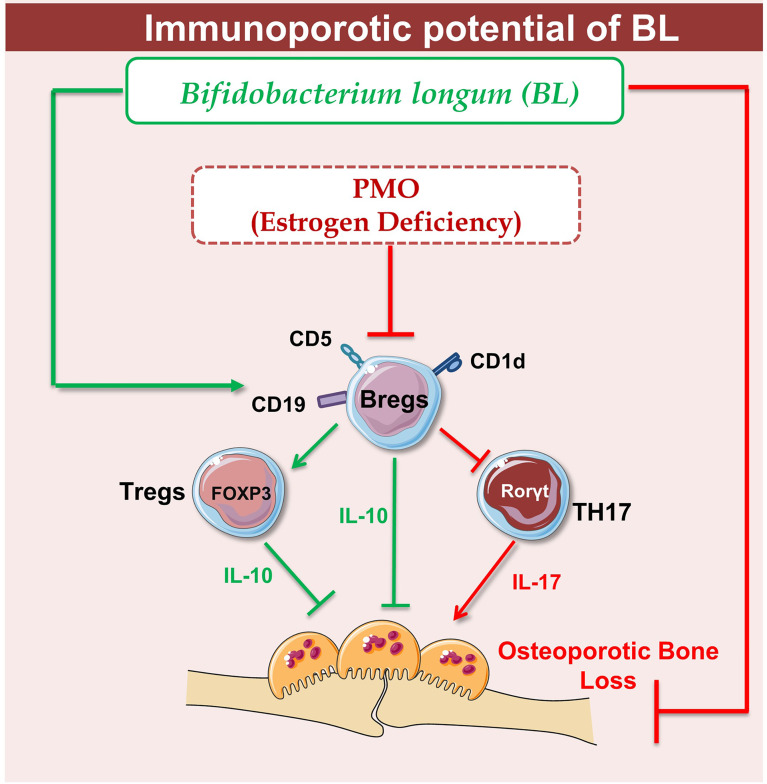
Discoveries in the last few years have emphasized the existence of an enormous breadth of communication between osteo-immune systems. These discoveries fuel novel approaches for the treatment of several bone pathologies including osteoporosis. Bifidobacterium longum (BL) is a preferred probiotic of choice due to its varied immunomodulatory potential in alleviating various inflammatory diseases. Here, we evaluate the effect of BL in an ovariectomy (ovx)-induced post-menopausal osteoporotic mouse model. Our in vitro findings reveal that BL suppresses the differentiation and functional activity of RANKL-induced osteoclastogenesis in both mouse bone marrow cells and human PBMCs. Strikingly, BL-induced Bregs were found to be significantly more efficient in suppressing osteoclastogenesis and modulating Treg-Th17 cell balance with respect to control Bregs in vitro. Our in vivo µCT and bone mechanical strength data further confirm that BL supplementation significantly enhanced bone mass and bone strength, along with improving the bone microarchitecture in ovx mice. Remarkably, alterations in frequencies of CD19+CD1dhiCD5+IL-10+ Bregs, CD4+Foxp3+IL-10+ Tregs, and CD4+Rorγt+IL-17+ Th17 cells in distinct lymphoid organs along with serum-cytokine data (enhanced anti-osteoclastogenic cytokines IFN-γ and IL-10 and reduced osteoclastogenic-cytokines IL-6, IL-17, and TNF-α) strongly support the immunomodulatory potential of BL. Altogether, our findings establish a novel osteo-protective and immunomodulatory potential of BL in augmenting bone health under osteoporotic conditions.

Keywords: Bregs; Th17; Tregs; immunoporosis; osteoporosis; probiotics.


Conflict of interest statement

The authors declare that the research was conducted in the absence of any commercial or financial relationships that could be construed as a potential conflict of interest.

Figures

Figure 1
Figure 1
BL suppress osteoclastogenesis and F-actin polymerization in a dose-dependent manner: (A) Osteoclast differentiation was induced in bone marrow cells (BMCs) with M-CSF (30 ng/ml) and RANKL (100 ng/ml) with or without Bifidobacterium longum-conditioned media (BL-CM) at different ratios of 1:100, 1:10, and 1:5 for 4 days. Giant multinucleated cells were stained with TRAP, and cells with ≥ 3 nuclei were considered as mature osteoclasts. (B) Photomicrographs at ×20 magnification were taken. (C) Number of TRAP-positive cells. (D) Number of TRAP-positive cells with more than 3 nuclei. (E) Area of osteoclasts. (F) F-Actin and nuclei were stained with FITC-conjugated phalloidin and DAPI, respectively. Images were captured in a fluorescence microscope (Imager.Z2 Zeiss microscope) at ×10 magnification. (G) Number of F-actin rings. (H) Number of nuclei per osteoclasts. (I) Area of the F-actin ring. The above images are indicative of one independent experiment, and similar results were obtained in at least three independent experiments (n ≥ 3). Statistical significance was considered as p  ≤  0.05 (*p  ≤  0.05, **p  ≤  0.01, ***p  ≤  0.001) with respect to indicated groups.
Figure 2
Figure 2
BL enhances differentiation of IL-10-producing Bregs: (A) For Bregs stimulation, splenic CD19+ B cells were positively/negatively selected and stimulated with LPS (10 µg/ml) in the presence and absence of BL-CM at 1:5 dilution. After 24 h, cells were analyzed for CD1d CD5 and IL-10 expression by FACS. (B) Gating strategy followed for data analysis. (C) Dot plots and histograms depicting the percentages of CD19+CD1dhighCD5+ Bregs and CD19+CD1dhighCD5+IL-10+Bregs in control. (D) Bar graphs depicting the percentages of CD19+CD1dhighCD5+ Bregs. (E) Dot plots and histograms depicting the percentages of CD19+CD1dhighCD5+ Bregs and CD19+CD1dhighCD5+IL-10+Bregs in BL. Bregs. (F) Bar graphs depicting the percentages of CD19+CD1dhighCD5+IL-10+Bregs. The above images are indicative of one independent experiment, and similar results were obtained in at least three independent experiments (n ≥ 3). Statistical significance was considered as p  ≤  0.05 (*p  ≤  0.05) with respect to indicated groups.
Figure 3
Figure 3
BL enhances anti-osteoclastogenic potential of Bregs: (A) BMCs and LPS stimulated and LPS + BL-CM were cocultured in a cell culture plate in the presence of M-CSF (30 ng/ml) and RANKL (100 ng/ml) for 4 days. B cells were induced with LPS (10 µg/ml) and BL-CM (1:5) for 24 h prior to cocultures. (B) LPS + BL-CM-induced Bregs suppress osteoclastogenesis more efficiently in comparison to LPS-induced Bregs. (C) Number of TRAP-positive cells with more than 3 nuclei. (D) Area of osteoclasts. The above images are indicative of one independent experiment, and similar results were obtained in at least three independent experiments (n ≥ 3). Statistical significance was considered as p  ≤  0.05 (*p  ≤  0.05, **p  ≤  0.01, ***p ≤  0.001) with respect to indicated groups.
Figure 4
Figure 4
BL enhances the immunomodulatory potential of Bregs: (A) Naïve T cells and LPS-stimulated and LPS + BL-CM were cocultured in anti-CD3 and CD28 coated plate for 3 days. B cells were induced with LPS (10 µg/ml) and BL-CM (1:5) for 24 h prior to cocultures. (B) Dot plots depicting the percentages of CD4+FOXP3+ Tregs. (C) Bar graphs representing the percentages of CD4+FOXP3+ Tregs. (D) Dot plots depicting the percentages of CD4+IL-10+ Tr1 cells. (E) Bar graphs representing the percentages of CD4+IL-10+ Tr1 cells. (F) Dot plots depicting the percentages of CD4+Rorγt+Th17 cells. (G) Bar graphs representing the percentages of CD4+Rorγt+Th17 cells. (H) Dot plots depicting the percentages of CD4+IL-17+ Th17 cells. (I) Bar graphs representing the percentages of CD4+IL-17+ Th17 cells. (* denotes comparison of the indicated group with respect to naïve T cells, and # denotes comparison of the indicated group with respect to the Bregs group). The above images are indicative of one independent experiment, and similar results were obtained in at least three independent experiments (n ≥ 3). Statistical significance was considered as p  ≤  0.05 (*p  ≤  0.05, **p  ≤  0.01, ***p  ≤  0.001) with respect to indicated groups (*, ** and *** indicated comparison between Naive T cells and Bregs ; # and ## indicate comparison between Bregs and BL-Bregs).
Figure 5
Figure 5
BL administration attenuates bone loss in Ovx mice: (A) Experimental layout followed for in vivo studies. Mice were divided into 3 groups, viz., sham, Ovx, and Ovx + BL groups, that received BL at 109 CFU/day orally reconstituted in drinking water. At the end of 45 days, mice were sacrificed and analyzed for various parameters. (B) 2D SEM images. (C) 2D MATLAB analysis of SEM images. (D) 3D AFM images. (E) 3D MATLAB analysis of AFM images. The representative images are indicative of one independent experiment, and comparable results were obtained in two different independent experiments with n =6 mice/group/experiment.
Figure 6
Figure 6
BL administration improves trabecular bone microarchitecture. 3D uCT reconstruction of LV-5 trabecular, femur trabecular, and tibia trabecular of all groups. (A) Bone micro-architecture of LV-5 trabecular. (B) Histomorphometric parameters of LV-5 trabecular. (C) Bone micro-architecture of femur trabecular. (D) Histomorphometric parameters of femur trabecular. (E) Bone micro-architecture of tibia trabecular. (F) Histomorphometric parameters of tibia trabecular. Histomorphometric parameters: BV/TV, bone volume/tissue volume ratio; Tb. Th., trabecular thickness; Tb. Sp., trabecular separation. The results were evaluated by ANOVA with subsequent comparisons by Student’s t-test for paired or non-paired data. Values are reported as mean ± SEM. The above graphical representations are indicative of one independent experiment, and similar results were obtained in two different independent experiments with n = 6. Statistical significance was considered as p ≤ 0.05 with respect to indicated mouse groups.
Figure 7
Figure 7
BL administration improves cortical bone microarchitecture. 3D uCT reconstruction of femur cortical and tibia cortical of all groups. (A) Bone micro-architecture of femur cortical. (B) Histomorphometric parameters of femur cortical. (C) Bone micro-architecture of tibia cortical. (D) Histomorphometric parameters of tibia cortical. Histomorphometric parameters of tibia cortical. Tt. Ar., total cross-sectional area; T. Pm., total cross-sectional perimeter; Ct. Th., cortical thickness. The results were evaluated by ANOVA with subsequent comparisons by Student’s t-test for paired or non-paired data. Values are reported as mean ± SEM. The above graphical representations are indicative of one independent experiment, and similar results were obtained in two different independent experiments with n = 6. Statistical significance was considered as p ≤ 0.05 (*p ≤ 0.05, **p ≤ 0.01) with respect to indicated mouse groups.
Figure 8
Figure 8
BL administration enhances bone mineral density (BMD) and mechanical strength of bones. (A) Graphical presentation of BMD of the LV-5 trabecular region, (B) femur metaphysis, (C) tibia metaphysis, (D) femur diaphysis, and (E) tibia diaphysis. (F) Three-point bending test of femur diaphysis representing max power (N), (G) energy (mJ), and (H) stiffness (N/mm). Data are reported as mean ± SEM. Similar results were obtained in two independent experiments with n = 6. Statistical significance of each parameter was assessed by ANOVA followed by paired group comparison. *p < 0.05, **p < 0.01 compared with indicated groups.
Figure 9
Figure 9
BL administration modulates Breg, Tregs, and Th17 cells in vivo. Cells from various lymphoid organs were harvested and analyzed for Bregs and Tregs. (A) Contour plots representing the percentages of CD19+CD1dhi CD5+ Bregs in BM. (B) Bar graphs representing the percentages of CD19+CD1dhi CD5+ Bregs in BM. (C) Contour plots representing the percentages of CD19+CD1dhi CD5+ Bregs in spleen. (D) Bar graphs representing the percentages of CD19+CD1dhi CD5+ Bregs in spleen. (E) Contour plots represent percentages of CD4+Foxp3+ Tregs in BM. (F) Bar graphs representing percentages of CD4+Foxp3+ Tregs in BM. (G) Contour plots represent percentages of CD4+Foxp3+ Tregs in spleen. (H) Bar graphs represent percentages of CD4+Foxp3+ Tregs in spleen. (I) Contour plots represent percentages of CD4+Rorγt+ Th17 cells in BM. (J) Bar graphs representing percentages of CD4+Rorγt+ Th17 cells in BM. (K) Contour plots are representing percentages of CD4+Rorγt+ Th17 cells in spleen. (L) Bar graphs representing percentages of CD4+Rorγt+ Th17 cells in spleen. Data are reported as mean ± SEM. Similar results were obtained in two independent experiments with n = 6. Statistical significance of each parameter was assessed by ANOVA followed by paired group comparison. *p < 0.05, **p < 0.01 compared with indicated groups.
Figure 10
Figure 10
BL modulates cytokine balance in Ovx mice. Osteoclastogenic cytokines were analyzed in serum samples of mice by ELISA. Anti-osteoclastogenic cytokines were analyzed in serum samples of mice by ELISA. The results were evaluated by using ANOVA with subsequent comparisons by Student’s t-test for paired or non-paired data, as appropriate. Values are expressed as mean ± SEM (n = 6), and similar results were obtained in two independent experiments. Statistical significance was defined as p ≤ 0.05, *p ≤ 0.05, **p < 0.01, ***p ≤ 0.001 with respect to the indicated mouse group.
Figure 11
Figure 11
BL-CM suppress osteoclastogenesis in human PBMCs: (A) Osteoclast differentiation was induced in human PBMCs with M-CSF (30 ng/ml) and RANKL (50 ng/ml) with or without Bifidobacterium longum-conditioned media (BL-CM) at different ratios of 1:100, 1:10, and 1:5 for 14 days. Giant multinucleated cells were stained with TRAP, and cells with ≥3 nuclei were considered as mature osteoclasts. (B) Photomicrographs at ×20 magnifications were taken. (C) Number of TRAP-positive cells. (D) Number of TRAP-positive cells with more than 3 nuclei. (E) Area of osteoclasts. The above images are indicative of one independent experiment, and similar results were obtained in at least three different independent experiments. Statistical significance was considered as p  ≤  0.05 (**p  ≤  0.01) with respect to indicated groups.
Figure 12
Figure 12
Summary of our results: Under physiological conditions, Bregs and Tregs inhibit osteoclastogenesis via producing the IL-10 cytokine whereas in osteoporotic conditions, dysregulation of the “Breg–Treg–Th17” cell axis promotes bone loss in osteoporotic conditions. Upon BL administration, enhancement of the Bregs population leads to maintenance of homeostatic balance between Tregs and Th17 cells that prevents the bone loss in osteoporotic conditions (image illustrated using Medical Art https://smart.servier.com/).

Similar articles

Cited by

References

    1. Yu M, Pal S, Paterson CW, Li JY, Tyagi AM, Adams J, et al. . Ovariectomy Induces Bone Loss via Microbial-Dependent Trafficking of Intestinal TNF+ T Cells and Th17 Cells. Clin Invest (2021) 131(4):e143137. doi: 10.1172/JCI143137 - DOI - PMC - PubMed
    1. Srivastava RK, Dar HY, Mishra PK. Immunoporosis: Immunology of Osteoporosis—Role of T Cells. Front Immunol (2018) 9:657. doi: 10.3389/fimmu.2018.00657 - DOI - PMC - PubMed
    1. Sapra L, Azam Z, Rani L, Saini C, Bhardwaj A, Shokeen N, et al. . “Immunoporosis”: Immunology of Osteoporosis. Proc Natl Acad Sci India Sect B Biol Sci (2021) 91:511–19. doi: 10.1007/s40011-021-01238-x - DOI
    1. Pacifici R. The Role of IL-17 and TH17 Cells in the Bone Catabolic Activity of PTH. Front Immunol (2016) 7:57. doi: 10.3389/fimmu.2016.00057 - DOI - PMC - PubMed
    1. Srivastava RK. Osteoimmunology The I Nexus I Between Bone and Immune System. Front Biosci (2018) 23:4600. doi: 10.2741/4600 - DOI - PubMed

Publication types