. 2022 May 26:13:872387.
doi: 10.3389/fimmu.2022.872387. eCollection 2022.

A Machine-Learning Approach to Developing a Predictive Signature Based on Transcriptome Profiling of Ground-Glass Opacities for Accurate Classification and Exploring the Immune Microenvironment of Early-Stage LUAD

Affiliations

A Machine-Learning Approach to Developing a Predictive Signature Based on Transcriptome Profiling of Ground-Glass Opacities for Accurate Classification and Exploring the Immune Microenvironment of Early-Stage LUAD

Zhenyu Zhao et al. Front Immunol. .

Abstract

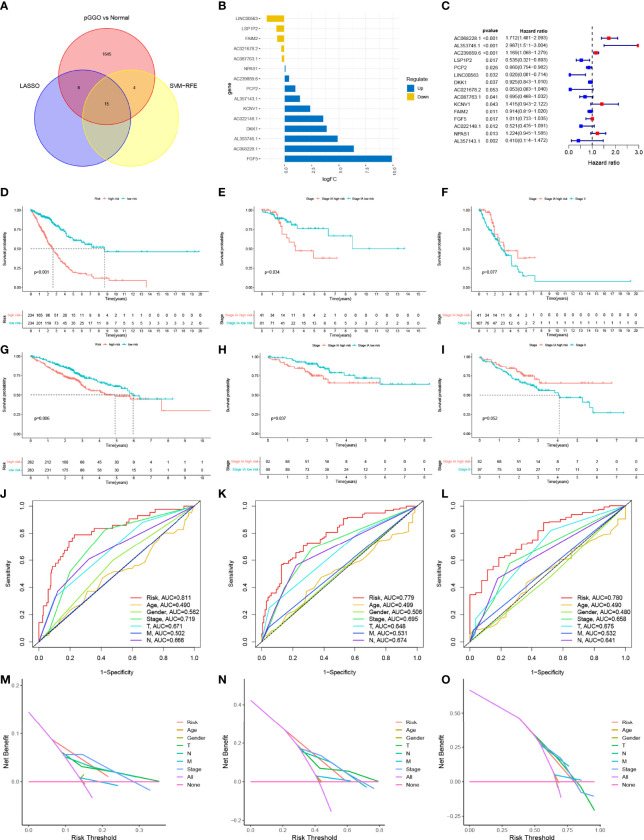
Screening for early-stage lung cancer with low-dose computed tomography is recommended for high-risk populations; consequently, the incidence of pure ground-glass opacity (pGGO) is increasing. Ground-glass opacity (GGO) is considered the appearance of early lung cancer, and there remains an unmet clinical need to understand the pathology of small GGO (<1 cm in diameter). The objective of this study was to use the transcriptome profiling of pGGO specimens <1 cm in diameter to construct a pGGO-related gene risk signature to predict the prognosis of early-stage lung adenocarcinoma (LUAD) and explore the immune microenvironment of GGO. pGGO-related differentially expressed genes (DEGs) were screened to identify prognostic marker genes with two machine learning algorithms. A 15-gene risk signature was constructed from the DEGs that were shared between the algorithms. Risk scores were calculated using the regression coefficients for the pGGO-related DEGs. Patients with Stage I/II LUAD or Stage IA LUAD and high-risk scores had a worse prognosis than patients with low-risk scores. The prognosis of high-risk patients with Stage IA LUAD was almost identical to that of patients with Stage II LUAD, suggesting that treatment strategies for patients with Stage II LUAD may be beneficial in high-risk patients with Stage IA LUAD. pGGO-related DEGs were mainly enriched in immune-related pathways. Patients with high-risk scores and high tumor mutation burden had a worse prognosis and may benefit from immunotherapy. A nomogram was constructed to facilitate the clinical application of the 15-gene risk signature. Receiver operating characteristic curves and decision curve analysis validated the predictive ability of the nomogram in patients with Stage I LUAD in the TCGA-LUAD cohort and GEO datasets.

Keywords: GEO; GGO (ground-glass opacity); LUAD; TCGA; prognosis.


Conflict of interest statement

The authors declare that the research was conducted in the absence of any commercial or financial relationships that could be construed as a potential conflict of interest.

Figures

Figure 1
Figure 1
Identification of DEGs between pGGO and adjacent normal tissue and NMF clustering. (A) Heatmap of the DEGs (|log FC|> 1, FDR P < 0.05); (B) Volcano map of the DEGs (|log FC|> 1, FDR P < 0.05); (C) KEGG pathway enrichment analysis of the DEGs; (D, E) NMF clustering of patients with Stage I–II LUAD in the TCGA-LUAD cohort (D shows the NMF rank survey and E shows a heatmap of the consensus matrix; the best cluster number was chosen as the coexistence correlation coefficient K value = 2); (F, G) Kaplan–Meier survival curves for the NMF subgroups (F shows OS and G shows PFS). DEGs, differentially expressed genes; GGO, ground-glass opacity; KEGG: Kyoto Encyclopedia of Genes and Genomes; NMF, non-negative matrix factorization; LUAD, lung adenocarcinoma; PFS, progression-free survival; OS, overall survival.
Figure 2
Figure 2
Identification of pGGO-related DEGs between Cluster 1 and Cluster 2 (A) Heatmap of the pGGO-related DEGs (|log FC|> 1, FDR P < 0.05); (B, C) KEGG (B) and GO (C) enrichment pathways analysis of the pGGO-related DEGs; (D) HLA gene expression data for Cluster 1 and Cluster 2; (E) Sankey diagram showing the relationship between the cluster subtype and six immune subtypes defined in a previous study; (F–M) Violin plots showing the expression of the immune cells in Cluster 1 and Cluster 2; (N–P) Selection of prognostic pGGO-DEGs in Cluster 1 and Cluster 2 using Lasso cox regression (N, O) and SVM-RFE (threshold value = 19) (P). DEGs, differentially expressed genes; GGO, ground-glass opacity; KEGG, Kyoto Encyclopedia of Genes and Genomes; GO: Gene Ontology; NMF, non-negative matrix factorization; SVM-RFE: support vector machine—recursive feature elimination. ns represent non significant, * represent P≤ 0.05.
Figure 3
Figure 3
The construction and verification of the risk signature. (A) Venn analysis was used to identify 15 DEGs that were shared between the machine learning algorithms (Lasso cox regression and SVM-RFE); (B) Expression data of the 15 prognostic pGGO-related DEGs; (C) Forest plot of the 15 prognostic pGGO-related DEGs (red: risk factors; blue: protective factors); (D–I) Kaplan–Meier survival curves. The TCGA-LUAD cohort was stratified into a high-risk group and low-risk group. Patients in the high-risk group had a worse prognosis than the patients in the low-risk group in the overall TCGA-LUAD cohort (D) and patients with Stage IA LUAD (E). There was no significant difference in OS between patients with Stage IA LUAD and high-risk scores and patients with Stage II LUAD (F). Patients with LUAD from the GSE50081 and GSE72094 datasets were stratified into a high-risk group and low-risk group. Patients in the high-risk group had a worse prognosis than the patients in the low-risk group in the overall GEO-LUAD dataset (G) and patients with Stage IA LUAD (H). There was no significant difference in OS between patients with Stage IA LUAD and high-risk scores and patients with Stage II LUAD (I). (J–L) R Time-dependent ROC curve analysis at 1 (J), 3 (K), and 5 years (L) verified the predictive performance of the 15-gene risk signature in the TCGA-LUAD cohort. (M–O) DCA at 1 (M), 3 (N), and 5 years (O) verified the predictive performance of the 15-gene risk signature in the TCGA-LUAD cohort. DEGs, differentially expressed genes; GGO, ground-glass opacity; ROC, receiver operating characteristic; LUAD, lung adenocarcinoma; SVM-RFE, support vector machine—recursive feature elimination; DCA, decision curve analysis.
Figure 4
Figure 4
Clinical application of the 15-gene risk signature. (A) Heatmap showing that the TNM stage, immune scores, NMF subgroup, gender, T stage, and N stage were significantly associated with risk scores, and the expression levels of the 15 DEGs were different between the high- and low-risk groups. (B) Violin plots showing the relationship between the risk score and TNM stage. (C–E) Heatmap of the mRNA expression of the risk signature (C) and risk curves in the TCGA-LUAD cohort (D, E). (F, G), Univariate (F) and multivariate (G) Cox regression analyses suggested that the 15-gene risk signature was the independent prognostic factor in the TCGA-LUAD cohort. ROC, receiver operating characteristic curve; LUAD, lung adenocarcinoma; DCA, decision curve analysis. * represent P≤ 0.05, ** represent P≤ 0.01, *** represent P≤ 0.001, and **** represent P≤ 0.0001.
Figure 5
Figure 5
Construction and verification of the nomogram. (A) The nomogram was constructed using the TNM stage, risk signature, T stage, N stage, and gender. (B, C) Calibration curves verifying the performance of the nomogram at 1, 3, and 5 years in the TCGA-LUAD cohort (B) and GEO datasets (C). (D–F) ROC curve analysis verifying the performance of the nomogram at 1 (D), 3 (E), and 5 years (F) in patients with Stage I LUAD in the TCGA cohort. (D–F) DCA verifying the performance of the nomogram at 1 (G), 3 (H), and 5 years (I) in patients with Stage I LUAD in the TCGA cohort; (J–L) ROC curve analysis verifying the performance of the nomogram at 1 (J), 3 (K), and 5years (L) in patients with Stage I LUAD in the GEO datasets. (M–O) DCA verifying the performance of the nomogram at 1 (M), 3 (N), and 5 years (O) in patients with Stage I LUAD in the GEO datasets. ROC, receiver operating characteristic curve; LUAD, lung adenocarcinoma; DCA, decision curve analysis. * represent P≤ 0.05, ** represent P≤ 0.01, *** represent P≤ 0.001, and **** represent P≤ 0.0001.
Figure 6
Figure 6
Relationship between the 15-gene risk signature, TMB, and the IPS (A, B) GSEA for patients in the high- and low-risk groups; (C) TMB in patients in the high- and low-risk groups; (D) Kaplan–Meier survival curves showed no significant difference in OS between patients in the high-TMB group and low-TMB group; (E) Kaplan–Meier survival curves combining the risk score and TMB; (F) Relationship between the 15-gene risk signature, TMB, and immune cells; (G), Relationship between the 15-gene risk signature and the IPS. ROC, receiver operating characteristic; LUAD, lung adenocarcinoma; IPS, immunophenoscore; TMB, tumor mutation burden; OS, overall survival.

Similar articles

Cited by

References

    1. Gao J-W, Rizzo S, Ma LH, Qiu XY, Warth A, Seki N, et al. . Pulmonary Ground-Glass Opacity: Computed Tomography Features, Histopathology and Molecular Pathology. Trans Lung Cancer Res (2017) 6(1):68–75. doi: 10.21037/tlcr.2017.01.02 - DOI - PMC - PubMed
    1. Zhang Y, Fu F, Chen H. Management of Ground-Glass Opacities in the Lung Cancer Spectrum. Ann Thorac Surg (2020) 110:1796–804. doi: 10.1016/j.athoracsur.2020.04.094 - DOI - PubMed
    1. Kobayashi Y, Mitsudomi T. Management of Ground-Glass Opacities: Should All Pulmonary Lesions With Ground-Glass Opacity Be Surgically Resected? Trans Lung Cancer Res (2013) 2:354. doi: 10.3978/j.issn.2218-6751.2013.09.03 - DOI - PMC - PubMed
    1. Hattori A, Hirayama S, Matsunaga T, Hayashi T, Takamochi K, Oh S, et al. . Distinct Clinicopathologic Characteristics and Prognosis Based on the Presence of Ground Glass Opacity Component in Clinical Stage IA Lung Adenocarcinoma. J Thorac Oncol (2019) 14(2):265–75. doi: 10.1016/j.jtho.2018.09.026 - DOI - PubMed
    1. Fu F, et al. . Distinct Prognostic Factors in Patients With Stage I Non–small Cell Lung Cancer With Radiologic Part-Solid or Solid Lesions. J Thorac Oncol (2019) 14:2133–42. doi: 10.1016/j.jtho.2019.08.002 - DOI - PubMed

Publication types

MeSH terms