

Estimating unconfirmed COVID-19 infection cases and multiple waves of pandemic progression with consideration of testing capacity and non-pharmaceutical interventions: A dynamic spreading model
- PMID: 35693835
- PMCID: PMC9169449
- DOI: 10.1016/j.ins.2022.05.093
Estimating unconfirmed COVID-19 infection cases and multiple waves of pandemic progression with consideration of testing capacity and non-pharmaceutical interventions: A dynamic spreading model
Abstract
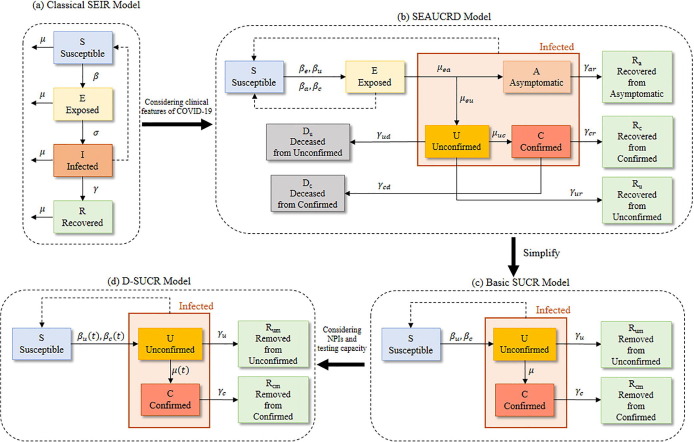
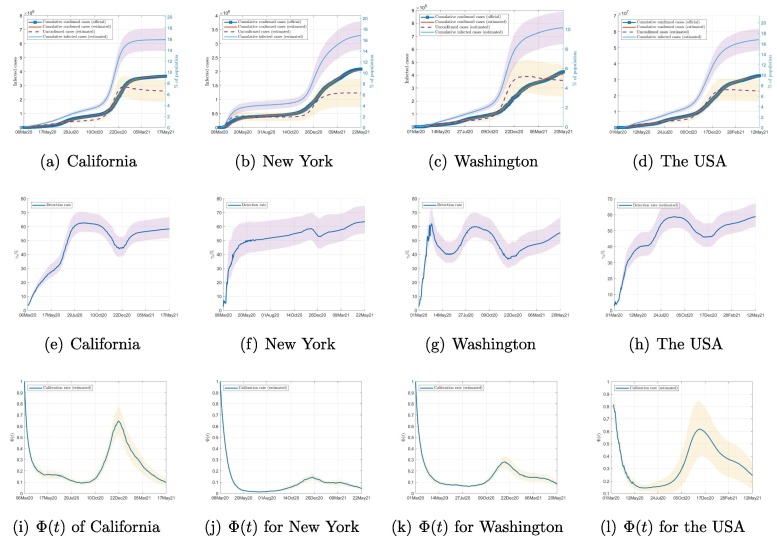
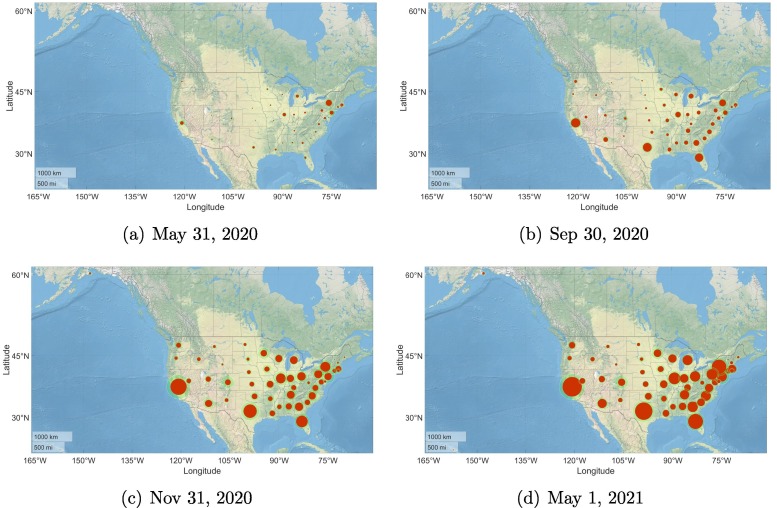
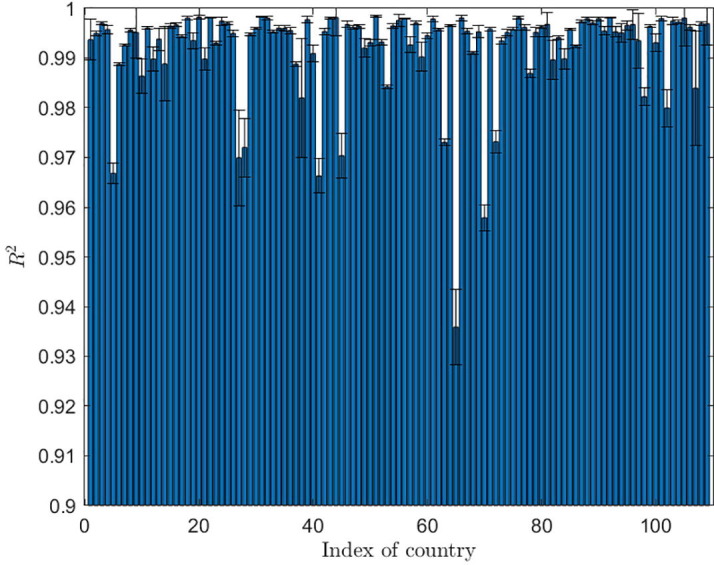
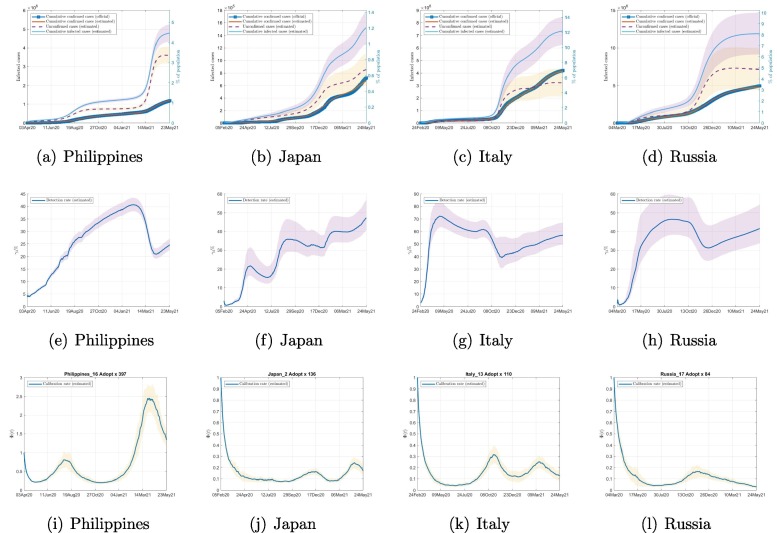
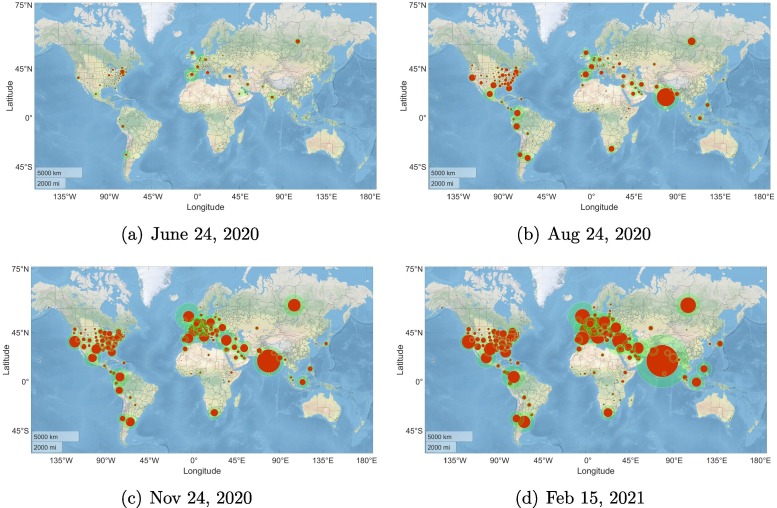
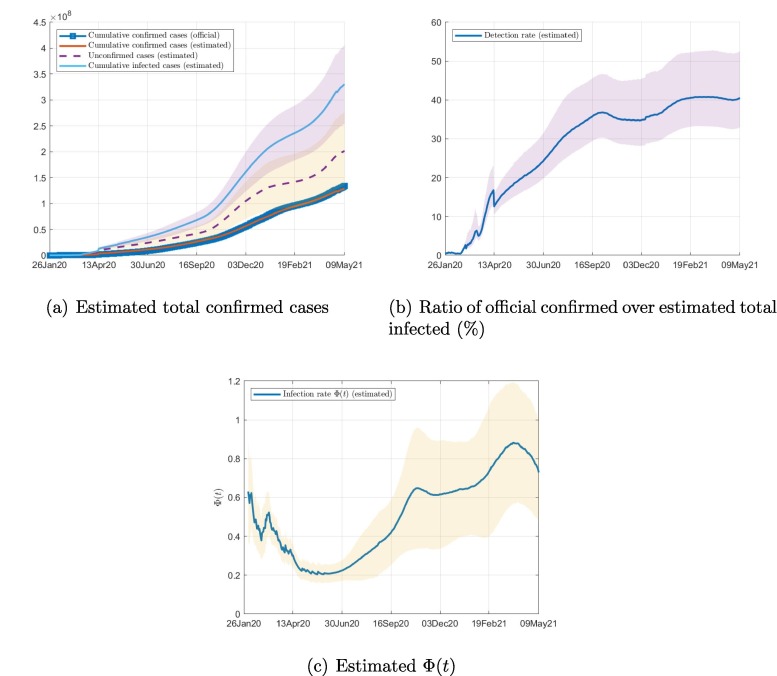
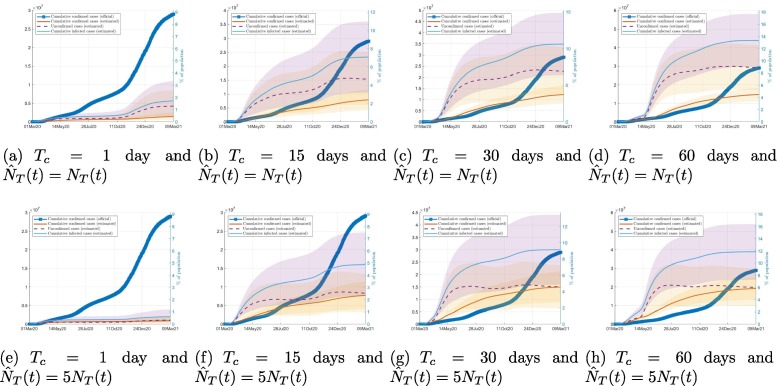
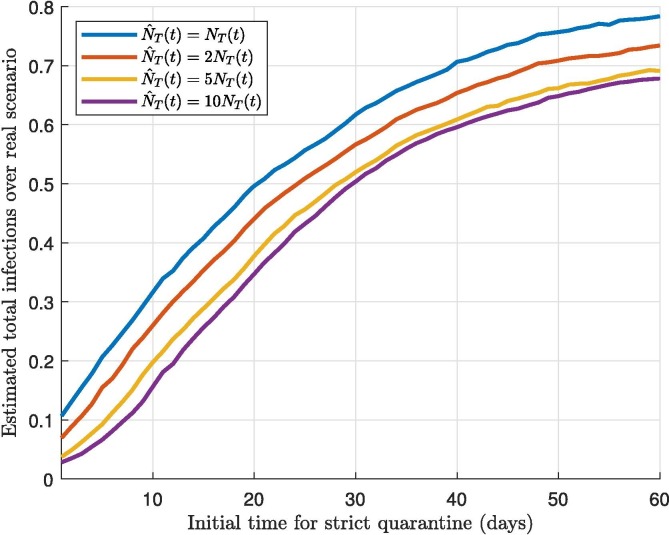
The novel coronavirus disease 2019 (COVID-19), caused by severe acute respiratory syndrome coronavirus 2 (SARS-CoV-2), has unique epidemiological characteristics that include presymptomatic and asymptomatic infections, resulting in a large proportion of infected cases being unconfirmed, including patients with clinical symptoms who have not been identified by screening. These unconfirmed infected individuals move and spread the virus freely, presenting difficult challenges to the control of the pandemic. To reveal the actual pandemic situation in a given region, a simple dynamic susceptible-unconfirmed-confirmed-removed (D-SUCR) model is developed taking into account the influence of unconfirmed cases, the testing capacity, the multiple waves of the pandemic, and the use of non-pharmaceutical interventions. Using this model, the total numbers of infected cases in 51 regions of the USA and 116 countries worldwide are estimated, and the results indicate that only about 40% of the true number of infections have been confirmed. In addition, it is found that if local authorities could enhance their testing capacities and implement a timely strict quarantine strategy after identifying the first infection case, the total number of infected cases could be reduced by more than 90%. Delay in implementing quarantine measures would drastically reduce their effectiveness.
Keywords: COVID-19; Extended SEIR models; Infection estimation; Spreading dynamics; Testing capacity.
© 2022 Elsevier Inc. All rights reserved.
Conflict of interest statement
The authors declare that they have no known competing financial interests or personal relationships that could have appeared to influence the work reported in this paper.
Figures
Similar articles
-
An investigation of testing capacity for evaluating and modeling the spread of coronavirus disease.Inf Sci (N Y). 2021 Jun;561:211-229. doi: 10.1016/j.ins.2021.01.084. Epub 2021 Feb 16. Inf Sci (N Y). 2021. PMID: 33612854 Free PMC article.
-
Effectiveness and cost-effectiveness of four different strategies for SARS-CoV-2 surveillance in the general population (CoV-Surv Study): a structured summary of a study protocol for a cluster-randomised, two-factorial controlled trial.Trials. 2021 Jan 8;22(1):39. doi: 10.1186/s13063-020-04982-z. Trials. 2021. PMID: 33419461 Free PMC article.
-
How many asymptomatic cases were unconfirmed in the US COVID-19 pandemic? The evidence from a serological survey.Chaos Solitons Fractals. 2022 Nov;164:112630. doi: 10.1016/j.chaos.2022.112630. Epub 2022 Sep 6. Chaos Solitons Fractals. 2022. PMID: 36091638 Free PMC article.
-
Coronavirus disease 2019 (COVID-19) pandemic and pregnancy.Am J Obstet Gynecol. 2020 Jun;222(6):521-531. doi: 10.1016/j.ajog.2020.03.021. Epub 2020 Mar 23. Am J Obstet Gynecol. 2020. PMID: 32217113 Free PMC article. Review.
-
COVID-19 on the Nile: Review on the Management and Outcomes of the COVID-19 Pandemic in the Arab Republic of Egypt from February to August 2020.Int J Environ Res Public Health. 2021 Feb 8;18(4):1588. doi: 10.3390/ijerph18041588. Int J Environ Res Public Health. 2021. PMID: 33567519 Free PMC article. Review.
Cited by
-
Uncovering COVID-19 transmission tree: identifying traced and untraced infections in an infection network.Front Public Health. 2024 Jun 3;12:1362823. doi: 10.3389/fpubh.2024.1362823. eCollection 2024. Front Public Health. 2024. PMID: 38887240 Free PMC article.
-
Modeling the spread dynamics of multiple-variant coronavirus disease under public health interventions: A general framework.Inf Sci (N Y). 2023 May;628:469-487. doi: 10.1016/j.ins.2023.02.001. Epub 2023 Feb 6. Inf Sci (N Y). 2023. PMID: 36777698 Free PMC article.
-
Seroprevalence as an Indicator of Undercounting of COVID-19 Cases in a Large Well-Described Cohort.AJPM Focus. 2023 Aug 15;2(4):100141. doi: 10.1016/j.focus.2023.100141. eCollection 2023 Dec. AJPM Focus. 2023. PMID: 37885754 Free PMC article.
-
HRL4EC: Hierarchical reinforcement learning for multi-mode epidemic control.Inf Sci (N Y). 2023 Sep;640:119065. doi: 10.1016/j.ins.2023.119065. Epub 2023 May 9. Inf Sci (N Y). 2023. PMID: 37193062 Free PMC article.
References
-
- Aiano F., Mensah A.A., McOwat K., Obi C., Vusirikala A., Powell A.A., Flood J., Bosowski J., Letley L., Jones S., et al. COVID-19 outbreaks following full reopening of primary and secondary schools in England: cross-sectional national surveillance, November 2020. The Lancet Regional Health-Europe. 2021;6 - PMC - PubMed
-
- Carrat F., Vergu E., Ferguson N.M., Lemaitre M., Cauchemez S., Leach S., Valleron A.-J. Time lines of infection and disease in human influenza: a review of volunteer challenge studies. Am. J. Epidemiol. 2008;167(7):775–785. - PubMed
LinkOut - more resources
Full Text Sources
Miscellaneous