. 2022 May 25:13:884404.
doi: 10.3389/fphys.2022.884404. eCollection 2022.

Effect of Darkness on Intrinsic Motivation for Undirected Singing in Bengalese Finch (Lonchura striata Domestica): A Comparative Study With Zebra Finch (Taeniopygia guttata)

Affiliations

Effect of Darkness on Intrinsic Motivation for Undirected Singing in Bengalese Finch (Lonchura striata Domestica): A Comparative Study With Zebra Finch (Taeniopygia guttata)

Yunbok Kim et al. Front Physiol. .

Abstract

The zebra finch (ZF) and the Bengalese finch (BF) are animal models that have been commonly used for neurobiological studies on vocal learning. Although they largely share the brain structure for vocal learning and production, BFs produce more complex and variable songs than ZFs, providing a great opportunity for comparative studies to understand how animals learn and control complex motor behaviors. Here, we performed a comparative study between the two species by focusing on intrinsic motivation for non-courtship singing ("undirected singing"), which is critical for the development and maintenance of song structure. A previous study has demonstrated that ZFs dramatically increase intrinsic motivation for undirected singing when singing is temporarily suppressed by a dark environment. We found that the same procedure in BFs induced the enhancement of intrinsic singing motivation to much smaller degrees than that in ZFs. Moreover, unlike ZFs that rarely sing in dark conditions, substantial portion of BFs exhibited frequent singing in darkness, implying that such "dark singing" may attenuate the enhancement of intrinsic singing motivation during dark periods. In addition, measurements of blood corticosterone levels in dark and light conditions provided evidence that although BFs have lower stress levels than ZFs in dark conditions, such lower stress levels in BFs are not the major factor responsible for their frequent dark singing. Our findings highlight behavioral and physiological differences in spontaneous singing behaviors of BFs and ZFs and provide new insights into the interactions between singing motivation, ambient light, and environmental stress.

Keywords: Bengalese finch; birdsong; darkness; motivation; stress; vocal learning; voluntary behavior; zebra finch.


Conflict of interest statement

The authors declare that the research was conducted in the absence of any commercial or financial relationships that could be construed as a potential conflict of interest.

Figures
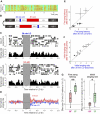
FIGURE 1
FIGURE 1
Effects of short (30 min) and long (5 h) lights-out (LO) on undirected singing in BFs and their comparison with those in ZFs. (A) Spectrogram showing one bout of undirected song in a representative BF. (B) Daily schedule of 30 min and 5 h LO periods. After a 2 h light period (white area) in the morning, a 30 min LO (blue area) and a 5 h LO (red area) were given with a 2.5 h intervening light period, followed by a 4 h light period. The order of the 30 min and 5 h LO was switched every 1–3 days. Each row indicates the schedule on one day. (C) Raster plot of song bouts produced before and after a 30 min LO (top) and 5 h LO (bottom) and corresponding singing rate histograms (bin size is 2 min) in a representative bird. (D) Time course of instantaneous singing rate before and after a 30 min (blue) and 5 h LO (red), normalized to the mean singing rate before LO (mean ± SEM, n = 9 birds). (E) The first song latencies (mean ± SEM) after a 5 h LO plotted against those after a 30 min LO (n = 9 birds). Filled circles indicate birds with statistical significance between a 5 h and 30 min LO data (p < 0.05). The dashed lines indicate unity. (F) Initial singing rates after a 5 h LO plotted against those after a 30 min LO (n = 9 birds). Conventions are as in E. (G) The effect sizes [Hedges’ g for the first song latency (left) and the initial singing rate (right) between a 30 min and 5 h LO in BFs and ZFs. *p < 0.05; **p < 0.01].
FIGURE 2
FIGURE 2
Effects of LO with 4 different durations (30 min, 2, 5, and 10 h) on singing motivation in BFs and their comparison with those in ZFs. (A) Daily schedule of LO periods (red areas) with four different durations. On each day, a single LO period with one of the four different durations was given with the offset at 2 h before night; the onset was varied depending on the LO duration. Birds received LO periods with four different durations in a randomized order. (B) First song latencies plotted against LO durations in BFs (n = 8 birds). Gray lines indicate data for individual birds and red lines represent mean ± SEM across all birds. (C) Initial singing rates plotted against LO duration in BFs (n = 8 birds). Conventions are same as in B. (D) The effect sizes for the first song latency (left) and the initial singing rate (right) between a 30 min and 10 h LO in BFs and ZFs *p < 0.05.
FIGURE 3
FIGURE 3
Comparison of BF and ZF singing behavior during LO periods. (A) Mean singing rates during 30 min and 5 h LO periods in BFs and ZFs (n = 9 BFs and 7 ZFs). (B) Percentage of BFs and ZFs that sung during 5 h LO periods. (C) Raster plots of song bouts produced during a 5 h LO in 2 representative BFs. (D) For all BFs examined, the effect sizes of first song latency (left) and initial singing rate (right) between the 30 min and 5 h LO are plotted against mean singing rate during 5 h LO periods. (E) Mean singing rates during LO periods with four different durations in BFs and ZFs (n = 8 BFs and 10 ZFs). (F) Percentage of BFs and ZFs that sung during 10 h LO periods. (G) Raster plots of song bouts produced during a 10 h LO period in two representative BFs. (H) Effect sizes of first song latency (left) and initial singing rate (right) between a 30 min and 10 h LO, plotted against mean singing rate during a 10 h LO.
FIGURE 4
FIGURE 4
Comparison of blood CORT levels in dark and light conditions between BFs and ZFs. (A) Daily schedules of blood sampling with and without LO. (B) Blood CORT levels in BFs and ZFs under dark (left) and light (right) conditions. BFs showed significantly lower CORT levels than ZFs in both conditions (**p < 0.01). (C) Dark/light ratios in CORT levels were not significantly different from 1 either in BFs (p = 0.73) or in ZFs (p = 0.32). No significant difference was found between BFs and ZFs (p = 0.28).

References

    1. Andalman A. S., Fee M. S. (2009). A Basal Ganglia-Forebrain Circuit in the Songbird Biases Motor Output to Avoid Vocal Errors. Proc. Natl. Acad. Sci. U.S.A. 106, 12518–12523. 10.1073/pnas.0903214106 - DOI - PMC - PubMed
    1. Brainard M. S., Doupe A. J. (2001). Postlearning Consolidation of Birdsong: Stabilizing Effects of Age and Anterior Forebrain Lesions. J. Neurosci. 21, 2501–2517. 10.1523/jneurosci.21-07-02501.2001 - DOI - PMC - PubMed
    1. Charlesworth J. D., Warren T. L., Brainard M. S. (2012). Covert Skill Learning in a Cortical-Basal Ganglia Circuit. Nature 486, 251–255. 10.1038/nature11078 - DOI - PMC - PubMed
    1. Clinchy M., Zanette L., Boonstra R., Wingfield J. C., Smith J. N. M. (2004). Balancing Food and Predator Pressure Induces Chronic Stress in Songbirds. Proc. R. Soc. Lond. B 271, 2473–2479. 10.1098/rspb.2004.2913 - DOI - PMC - PubMed
    1. Derégnaucourt S., Mitra P. P., Fehér O., Pytte C., Tchernichovski O. (2005). How Sleep Affects the Developmental Learning of Bird Song. Nature 433, 710–716. 10.1038/nature03275 - DOI - PubMed