Elevated IP-10 at the Protein and Gene Level Associates With Pulmonary TB
- PMID: 35694534
- PMCID: PMC9184682
- DOI: 10.3389/fcimb.2022.908144
Elevated IP-10 at the Protein and Gene Level Associates With Pulmonary TB
Abstract
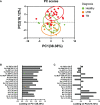
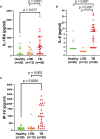
There is an urgent need for accurate and sensitive diagnostic tools that can overcome the current challenge to distinguish individuals with latent tuberculosis infection (LTBI) from individuals with active tuberculosis (TB). Recent literature has suggested that a group of cytokines may serve as biomarkers of TB disease progression. Using a multiplex ELISA, we quantified 27 circulatory markers present within the unstimulated plasma of individuals in Durban, South Africa who were healthy (n=20), LTBI (n=13), or had active TB (n=30). RT-qPCR was performed to measure gene expression of the cytokines of interest, using RNA isolated from healthy (n=20), LTBI (n=20), or active TB (n=30). We found that at the protein level, IL-1RA, IL-6, and IP-10 were significantly more abundant in participants with active TB (p< 0.05) compared to those with LTBI individuals. IP-10 also showed the strongest association with active TB compared to healthy and LTBI at mRNA level. Our data shows that these proteins may serve as biomarkers of TB at both the protein and gene level.
Keywords: IL-1RA; IP-10; TB diagnosis; biomarkers; disease progression; latent TB; tuberculosis.
Copyright © 2022 Fisher, Moodley, Rajkumar-Bhugeloo, Baiyegunhi, Karim, Ndlovu, Ndung’u and Marakalala.
Conflict of interest statement
The authors declare that the research was conducted in the absence of any commercial or financial relationships that could be construed as a potential conflict of interest.
Figures


Similar articles
-
Biomarkers for discrimination between latent tuberculosis infection and active tuberculosis disease.J Infect. 2017 Mar;74(3):281-293. doi: 10.1016/j.jinf.2016.11.010. Epub 2016 Nov 19. J Infect. 2017. PMID: 27871809
-
IP-10 differentiates between active and latent tuberculosis irrespective of HIV status and declines during therapy.J Infect. 2015 Apr;70(4):381-91. doi: 10.1016/j.jinf.2014.12.019. Epub 2015 Jan 15. J Infect. 2015. PMID: 25597826
-
Multiplex analysis of plasma cytokines/chemokines showing different immune responses in active TB patients, latent TB infection and healthy participants.Tuberculosis (Edinb). 2017 Dec;107:88-94. doi: 10.1016/j.tube.2017.07.013. Epub 2017 Aug 3. Tuberculosis (Edinb). 2017. PMID: 29050777
-
Gaps in Study Design for Immune Parameter Research for Latent Tuberculosis Infection: A Systematic Review.J Immunol Res. 2020 Apr 21;2020:8074183. doi: 10.1155/2020/8074183. eCollection 2020. J Immunol Res. 2020. PMID: 32377537 Free PMC article.
-
Mycobacterium tuberculosis-specific cytokine biomarkers to differentiate active TB and LTBI: A systematic review.J Infect. 2020 Dec;81(6):873-881. doi: 10.1016/j.jinf.2020.09.032. Epub 2020 Sep 29. J Infect. 2020. PMID: 33007340
Cited by
-
Therapeutic Drug Monitoring and Biomarkers; towards Better Dosing of Antimicrobial Therapy.Pharmaceutics. 2024 May 17;16(5):677. doi: 10.3390/pharmaceutics16050677. Pharmaceutics. 2024. PMID: 38794338 Free PMC article.
-
Immune dysregulation in endometrial tuberculosis: elevated HLA-G and IL-1Ra as key modulators.Front Cell Infect Microbiol. 2025 May 1;15:1548238. doi: 10.3389/fcimb.2025.1548238. eCollection 2025. Front Cell Infect Microbiol. 2025. PMID: 40375897 Free PMC article.
-
Immune-endocrine network in diabetes-tuberculosis nexus: does latent tuberculosis infection confer protection against meta-inflammation and insulin resistance?Front Endocrinol (Lausanne). 2024 Jan 24;15:1303338. doi: 10.3389/fendo.2024.1303338. eCollection 2024. Front Endocrinol (Lausanne). 2024. PMID: 38327565 Free PMC article. Review.
-
Combined analysis of host IFN-γ, IL-2 and IP-10 as potential LTBI biomarkers in ESAT-6/CFP-10 stimulated blood.Front Mol Med. 2024 Jan 26;4:1345510. doi: 10.3389/fmmed.2024.1345510. eCollection 2024. Front Mol Med. 2024. PMID: 39086434 Free PMC article.
-
Performance of T-Track® TB, a Novel Dual Marker RT-qPCR-Based Whole-Blood Test for Improved Detection of Active Tuberculosis.Diagnostics (Basel). 2023 Feb 16;13(4):758. doi: 10.3390/diagnostics13040758. Diagnostics (Basel). 2023. PMID: 36832246 Free PMC article.
References
-
- Azzurri A., Sow O. Y., Amedei A., Bah B., Diallo S., Peri G., et al. . (2005). IFN-Gamma-Inducible Protein 10 and Pentraxin 3 Plasma Levels Are Tools for Monitoring Inflammation and Disease Activity in Mycobacterium Tuberculosis Infection. Microbes Infect. 7 (1), 1–8. doi: 10.1016/j.micinf.2004.09.004 - DOI - PubMed
-
- Borgström E., Andersen P., Atterfelt F., Julander I., Källenius G., Maeurer M., et al. . (2012). Immune Responses to ESAT-6 and CFP-10 by FASCIA and Multiplex Technology for Diagnosis of M. Tuberculosis Infection; IP-10 Is a Promising Marker. PloS One 7 (11), e43438. doi: 10.1371/journal.pone.0043438 - DOI - PMC - PubMed
Publication types
MeSH terms
Substances
Grants and funding
LinkOut - more resources
Full Text Sources
Medical

