. 2022 May 27:12:870785.
doi: 10.3389/fcimb.2022.870785. eCollection 2022.

The Microbiota and It's Correlation With Metabolites in the Gut of Mice With Nonalcoholic Fatty Liver Disease

Affiliations

The Microbiota and It's Correlation With Metabolites in the Gut of Mice With Nonalcoholic Fatty Liver Disease

Congwei Gu et al. Front Cell Infect Microbiol. .

Erratum in

Abstract

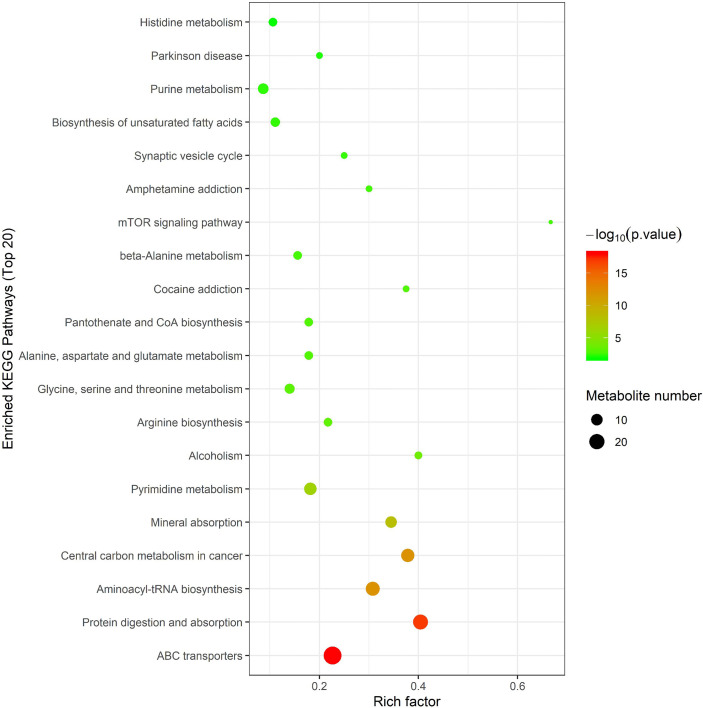
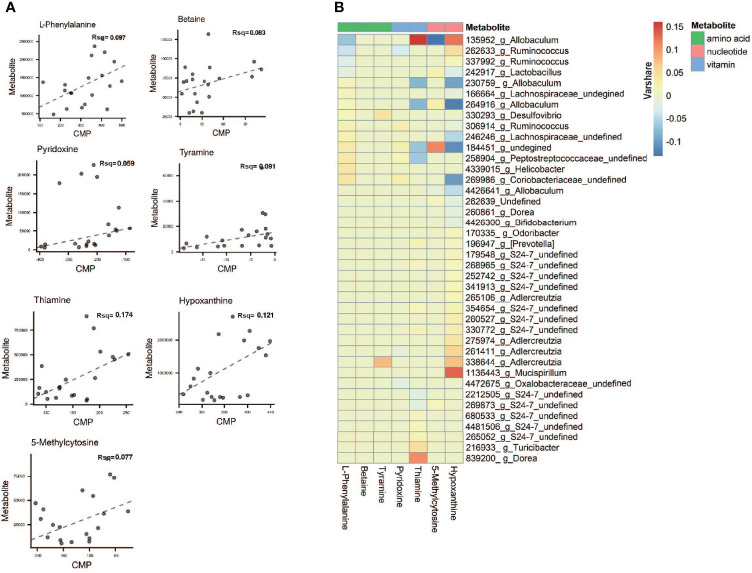
In recent years, nonalcoholic fatty liver disease (NAFLD) has become the most common liver disease in the world. As an important model animal, the characteristics of gut microbiota alteration in mice with NAFLD have been studied but the changes in metabolite abundance in NAFLD mice and how the gut microbiota affects these intestinal metabolites remain unclear. In this experiment, a mouse model for NAFLD was established by a high-fat diet. The use of 16S rDNA technology showed that while there were no significant changes in the alpha diversity in the cecum of NAFLD mice, the beta diversity changed significantly. The abundance of Blautia, Unidentified-Lachnospiraceae, Romboutsia, Faecalibaculum, and Ileibacterium increased significantly in NAFLD mice, while Allobaculum and Enterorhabdus decreased significantly. Amino acids, lipids, bile acids and nucleotide metabolites were among the 167 significantly different metabolites selected. The metabolic pathways of amino acids, SFAs, and bile acids were significantly enhanced, while the metabolic pathways of PUFAs, vitamins, and nucleotides were significantly inhibited. Through correlation and MIMOSA2 analysis, it is suggested that gut microbiota does not affect the changes of lipids and bile acids but can reduce thiamine, pyridoxine, and promote L-phenylalanine and tyramine production. The findings of this study will help us to better understand the relationship between gut microbiota and metabolites in NAFLD.

Keywords: 16SrDNA; MIMOSA2; metabonomics; mice; nonalcoholic fatty liver disease (NAFLD).


Conflict of interest statement

The authors declare that the research was conducted in the absence of any commercial or financial relationships that could be construed as a potential conflict of interest.

Figures

Figure 1
Figure 1
The body weight, fat mass, liver weight and Histopathology with CK and NAFLD mice, CK mice were fed Standard chow diet, NAFLD mice were fed HFD. (A, B) Representative pictures of CK and NAFLD mice, showing enormous discrepancy in body size. (C) Body weight changes in ND or HFD fed mice over 12 weeks. From week 7, the body weight of NAFLD group was significantly higher than CK group. (D, E) Representative pictures of perirenal fat and epididymal pad fat showing the difference of fat size between NAFLD mice and Control mice. (F) Tissue weight of perirenal fat and epididymal fat pads after 12 weeks of treatment. (G) Gross appearance of the liver. The liver of NAFLD mice was khaki yellow and that of normal mice was dark red. (H) There were no significant differences in liver index (% of body weight) between the groups. (I) Hematoxylin and eosin (H&E) staining of liver (400×), hepatocyte steatosis was obvious in NAFLD mice. (J) Through the NAS scoring system, the NAS score is 3.4, indicating moderate NAFLD. “**” indicated p-value < 0.01 (students t-test).
Figure 2
Figure 2
Serum lipid and liver function in Control and NAFLD mice. (A-F) Total cholesterol (TC), triglycerides (TG), high density lipoprotein (HDL), low density lipoprotein (LDL), aspartate aminotransferase-AST (E) and alanine aminotransferase (ALT) were significantly elevated in NAFLD mice. “*” indicated p-value < 0.05, “**” indicated p-value < 0.01 (Students t-test).
Figure 3
Figure 3
Alpha and beta diversity analysis of the bacterial community in the cecal contents of Control and NAFLD mice. (A-D) ACE, Chao1, Shannon, Simpson indexes had no significant difference between Control and NAFLD mice. (E, F) Beta diversity assessed by using PCoA of weighted UniFrac distance metrices had significant difference between Control and NAFLD mice. “*” indicated p-value < 0.05, (Wilcox Rank-Sum test).
Figure 4
Figure 4
The distribution and composition of the bacterial community at each classification level. (A-D) Cecal bacterial profiles at the Phylum, Class, Family and Genus levels displaying relative abundance of the partial cecal microbiota. (E) Functional biomarkers found by linear discriminant analysis effect size (LEfSe); (F) Functional cladogram obtained from LEfSe. “*” indicated p-value < 0.05, “**” indicated p-value < 0.01 (Wilcox Rank-Sum test).
Figure 5
Figure 5
Metabolic pathway analysis using MetaboAnalyst 4.0 (http://www.metaboanalyst.ca). x-axis: Rich factor, y-axis: metabolic pathway. Circle color represents -log10(p-value) and the size of the circle represent the number of metabolites enriched in metabolic pathway.
Figure 6
Figure 6
Spearman correlations between significant bacteria based on LEfSe and differential amino acids and their derivatives are presented in the form of a correlation coefficient matrix heat map. The correlation coefficient r is shown in color. r >0, positive correlation, shown in red; r < 0 represents a negative correlation, shown in blue, and the darker the color, the stronger the correlation. “*” indicated p-value < 0.05, “**” indicated p-value < 0.01.
Figure 7
Figure 7
Spearman correlations between significant bacteria based on LEfSe and differential lipid are presented in the form of a correlation coefficient matrix heat map. The correlation coefficient r is shown in color. r >0, positive correlation, shown in red; r < 0 represents a negative correlation, shown in blue, and the darker the color, the stronger the correlation. “*” indicated p-value < 0.05, “**” indicated p-value < 0.01.
Figure 8
Figure 8
Spearman correlations between significant bacteria based on LEfSe and differential nucleotide (A), bile acid (B), vitamin (C) are presented in the form of a correlation coefficient matrix heat map. The correlation coefficient r is shown in color. r >0, positive correlation, shown in red; r < 0 represents a negative correlation, shown in blue, and the darker the color, the stronger the correlation. “*” indicated p-value < 0.05, “**” indicated p-value < 0.01.
Figure 9
Figure 9
Microbial contribution to metabolite variance based on MIMOSA2. (A) Comprison plots showed the overall relationship between community-level metabolic potential scores (CMP) and metabolite measurements. R-square (Rsq) of the regression model used for prediction represents the sum of the contributions of all listed taxa to the metabolite variance. Contribution results are only included for metabolites with a model p-value less than 0.1 and positive slope of model. (B) Contribution heatmap showed the major taxonomic contributors with Varshare more than 0.01 to variation for each metabolite, red represents positive contribution; blue represents negative contribution; the darker the color, the greater the contribution. “Varshare” represents the fraction of the variation in each metabolite explained by the taxon in question, according to the overall community model.
Figure 10
Figure 10
Schematic figure illustrating the relationship between gut microbiota and metabolites, and its effect on NAFLD. Red font represent up-regulated metabolites; blue font represent down-regulated metabolites. The blue line represents the pathways studied in this experiment, and the black line represents the pathways supported by the literature.

References

    1. Agus A., Clement K., Sokol H. (2021). Gut Microbiota-Derived Metabolites as Central Regulators in Metabolic Disorders. Gut 70, 1174–1182. doi: 10.1136/gutjnl-2020-323071 - DOI - PMC - PubMed
    1. Alsharairi N. A. (2021). The Role of Short-Chain Fatty Acids in Mediating Very Low-Calorie Ketogenic Diet-Infant Gut Microbiota Relationships and Its Therapeutic Potential in Obesity. Nutrients 13, 3702. doi: 10.3390/nu13113702 - DOI - PMC - PubMed
    1. Aragonès G., Colom-Pellicer M., Aguilar C., Guiu-Jurado E., Martínez S., Sabench F., et al. . (2019). Circulating Microbiota-Derived Metabolites: A “Liquid Biopsy? Int. J. Obes. 44, 875–885. doi: 10.1038/s41366-019-0430-0 - DOI - PMC - PubMed
    1. Arao Y., Kawai H., Kamimura K., Kobayashi T., Nakano O., Hayatsu M., et al. . (2020). Effect Of Methionine/Choline-Deficient Diet and High-Fat Diet-Induced Steatohepatitis on Mitochondrial Homeostasis in Mice. Biochem. Biophys. Res. Commun. 527, 365–371. doi: 10.1016/j.bbrc.2020.03.180 - DOI - PubMed
    1. Araujo T. R., Freitas I. N., Vettorazzi J. F., Batista T. M., Santos-Silva J. C., Bonfleur M. L., et al. . (2016). Benefits Of L-Alanine Or L-Arginine Supplementation Against Adiposity and Glucose Intolerance in Monosodium Glutamate-Induced Obesity. Eur. J. Nutr. 56, 2069–2080. doi: 10.1007/s00394-016-1245-6 - DOI - PubMed