

A novel immunogenomic signature to predict prognosis and reveal immune infiltration characteristics in pancreatic ductal adenocarcinoma
- PMID: 35694712
- PMCID: PMC9172649
- DOI: 10.1093/pcmedi/pbac010
A novel immunogenomic signature to predict prognosis and reveal immune infiltration characteristics in pancreatic ductal adenocarcinoma
Abstract
Background: The immune response in the tumor microenvironment (TME) plays a crucial role in cancer progression and recurrence. We aimed to develop an immune-related gene (IRG) signature to improve prognostic predictive power and reveal the immune infiltration characteristics of pancreatic ductal adenocarcinoma (PDAC).
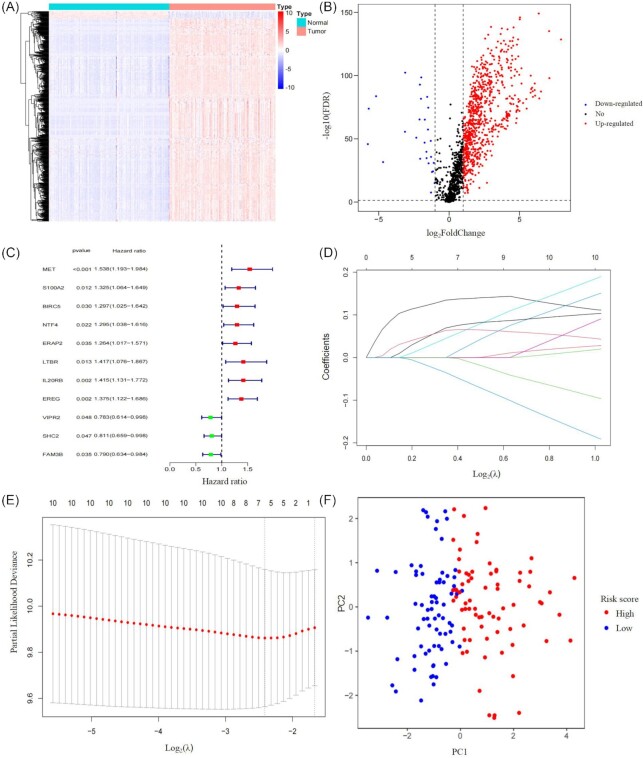
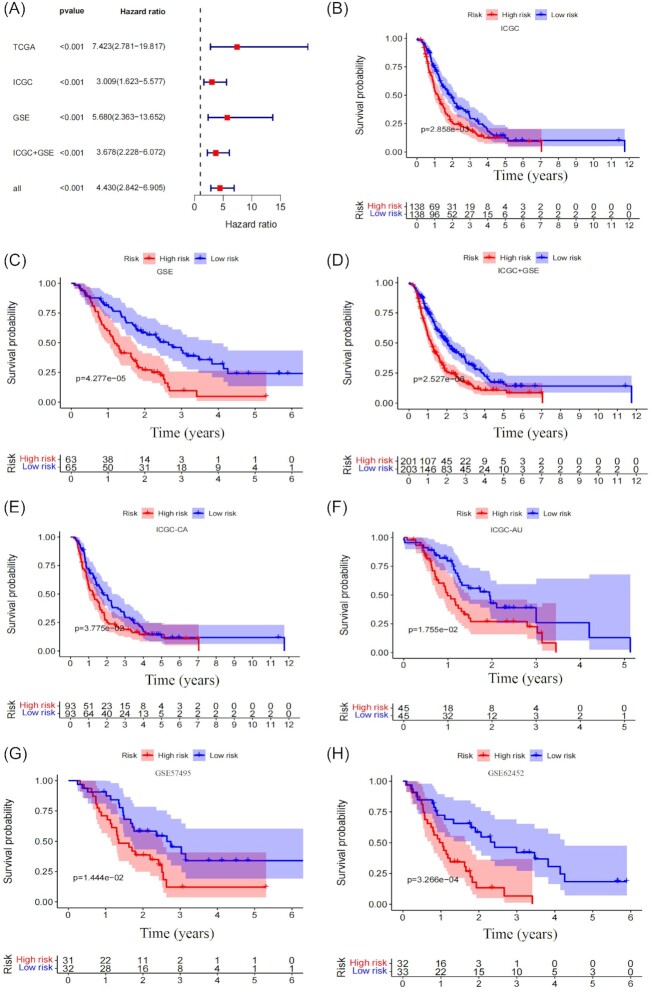
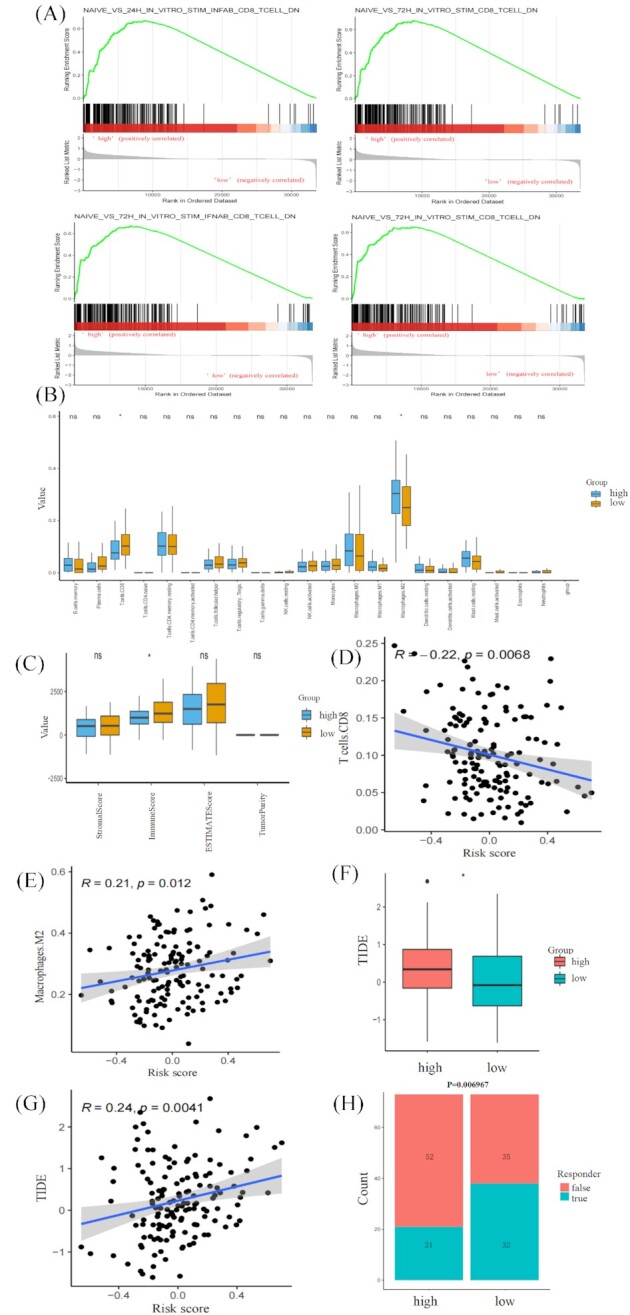
Methods: The Cancer Genome Atlas (TCGA) PDAC was used to construct a prognostic model as a training cohort. The International Cancer Genome Consortium (ICGC) and the Gene Expression Omnibus (GEO) databases were set as validation datasets. Prognostic genes were screened by using univariate Cox regression. Then, a novel optimal prognostic model was developed by using least absolute shrinkage and selection operator (LASSO) Cox regression. Cell type identification by estimating the relative subsets of RNA transcripts (CIBERSORT) and estimation of stromal and immune cells in malignant tumors using expression data (ESTIMATE) algorithms were used to characterize tumor immune infiltrating patterns. The tumor immune dysfunction and exclusion (TIDE) algorithm was used to predict immunotherapy responsiveness.
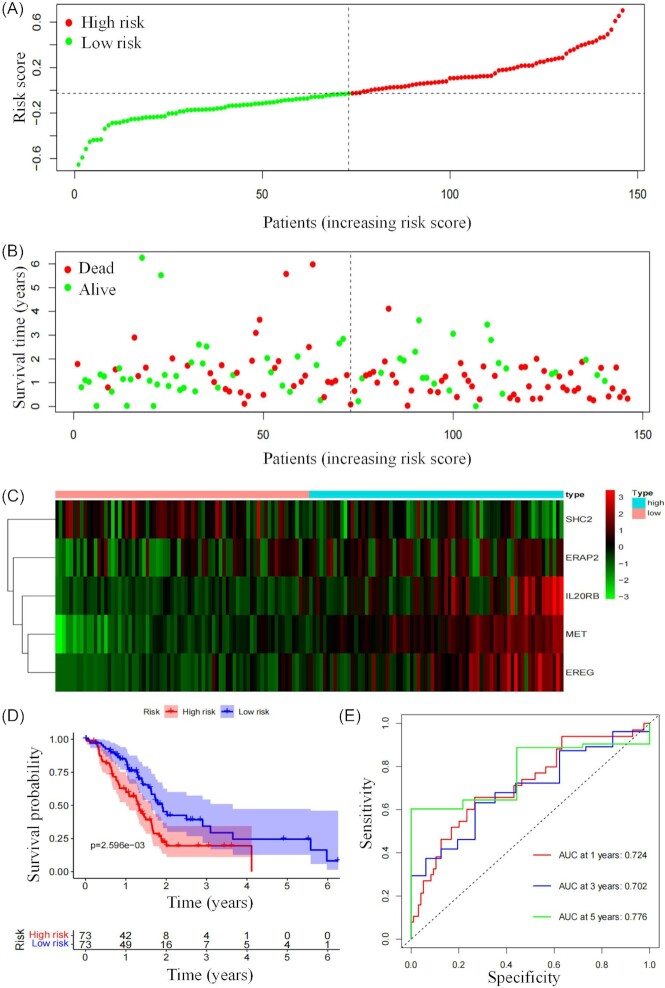
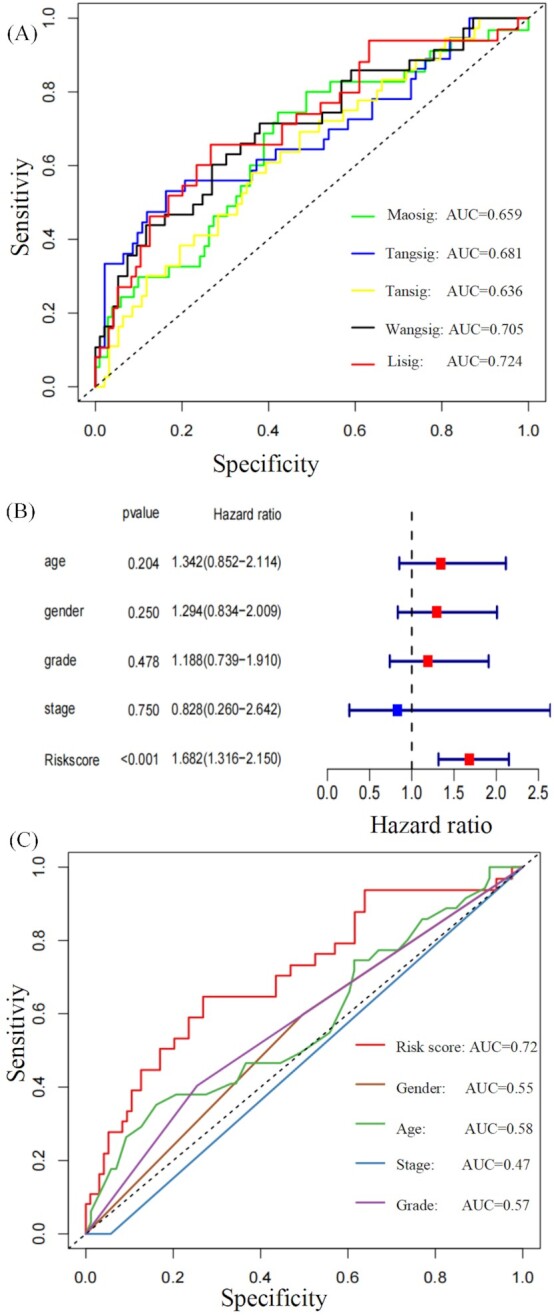
Results: A prognostic signature based on five IRGs (MET, ERAP2, IL20RB, EREG, and SHC2) was constructed in TCGA-PDAC and comprehensively validated in ICGC and GEO cohorts. Multivariate Cox regression analysis demonstrated that this signature had an independent prognostic value. The area under the curve (AUC) values of the receiver operating characteristic (ROC) curve at 1, 3, and 5 years of survival were 0.724, 0.702, and 0.776, respectively. We further demonstrated that our signature has better prognostic performance than recently published ones and is superior to traditional clinical factors such as grade and tumor node metastasis classification (TNM) stage in predicting survival. Moreover, we found higher abundance of CD8+ T cells and lower M2-like macrophages in the low-risk group of TCGA-PDAC, and predicted a higher proportion of immunotherapeutic responders in the low-risk group.
Conclusions: We constructed an optimal prognostic model which had independent prognostic value and was comprehensively validated in external PDAC databases. Additionally, this five-genes signature could predict immune infiltration characteristics. Moreover, the signature helped stratify PDAC patients who might be more responsive to immunotherapy.
Keywords: clinical outcome; immune-related gene; immunotherapy; pancreatic ductal adenocarcinoma.
© The Author(s) 2022. Published by Oxford University Press on behalf of the West China School of Medicine & West China Hospital of Sichuan University.
Figures
Similar articles
-
Construction of a prognostic model with exosome biogenesis- and release-related genes and identification of RAB27B in immune infiltration of pancreatic cancer.Transl Cancer Res. 2024 Sep 30;13(9):4846-4865. doi: 10.21037/tcr-24-54. Epub 2024 Sep 27. Transl Cancer Res. 2024. PMID: 39430819 Free PMC article.
-
N6-methylandenosine-related lncRNAs play an important role in the prognosis and immune microenvironment of pancreatic ductal adenocarcinoma.Sci Rep. 2021 Sep 8;11(1):17844. doi: 10.1038/s41598-021-97362-9. Sci Rep. 2021. PMID: 34497315 Free PMC article.
-
Analysis of Immune-Related Signatures Related to CD4+ T Cell Infiltration With Gene Co-Expression Network in Pancreatic Adenocarcinoma.Front Oncol. 2021 Jul 23;11:674897. doi: 10.3389/fonc.2021.674897. eCollection 2021. Front Oncol. 2021. PMID: 34367961 Free PMC article.
-
A Comprehensive Transcriptional Signature in Pancreatic Ductal Adenocarcinoma Reveals New Insights into the Immune and Desmoplastic Microenvironments.Cancers (Basel). 2023 May 24;15(11):2887. doi: 10.3390/cancers15112887. Cancers (Basel). 2023. PMID: 37296850 Free PMC article. Review.
-
Nanoparticle-Based Therapeutic Strategies for Enhanced Pancreatic Ductal Adenocarcinoma Immunotherapy.Pharmaceutics. 2022 Sep 24;14(10):2033. doi: 10.3390/pharmaceutics14102033. Pharmaceutics. 2022. PMID: 36297467 Free PMC article. Review.
Cited by
-
Perspectives for immunotherapy of EBV-associated GLELC: A relatively "hot" tumor microenvironment.Cancer Med. 2023 Oct;12(19):19838-19849. doi: 10.1002/cam4.6555. Epub 2023 Sep 21. Cancer Med. 2023. PMID: 37732493 Free PMC article.
-
Unveiling the impact of ERAP1 and ERAP2 on migration, angiogenesis and ER stress response.Front Cell Dev Biol. 2025 Mar 28;13:1564649. doi: 10.3389/fcell.2025.1564649. eCollection 2025. Front Cell Dev Biol. 2025. PMID: 40226591 Free PMC article. Review.
-
Keratin 17 modulates the immune topography of pancreatic cancer.J Transl Med. 2024 May 10;22(1):443. doi: 10.1186/s12967-024-05252-1. J Transl Med. 2024. PMID: 38730319 Free PMC article.
References
LinkOut - more resources
Full Text Sources
Research Materials
Miscellaneous