. 2022 Jun 24;50(11):6532-6548.
doi: 10.1093/nar/gkac490.

Role of aIF5B in archaeal translation initiation

Affiliations

Role of aIF5B in archaeal translation initiation

Ramy Kazan et al. Nucleic Acids Res. .

Abstract

In eukaryotes and in archaea late steps of translation initiation involve the two initiation factors e/aIF5B and e/aIF1A. In eukaryotes, the role of eIF5B in ribosomal subunit joining is established and structural data showing eIF5B bound to the full ribosome were obtained. To achieve its function, eIF5B collaborates with eIF1A. However, structural data illustrating how these two factors interact on the small ribosomal subunit have long been awaited. The role of the archaeal counterparts, aIF5B and aIF1A, remains to be extensively addressed. Here, we study the late steps of Pyrococcus abyssi translation initiation. Using in vitro reconstituted initiation complexes and light scattering, we show that aIF5B bound to GTP accelerates subunit joining without the need for GTP hydrolysis. We report the crystallographic structures of aIF5B bound to GDP and GTP and analyze domain movements associated to these two nucleotide states. Finally, we present the cryo-EM structure of an initiation complex containing 30S bound to mRNA, Met-tRNAiMet, aIF5B and aIF1A at 2.7 Å resolution. Structural data shows how archaeal 5B and 1A factors cooperate to induce a conformation of the initiator tRNA favorable to subunit joining. Archaeal and eukaryotic features of late steps of translation initiation are discussed.


Figures

Graphical Abstract
Graphical Abstract
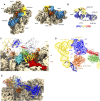
Role of aIF5B in archaeal translation initiation.
Figure 1.
Figure 1.
Pa-aIF5B is active in GTP hydrolysis and subunit joining. (A) Time course of [γ]32P-GTP hydrolysis by aIF5B. aIF5B (1 μM) was incubated at 51°C with [γ]32P-GTP (13 nM) in the presence of the indicated components. At the indicated times, the fraction of remaining GTP was measured (see Materials and Methods). Data points were fitted with single exponentials. Each experiment was repeated 4–5 times from which rate constants (k) and associated standard deviation were calculated. Representative experiments are shown. Added components were: 30S and 50S subunits (200 nM each, closed circles, k = 0.25 ± 0.02 min–1), 30S, 50S, Met-tRNAiMet and mRNA (200 nM each, closed squares, k = 0.35 ± 0.04 min–1), 30S, 50S, Met-tRNAiMet, mRNA and aIF1A (200 nM each, open triangles, k = 0.32 ± 0.02 min–1). The crosses represent the same experiment with 30S, 50S, Met-tRNAiMet, mRNA and aIF1A, but aIF5B was replaced by its H82A variant (k < 0.01 min–1). A control experiment with aIF5B alone is represented by closed diamonds (k < 0.01 min–1). The same result (k < 0.01 min–1) was obtained in the presence of aIF5B and 30S subunits. With aIF5B and 50S subunits, slow hydrolysis (k = 0.055 ± 0.002 min–1) was observed that is probably due to some contamination of 50S subunits by 30S subunits. (B) Time course of ribosomal subunits association as measured by light scattering. Data points were fitted to a hyperbolic equation (62) from which rate constants were deduced. The figure shows representative experiments with the data points and the corresponding fitted curves. In the representation, data were scaled using the fitted value of the zero point in order to facilitate comparison. Black: 30S and 50S subunits assembled in the presence of GTP only; Blue: 30S subunits preincubated with aIF2, Met-tRNAiMet, mRNA, aIF1A and GTP, mixed with 50S subunits, aIF5B and GTP; Orange: same experiment but aIF5B was replaced by its H82A variant; Brown: 30S subunits preincubated with aIF2, Met-tRNAiMet, mRNA, aIF1A and GTP, mixed with 50S subunits and GTP; light grey: 30S subunits containing Met-tRNAiMet, mRNA and GTP, mixed with 50S subunits and GTP; dark grey: 30S and 50S subunits assembled in the presence of aIF5B-H82A and GTP only. Rate constants deduced from the average of at least three measurements were 11.4 ± 3.0 min–1 (blue); 11.4 ± 1.8 min–1 (orange); 0.32 ± 0.04 min–1 (light grey); 0.84 ± 0.06 min–1 (dark grey).
Figure 2.
Figure 2.
Crystallographic structures of aIF5B from P. abyssi. (A) Cartoon representation of full-length aIF5B. The aIF5B domains are colored as follows; domain I gray (-229), domain II yellow (230–348), domain III green (350–438), α12 red, (439–464), domain IV blue (465–591) and the C-terminal α15 helix magenta (591–598). The GDP is shown as sticks and main regions involved in the binding of the nucleotide are colored as follows, GKT loop deep blue, switch 1 (SW1) slate blue, switch 2 (SW2) marine and the β13-β14 loop of domain II light blue. Domain IV is shown in two orientations. (B) Cartoon representation of aIF5B-ΔC. The color code is the same as in view A. Domains I of the two structures have been superimposed. Movements of domains II and III from aIF5B to aIF5B-ΔC have been calculated with Pymol. Rotation axes are shown as blue arrows, rotation angles and translations are indicated beside domains II and III. (C) GTP binding site. The 1.7 Å resolution ‘2Fo-Fc’ map contoured at 2.6 standard deviations is drawn using the carve command of Pymol. GTP, magnesium (green), water (red) and the sodium (yellow) with important residues of SW1, SW2, the GKT loop and h12 are shown.
Figure 3.
Figure 3.
Cryo-EM structure of IC3. (A) Map B colored according to its composition, the SSU in beige, Met:tRNAiMet in bright yellow, aIF1A in orange and aIF5B in blue. The map is shown in two orientations. (B) Local resolution of the multibody refinement map B2 calculated using the script implemented in RELION (72). (C) IC3 structure showing interaction of aIF5B with the SSU and aIF1A.The color code is the same as in Figure 2. uS12 is in cyan. h15 is in red, h5 and h14 are in brown. The mRNA is in dark blue. (D) Closeup showing the cryo-EM map obtained after multibody refinement around aIF1A and aIF5B. The color code is the same as in Figure 2. (E) Superimposition of 30S:mRNA:aIF1A:Met-tRNAiMet and 30S:mRNA:aIF1A:aIF5B-DIV:Met-tRNAiMet subcomplexes onto IC3 showing the positions of the initiator tRNA in the three structures. Met-tRNAiMet is dark pink in 30S:mRNA:aIF1A:Met-tRNAiMet, light pink in 30S:mRNA:aIF1A:aIF5B-DIV:Met-tRNAiMet and yellow in IC3. Domain IV of aIF5B is light blue in 30S:mRNA:aIF1A:aIF5B-DIV:Met-tRNAiMet and dark blue in IC3. This view shows that the conformation of the initiator tRNA is constrained by the interactions of aIF5B with the SSU and with aIF1A.
Figure 4.
Figure 4.
Met-tRNAiMet and aIF5B in IC3. (A) Closeup of map B showing the codon:anticodon interaction at the P site. The C-terminal tail of uS9 is shown in green. mRNA bases are in blue, rRNA in beige and tRNA in yellow. Another orientation is shown in Supplementary Figure S8. (B) Closeup of map B2 around GDPNP. The color code is the same as in Figure 2. (C) Interaction of aIF5B-DII with the 30S. See also the text and Supplementary Table S4 for the description of the important residues shown here as sticks. (D) Closeup of map B2 at domain II and SSU interface. (E) Closeup of map B2 at the interface of aIF5B-DIII and uS12. uS12 is in cyan.
Figure 5.
Figure 5.
Comparison of Pa-aIF5B structures. In views (A), aIF5B:GDP, (B), aIF5B in IC3 and (C), aIF5B-ΔC:GTP, domains I of all structures were superimposed. Movements of domain II and III with respect of domain I were calculated with Pymol considering the structure of aIF5B in IC3 (B) as a reference. Movement of domain IV between aIF5B:GDP and aIF5B in IC3 calculated after superimposition of domains III is 35° rotation and 13 Å translation. (D) Domains I of aIF5B-ΔC:GTP and aIF5B in IC3 were superimposed. The color code is the same as in Figure 2 except that aIF5B-ΔC:GTP domain II is in pink. aIF5B-ΔC:GTP is shown at the foreground and aIF5B in IC3 is shown using transparent cartoons as a reference. The view shows that β8-β9 loop and region 315 of domain II as observed in aIF5B-ΔC:GTP would create steric clashes with h5 and h15. (E) Domains I of aIF5B:GDP and aIF5B in IC3 were superimposed. The color code is the same as in Figure 2 except that aIF5B:GDP domain II is in pink. aIF5B:GDP is shown at the foreground and aIF5B in IC3 is shown using transparent cartoons as a reference. The view shows the β13-β14 loop in the GDP conformation would create bad contacts with h14.
Figure 6.
Figure 6.
IC3 in translation initiation. (A) Comparison of IC3 with 30S:mRNA:aIF1A:aIF2:GDPNP:Met-tRNAiMet (IC2). rRNAs of the the SSUs were superimposed (rsmd 0.6 Å for 30 448 atoms compared). IC2 (PDB ID: 6SWC, (20)) is colored as follows, aIF2α and γ subunits in green, tRNA in light green. IC3 is colored as follows; Met-initiator tRNA in yellow, aIF5B in blue, aIF1A in orange. The two anticodon stem-loops of the initiator tRNAs are very close (rotation 1.1° and 0.3 Å translation) but the rest of the tRNA molecules (nucleotides 1–26 and 44–76) differs by 13° rotation and 5.6 Å translation. The IC2 and IC3 steps are schematized above the structures. (B) Comparison of IC3 with S. cerevisiae 80S:eIF5B complex. rRNA of the SSUs of S. cerevisiae 80S:eIF5B (PDB ID: 6WOO, (47)) and IC3 were superimposed (see text). S. cerevisiae 80S:eIF5B is colored as follows; Met-initiator tRNA in cyan, aIF5B in light blue, uL16 in green. The P-loop of H80, H69 loop and SRL are colored in red. The ribosome is in grey. IC3 is colored as follows; Met-tRNAiMet in yellow, aIF5B in blue, aIF1A in orange, 30S in light pink, Y440 and H82 are shown in blue sticks and A3029 of SRL is in red sticks. The ASLs of the two initiator tRNAs (nucleotides 27–43, rmsd = 0.3; 1.9° rotation and 1.0 Å translation,) and domains I, II and III of e/aIF5B are very close (rsmd = 1.14; 3.3° rotation and 1.0 Å translation). A small displacement between the upper parts of the two tRNAs (nucleotides 1–26 and 41–76, ∼5.7° rotation and 4.2 Å translation) with a concomitant movement of domain IV of e/aIF5B is observed (6.1° rotation and 4.6 Å translation). The view shows that the conformation of aIF5B:Met-tRNAiMet in IC3 is almost equivalent to that of eIF5B:Met-tRNAiMet in the S. cerevisiae 80S:eIF5B. Note that a positioning of H69 as observed in 6WOO would not be compatible with aIF1A. The IC3 model has been resized to allow superimposition onto 6WOO in order to take into account differences due to pixel size determination. IC3 and the following step are schematized above the structures. (C) Binding state of the Met-tRNAiMet. Comparison of the Met-tRNAiMet as observed in 6WOO (cyan) and IC3 (yellow) with the P/P tRNA as observed in a ribosome:EF-Tu:tRNA complex (PDB ID 5AFI, magenta, (98)).

References

    1. Woese C.R., Kandler O., Wheelis M.L.. Towards a natural system of organisms: proposal for the domains archaea, bacteria, and eucarya. Proc. Natl. Acad. Sci. U.S.A. 1990; 87:4576–4579. - PMC - PubMed
    1. Noller H.F., Woese C.R.. Secondary structure of 16S ribosomal RNA. Science. 1981; 212:403–411. - PubMed
    1. Williams T.A., Cox C.J., Foster P.G., Szöllősi G.J., Embley T.M.. Phylogenomics provides robust support for a two-domains tree of life. Nat. Ecol. Evol. 2020; 4:138–147. - PMC - PubMed
    1. Zaremba-Niedzwiedzka K., Caceres E.F., Saw J.H., Backstrom D., Juzokaite L., Vancaester E., Seitz K.W., Anantharaman K., Starnawski P., Kjeldsen K.U.et al. .. Asgard archaea illuminate the origin of eukaryotic cellular complexity. Nature. 2017; 541:353–358. - PubMed
    1. Doolittle W.F. Evolution: two domains of life or three?. Curr. Biol. 2020; 30:R177–R179. - PubMed

Publication types

MeSH terms

Substances