. 2022 Oct;112(4):882-891.
doi: 10.1002/cpt.2686. Epub 2022 Jun 29.

Calibration and Validation of a Mechanistic COVID-19 Model for Translational Quantitative Systems Pharmacology - A Proof-of-Concept Model Development for Remdesivir

Affiliations

Calibration and Validation of a Mechanistic COVID-19 Model for Translational Quantitative Systems Pharmacology - A Proof-of-Concept Model Development for Remdesivir

Mohammadreza Samieegohar et al. Clin Pharmacol Ther. 2022 Oct.

Abstract

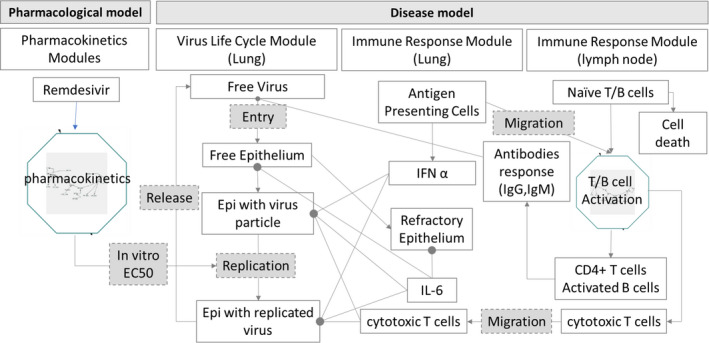
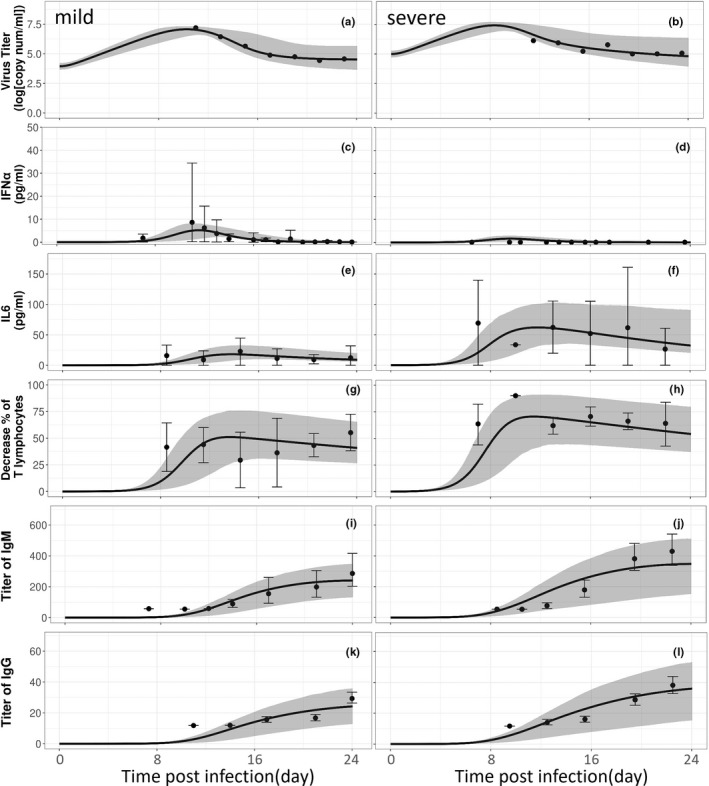
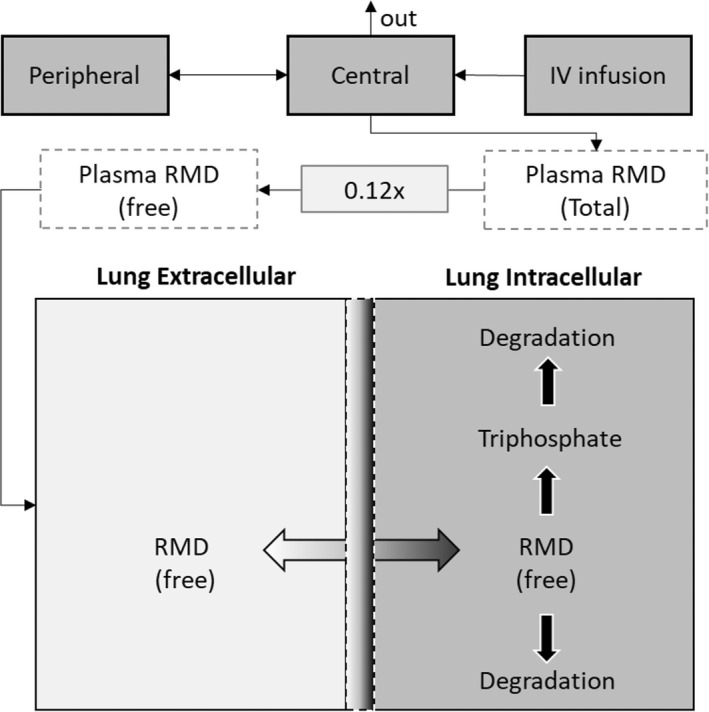
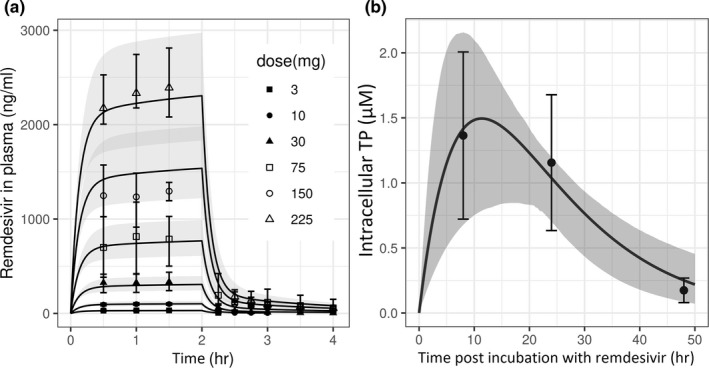
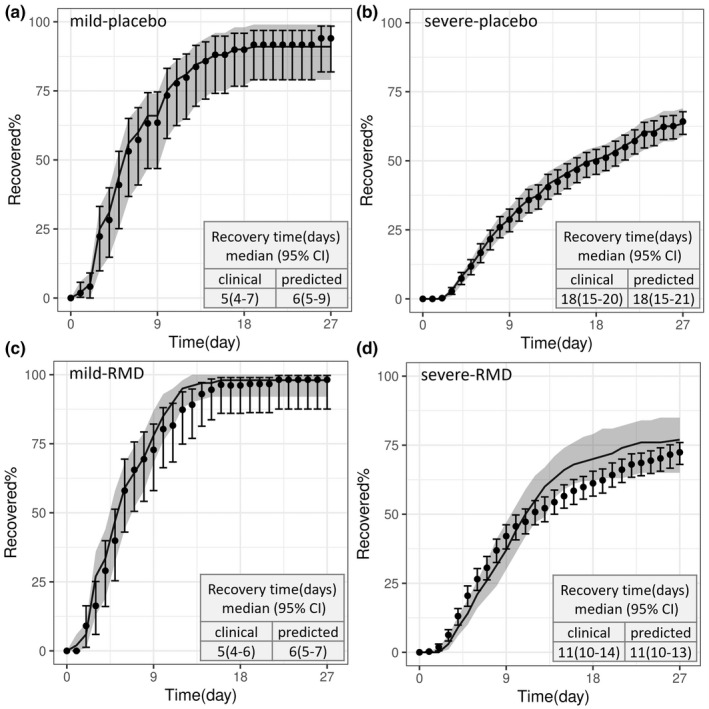
With the ongoing global pandemic of coronavirus disease 2019 (COVID-19), there is an urgent need to accelerate the traditional drug development process. Many studies identified potential COVID-19 therapies based on promising nonclinical data. However, the poor translatability from nonclinical to clinical settings has led to failures of many of these drug candidates in the clinical phase. In this study, we propose a mechanism-based, quantitative framework to translate nonclinical findings to clinical outcome. Adopting a modularized approach, this framework includes an in silico disease model for COVID-19 (virus infection and human immune responses) and a pharmacological component for COVID-19 therapies. The disease model was able to reproduce important longitudinal clinical data for patients with mild and severe COVID-19, including viral titer, key immunological cytokines, antibody responses, and time courses of lymphopenia. Using remdesivir as a proof-of-concept example of model development for the pharmacological component, we developed a pharmacological model that describes the conversion of intravenously administered remdesivir as a prodrug to its active metabolite nucleoside triphosphate through intracellular metabolism and connected it to the COVID-19 disease model. After being calibrated with the placebo arm data, our model was independently and quantitatively able to predict the primary endpoint (time to recovery) of the remdesivir clinical study, Adaptive Covid-19 Clinical Trial (ACTT). Our work demonstrates the possibility of quantitatively predicting clinical outcome based on nonclinical data and mechanistic understanding of the disease and provides a modularized framework to aid in candidate drug selection and clinical trial design for COVID-19 therapeutics.


Conflict of interest statement

The authors declared no competing interests for this work. This report is not an official US Food and Drug Administration guidance or policy statement. No official support or endorsement by the US Food and Drug Administration is intended or should be inferred. As an Associate Editor for Clinical Pharmacology & Therapeutics, David G. Strauss was not involved in the review or decision process for this paper.

Figures

Figure 1
Figure 1
Schematic diagram of the mechanistic in silico COVID‐19 model. The in silico model includes two main submodels: (a) COVID‐19 disease model and (b) pharmacological model. The disease model consists of three submodules: virus life cycle, immune response module in lung, and immune response module in the lymphatic compartment. The pharmacological model describes the pharmacokinetics processes that translate drug dose to clinical exposure and then links it to the disease model. In this figure, remdesivir is shown as an example, whose pharmacological model is linked to the disease model at the point of virus replication due to remdesivir's known effect of suppressing SARS‐CoV‐2 replication. Drugs with other mechanisms of action may have other connection points. For example, pharmacological models of inflammation suppressors (e.g., IL‐6 antibody) can be linked to the disease model at the point of IL‐6 production. Multiple pharmacological modules (submodels) could be added to simulate drug combinations. COVID‐19, coronavirus disease 2019; EC50, half‐maximal effective concentration; Epi, epithelial cell; IFNα, interferon alpha; IL‐6, interleukin 6; IgG, immunoglobulin G; IgM, immunoglobulin M; SARS‐CoV‐2, severe acute respiratory syndrome coronavirus 2. This figure is a high‐level summary of essential processes connected by sequential arrows, with solid lines ending in filled circles representing cell death induced by immune responses (for example cytotoxic T cells killing infected epithelial cells). More details about reaction interconnections, rates, parameters, and equations are provided in the Supplementary Document. [Colour figure can be viewed at wileyonlinelibrary.com]
Figure 2
Figure 2
Disease model calibration. Left column is mild case. Right column is severe case. Points: clinical data; error bar: clinical variability (1 times SD); black line: best fitting curve. Gray band: predicted population behavior (90% confidence interval). Y axes have the same scale for each row and X axes have same scale and are shared in each column.
Figure 3
Figure 3
Full pharmacological model. Pharmacokinetic (PK) model includes the central and peripheral compartments used to convert remdesivir (RMD) intravenous infusion dose to total plasma concentration. A scaling factor of 0.12 is used to convert total plasma RMD to free plasma RMD. An intracellular metabolism model converts extracellular free remdesivir to intracellular active metabolite (triphosphate).
Figure 4
Figure 4
(a) Calibrating of the pharmacokinetic (PK) model. Fitting remdesivir plasma concentration after 2 hours of intravenous administration of 6 different single loading doses (3, 10, 30, 75, 150, and 225 mg). Black line: best fitted curve. Gray band: predicted population, points with error bars: clinical data. (b) Intracellular nucleoside triphosphate (TP) concentration following in vitro incubation with the parent drug remdesivir. Black points: the intracellular TP concentration in primary human airway epithelial (HAE) cultures after incubating with 1 μM remdesivir. Black line: fitted curve based on intracellular metabolism model, gray band: predicted population.
Figure 5
Figure 5
Calibrating (a, b) and validating (c, d) the model for the primary endpoint (time to recovery) used in the remdesivir trial. For model calibration, placebo arm time‐dependent percentage of recovered patients in the mild (a) and severe (b) disease groups were used to adjust the model parameters. For model validation, the calibrated model was used to independently predict remdesivir arm (RMD) data for mild (c) and severe (b) patients without any parameter adjustments. Of note in the Adaptive Covid‐19 Clinical Trial (ACTT) study mild/moderate disease was defined by a SpO2 > 94% and respiratory rate < 24 breaths per minute without supplemental oxygen requirement, whereas severe disease was defined as meeting one of the following criteria: requiring invasive or noninvasive mechanical ventilation, requiring supplemental oxygen, an SpO2 ≤ 94% on room air, or tachypnea (respiratory rate ≥ 24 breaths per minute). These definitions are generally aligned with other studies and also aligned with our virtual populations of mild and severe disease. Black points: Kaplan–Meier estimation of clinical data. Error bar: 95% confidence interval of clinical data. Black line: simulated curve based on subjects in model population. Gray band: predicted uncertainty quantification. X axis: time (in days) since the start of the trial. Y axis: percentage of recovered patients. Day 0, is the day that subjects were admitted into the clinical trial. Table shows the median recovery day and 95% confidence interval.

Similar articles

Cited by

References

    1. Cinatl, J. , Morgenstern, B. , Bauer, G. , Chandra, P. , Rabenau, H. & Doerr, H. Treatment of SARS with human interferons. Lancet 362, 293–294 (2003). - PMC - PubMed
    1. Gastanaduy, P.A. Update: severe respiratory illness associated with Middle East respiratory syndrome coronavirus (MERS‐CoV)—worldwide, 2012–2013. Morb. Mortal Wkly. Rep. 62, 480 (2013). - PMC - PubMed
    1. Wu, J.T. , Leung, K. & Leung, G.M. Nowcasting and forecasting the potential domestic and international spread of the 2019‐nCoV outbreak originating in Wuhan, China: a modelling study. Lancet 395, 689–697 (2020). - PMC - PubMed
    1. Chilamakuri, R. & Agarwal, S. COVID‐19: characteristics and therapeutics. Cell 10, 206 (2021). - PMC - PubMed
    1. Samadizadeh, S. , Masoudi, M. , Rastegar, M. , Salimi, V. , Shahbaz, M.B. & Tahamtan, A. COVID‐19: why does disease severity vary among individuals? Respir. Med. 180, 106356 (2021). - PMC - PubMed

Publication types

Grants and funding