. 2022 Jul 1;15(7):dmm049342.
doi: 10.1242/dmm.049342. Epub 2022 Jul 25.

Natural history of a mouse model of X-linked myotubular myopathy

Affiliations

Natural history of a mouse model of X-linked myotubular myopathy

Ege Sarikaya et al. Dis Model Mech. .

Abstract

X-linked myotubular myopathy (XLMTM) is a severe monogenetic disorder of the skeletal muscle. It is caused by loss-of-expression/function mutations in the myotubularin (MTM1) gene. Much of what is known about the disease, as well as the treatment strategies, has been uncovered through experimentation in pre-clinical models, particularly the Mtm1 gene knockout mouse line (Mtm1 KO). Despite this understanding, and the identification of potential therapies, much remains to be understood about XLMTM disease pathomechanisms, and about the normal functions of MTM1 in muscle development. To lay the groundwork for addressing these knowledge gaps, we performed a natural history study of Mtm1 KO mice. This included longitudinal comparative analyses of motor phenotype, transcriptome and proteome profiles, muscle structure and targeted molecular pathways. We identified age-associated changes in gene expression, mitochondrial function, myofiber size and key molecular markers, including DNM2. Importantly, some molecular and histopathologic changes preceded overt phenotypic changes, while others, such as triad structural alternations, occurred coincidentally with the presence of severe weakness. In total, this study provides a comprehensive longitudinal evaluation of the murine XLMTM disease process, and thus provides a critical framework for future investigations.

Keywords: Mice; Muscle disease; Myotubular myopathy; Myotubularin; Natural history.


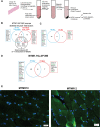
Conflict of interest statement

Competing interests J.J.D. has sponsored research agreements with Astellas Gene Therapy and Dynacure. None of the research in this study was performed as part of these agreements. For all other authors, there are no competing or financial interests.

Figures

Fig. 1.
Fig. 1.
Phenotypic studies of the Mtm1 knockout mouse model. (A) Schematic depicting the four phases of the disease process in Mtm1 knockout (Mtm1−/y or Mtm1 KO) mice. (B-D) Longitudinal phenotypic analyses of wild-type (WT) littermates versus Mtm1 KO mice at 14, 21, 28 and 35 days (WT n=11, KO n=10). (B) Scatter plot comparing weight (g) of WT versus Mtm1 KO mice (values are mean±s.e.m.). 14 days: WT 7.8±0.3 g, KO 6.6±0.3 g; 21 days: WT 9.8±0.3 g, KO 7.6±0.4 g (***P<0.001); 28 days: WT 16.0±0.5 g, KO 11.2±0.3 g (****P<0.0001); and 35 days: WT 21.0±0.5 g, KO 14.0±0.4 g (****P<0.0001). (C) Number of rears (as measured by open field testing; values are mean±s.e.m.). 14 days: WT 0.2±0.1, KO 1±0.4; 21 days: WT 27.4±5.3, KO 5.8±2.2 (****P<0.0001), 28 days: WT 72.2±8.2, KO 4.4±1.2 (****P<0.0001); and 35 days: WT 101±14.2, KO 13.2±3.4 (****P<0.0001). (D) Grip strength (expressed as a percentage of WT; values are mean±s.e.m.). 14 days: WT 100±6.3%, KO 88.8±6%; 21 days: 100.3±4.6%, KO 81.1±3.9% (**P<0.001); 28 days: WT 99.4±1.8%, KO 88.8±6%; and 35 days: WT 100±2.8%, KO 77.5±3% (****P<0.0001). Statistical analysis by log-rank (Mantel–Cox) test or unpaired two-tailed Student's t-test.
Fig. 2.
Fig. 2.
Progressive histological changes in Mtm1 knockout mice. (A,B) Histopathology as defined by staining with Hematoxylin and Eosin (H&E) (A) and succinate dehydrogenase (SDH) (B). Scale bars: 50 µm. (C) There is an observable increase in % central nuclei in Mtm1 KO mice compared to WT starting at 21 days (WT n=3-7, KO n=4 per time point). % central nuclei (values are mean±s.e.m.). 14 days: WT 0.64±0.20%, KO: 3.32±0.90%; 21 days: WT 0.84±0.14%, KO 1.98±0.52% (*P<0.05); 28 days: WT 0.70±0.10%, KO 1.37±0.26% (*P<0.05); and 35 days: WT 0.17±0.09%, KO 8.70±1.3% (**P<0.01). (D) Mtm1 KO mice have significantly smaller fibers starting at 28 days. Fiber size (WT n=3-5, KO n=3-5; values are mean±s.e.m.). 14 days: WT 20.16±0.47 μm, KO 25.03±6.57 μm; 21 days: WT 20.89±0.51 μm, KO 18.51±1.43 μm; 28 days: WT 27.66±0.59 μm, KO 21.67±1.21 μm (**P<0.001); and 35 days: WT 46.02±3.77 μm, KO 21.78±0.47 μm (****P<0.0001). (E) Quantification of ring fibers, as determined with SDH staining (WT n=2-3, KO n=3 per time point; values are mean±s.e.m.). 14 days: WT 0.01±0.01, KO 0.072±0.034; 21 days: WT 0, KO 0.11±0 (****P<0.0001); 28 days: WT 0, KO 0.063±0.03; and 35 days WT 0, KO 0.14±0 (***P<0.001). Statistical analysis by unpaired two-tailed Student's t-test.
Fig. 3.
Fig. 3.
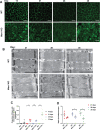
Progressive histopathologic and ultrastructural changes in Mtm1 knockout mice. (A) Dysferlin immunofluorescence at 14, 21, 28 and 35 days on skeletal muscle from WT and Mtm1 KO mice. Scale bars: 50 µm. (B) Electron microscopy of skeletal muscle from WT and Mtm1 KO mice. Scale bars: 1 µm. Ratios of triads/sarcomere (WT n=3-4, KO n=4; values are mean±s.e.m.). 21 days: WT 1.03±0.18, KO 0.68±0.04; 28 days: WT 1.11±0.10, KO 0.77±0.10 (*P<0.05); and 35 days: WT 1.20±0.12, KO 0.57±0.14 (*P<0.05). (C) Quantification of dysferlin immunostaining. An increasing proportion of myofibers with intracellular dysferlin aggregates is observed in Mtm1 KO mice starting at 21 days. Proportion of myofibers with intracellular dysferlin aggregations (WT n=3-7, KO n=4 per time point; values are mean±s.e.m.). 14 days: WT 0, KO 0.055±0.04; 21 days: WT 0, KO 0.16±0.04 (*P<0.05); 28 days: WT 0, KO 0.14±0.02 (***P<0.001); and 35 days: WT 0, KO 0.43±0.07 (**P<0.001). (D) Quantification of triad number. Triad number per sarcomere (WT n=3-4, KO n=4 per time point; values are mean±s.e.m.). 21 days: WT 1.1±0.11, KO 0.68±0.18; 28 days: WT 1.2±0.19, KO 0.77±0.11 (*P<0.05); and 35 days: WT 1.30±0.31, KO 0.57±0.19 (*P<0.05). Statistical analysis by unpaired two-tailed Student's t-test.
Fig. 4.
Fig. 4.
Skeletal muscle magnetic resonance imaging (MRI) of WT and Mtm1 knockout mice. (A) T2-weighted muscle MRI images from immediately post-mortem hindlimbs of WT and Mtm1 KO mice performed at 35 days. Segmentation was done manually using ITK-SNAP software. (B) Graph depicting distal muscle volume for 12 skeletal muscles as determined from MRI (WT n=3, Mtm1 KO n=3; values are mean±s.e.m.). Distal muscle volume (mm3) for GL: WT 37.07±0.09 mm3, KO 15.9±0.13 mm3 (****P<0.0001); GM: WT 32.18±0.51 mm3, KO 17.62±0.20 mm3 (***P<0.001); P: WT 20.12±0.60 mm3, KO 4.2±0.16 mm3 (***P<0.001); PP: WT 3.90±0.20 mm3, KO 2.08±0.05 mm3 (**P<0.001); PB: WT 6.15±0.13 mm3, KO 3.47±0.26 mm3 (**P<0.001); TA: WT 31.0±0.62 mm3, KO 11.78±0.86 mm3 (***P<0.001); EDL: WT 7.42±0.12 mm3, KO 4.60±0.21 mm3 (***P<0.001); SL: WT 10.7±0.25 mm3, KO 11.23±0.50 mm3; PL: WT 6.43±0.12 mm3, KO 4.0±0.13 mm3 (***P<0.001); FHLD: WT 7.82±0. 16 mm3, KO 4.62±0.25 mm3 (***P<0.001); TP: WT 9.90±0.23 mm3, KO 5.10±0.08 mm3 (***P<0.001); FL: WT 5.50±0.43 mm3, KO 2.30±0.08 mm3. n=3 per condition. GL, gastrocnemius lateralis, GM, gastrocnemius medialis, P, plantaris; PP, popliteus; PB, peroneus brevis; TA, tibialis anterior; EDL, extensor digitalis longus; SL, soleus; PL, peroneus longus; FHLD, flexor hallucis longus; TP, tibialis posterior; FL, flexor digitorum longus. (C) Muscle weight (expressed as a percentage of total body weight muscle weight for TA, Quad, Gastro and Ham) normalized to body weight at 35 days (WT n=4-6, KO n=4-6; values are mean±s.e.m.). Percentage weight for TA: WT 0.20±0.02%, KO 0.11±0.01% (**P<0.001); Quad: WT 0.47±0.02%, KO 0.36±0.02% (***P<0.001); Gastro: WT 0.43±0.04%, KO 0.30±0.02% (**P<0.001); and Ham: WT 0.61±0.46%, KO 0.35±0.13% (****P<0.0001). TA, tibialis anterior; Quad, quadriceps; Gastro, gastrocnemius; Ham, hamstring. Statistical analysis by unpaired two-tailed Student's t-test.
Fig. 5.
Fig. 5.
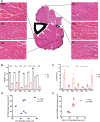
Comparison of histopathologic characteristics between muscle groups. (A) Representative images from H&E-stained muscle cryosections from the distal portion of the hindlimb from 35-day-old Mtm1 KO mice (WT n=3, KO n=3 for each). Scale bars: 20 µm. (B,C) Graphs depicting myofiber size and % central nuclei for individual skeletal muscles of the hindlimb of WT and Mtm1 KO mice at 35 days. (B) Myofiber size (μm; values are mean±s.e.m.). TA: WT 41.78±0.16 μm, KO 24.33±0.18 μm (****P<0.0001); SL: WT 42±0.10 μm, KO 25.70±0.25 μm (****P<0.0001); EDL: WT 43.14±0.26 μm, KO 17.86±0.11 μm (****P<0.0001); PL: WT 40.50±0.16 μm, KO 20.65±0.06 μm (****P<0.0001); GM: WT 42.70±0.10 μm, KO 25.50±0.11 μm (****P<0.0001); GL: WT 48.90±0.19 μm, KO 34.85±0.04 μm (****P<0.0001); P: WT 37.06±0.07 μm, KO 19.0±0.07 μm (****P<0.0001). (C) % central nuclei (values are mean±s.e.m.). TA: WT 0.17±0.09%, KO 8.7±1.3% (*P<0.05); SL: WT 0%, KO 2.0±0.3% (*P<0.05); EDL: WT 0%, KO 5.9±1.4%; PL: WT 0.28±0.28%, KO 2.8±0.3% (**P<0.01), GM: WT 0%, KO 1.2±0.2% (*P<0.05), GL: WT 0.16±0.16%, KO 2.3±0.40% (*P<0.05); P: WT 0.61±0.61%, KO 7.8±2.1%. TA, tibialis anterior; SL, soleus; EDL, extensor digitalis longus; PL, peroneus longus; GM, gastrocnemius medialis; GL, gastrocnemius lateralis; P, plantaris. Statistical analysis by unpaired two-tailed Student's t-test. (D,E) Pearson correlation coefficient (r) derived from linear regression of myofiber size (diameter, μm) and MRI distal volume (mm3) (Fig. 4B) in WT (D) and Mtm1 KO (E) mice at 35 days. Significance indicated at P<0.05.
Fig. 6.
Fig. 6.
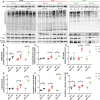
Molecular changes in Mtm1 KO mice. (A) Representative western blot images of DNM2, polyubiquitinated protein, p62, α-tubulin and acetylated-α-tubulin from protein extracts of TA muscle taken at 14, 21 and 35 days. (B-G) Quantification of protein levels relative to total protein staining and normalized to average WT expression (see also Fig. S2). (B) DNM2 levels are elevated at 14 (1.36-fold, **P<0.01), 21 (1.46-fold, *P<0.05) and 35 (2.14-fold, **P<0.01) days. (C) Polyubiquitinated protein levels are elevated at 21 (1.33-fold, *P<0.05) and 35 (1.46-fold, ***P<0.001) days. (D) p62 levels are elevated at 21 (1.99-fold, *P<0.01) and 35 (2.10-fold, **P<0.01) days. (E) α-tubulin levels are elevated at 21 (1.76-fold, *P<0.05) and 35 (2.78-fold, ***P<0.001) days. (F) Acetylated-α-tubulin levels are elevated at 14 (1.53-fold, ***P<0.001), 21 (2.26-fold, **P=0.0041) and 35 (5.04-fold, ***P<0.001) days. (G) Acetylated-α-tubulin/α-tubulin ratio is elevated at 14 (1.41-fold, *P<0.05), 21 (1.34-fold, *P<0.05) and 35 (1.80-fold, ***P<0.001) days. All quantifications are from n=4 mice/genotype and done with three technical replicates. Statistical analysis by unpaired two-tailed Student's t-test.
Fig. 7.
Fig. 7.
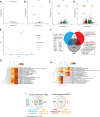
Longitudinal transcription analysis of Mtm1 knockout mice. (A-D) Volcano plots highlighting differentially expressed genes (DEGs) between WT and Mtm1 KO mice from TA muscle at 1 day (A), 14 days (B), 21 days (C) and 35 days (D) (adjusted P-value<0.01, log2FC>0.585). Statistical analysis by unpaired two-tailed Student's t-test. (E) Principal component analysis plot of all time points, indicating that gene expression is similar between WT and KO mice at the earliest stage tested but diverges starkly from 21 days onward. Note clustering of 21-day-old and 35-day-old KO mice, indicating shared transcriptional changes. (F) Venn diagram depicting common and unique DEGs at each time point. Boxes highlight major gene ontology (GO) enrichment terms with the associated DEG list. (G,H) Heat map visualization of GO terms enriched at each time point considering all DEGs in each time point (G) and by upregulated or downregulated status (H). (I) Venn diagram highlighting shared DEGs between our dataset and those identified as being in common in three centronuclear myopathy mouse models (including the Mtm1 KO mice on a different background, 129S2PAS) by Djeddi et al. (2021).
Fig. 8.
Fig. 8.
Subcellular proteomics in Mtm1 KO mice. (A) Overview of methods used to perform proteomics on three subcellular fractions from 21-day-old mouse TA muscle. See Materials and Methods section for details. LC-MS/MS, liquid chromatography–tandem mass spectrometry; TMT, tandem mass tag. (B) Heat maps representing the enrichment of proteins in each of the muscle fractions with reference to consensus subcellular location data. Peptide spectrum matches (PSMs) provide an estimate of protein abundance and were used to show what percentage of PSMs for a given protein were identified in each fraction. Data are sorted based on which fraction had the greatest number of 100% PSMs for proteins in the reference set. (C-E) Volcano plots highlighting differentially expressed proteins (DEPs) in the nuclear (C), organellar/membrane (D) and cytosolic fractions (E) (P<0.05, log2FC>0.5). Statistical analysis by unpaired two-tailed Student's t-test. (F-H) Principal component (PC) analysis plots from each fraction. (I) GO term enrichment analysis of DEPs from the organellar/membrane fraction reveals dysregulation of focal adhesions and vesicle-mediated and endocytic pathways in Mtm1 KO mice. (J) Protein–protein interaction network visualization of organellar fraction DEPs show aberrant levels of proteasomal proteins and MAPK signaling pathways in Mtm1 KO mice. (K) Venn diagram highlighting DEPs found in common between the organellar fraction and those identified in a longitudinal study of Mtm1 KO mice by Djeddi et al. (2021). Proteins in green were also identified as either early or late consensus DEGs. All DEPs shown had the same ‘sign’, i.e., upregulated versus downregulated, except for the two proteins indicated in red. PCP, planar cell polarity.
Fig. 9.
Fig. 9.
MTM1 protein interactions in skeletal muscle at 21 and 35 days. (A) Methodology for identifying putative MTM1 interactors using Mtm1-6xHis-tagged mice and immunoprecipitation (IP) followed by mass spectrometry. (B) Interactors identified from skeletal muscle extracts at 35 days, with comparison to interactors identified in previous studies. (C) Interactors from 21-day-old muscle extracts. Note no overlap with the proteins identified at 35 days. (D) Nuclear interactors identified at 35 days, including phosphatase-dead myotubularins MTMR10 and MTMR12. (E) Immunofluorescence images from antibody staining of cryosections from WT TA muscle. MTMR10 localizes primarily to the myonuclei (co-stained with DAPI), whereas MTMR12 is found primarily in the perinuclear compartment. Scale bars: 20 mm.
Fig. 10.
Fig. 10.
Abnormal mitochondrial function in Mtm1 KO mice. (A) Mitochondrial DNA (mtDNA) to nuclear DNA (ncDNA) by quantitative RT-PCR in WT and Mtm1 KO mice over time at 14, 21, 28 and 35 days. Values are mean±s.e.m. relative to WT at each time (WT n=4-7, KO n=4-7). (B,C) Respirometry in frozen muscle (RIFS), using the Seahorse bioanalyzer, done on mitochondria isolated from 35-day-old TA muscle. (B) Representative Seahorse traces of complex II- and IV-dependent respiration of WT and Mtm1 KO mice. C-II, succinate+rotenone-induced respiration for complex II activity; C-IV, TMPD+ascorbate-induced respiration for complex IV activity. Values are mean±s.e.m. pmol O2/min adjusted per μg of protein. OCR, oxygen consumption rate. WT n=5; KO, n=4; values are provided as the mean±s.e.m. (C) Quantification of maximal respiration of complex II- and IV-dependent respiration (WT n=5, KO, n=4; values are mean±s.e.m.). Complex II: WT 24.06±5.39, KO 23.66±5.44; complex IV: WT 32.62±7.37, KO 17.69±4.02 (*P<0.05). Each biological replicate represents the average of two technical replicates. Statistical analysis by unpaired two-tailed Student's t-test.
Fig. 11.
Fig. 11.
Summary of pathologic and molecular changes in the Mtm1 knockout mouse model. Summary of the findings from this paper, including changes in histopathology and molecular markers, mapped across the four stages of the murine disease process. PolyUb, polyubiquitinated protein.

References

    1. Acin-Perez, R., Benador, I. Y., Petcherski, A., Veliova, M., Benavides, G. A., Lagarrigue, S., Caudal, A., Vergnes, L., Murphy, A. N., Karamanlidis, G.et al. (2020). A novel approach to measure mitochondrial respiration in frozen biological samples. EMBO J. 39, e104073. 10.15252/embj.2019104073 - DOI - PMC - PubMed
    1. Al-Qusairi, L., Weiss, N., Toussaint, A., Berbey, C., Messaddeq, N., Kretz, C., Sanoudou, D., Beggs, A. H., Allard, B., Mandel, J. L.et al. (2009). T-tubule disorganization and defective excitation-contraction coupling in muscle fibers lacking myotubularin lipid phosphatase. Proc. Natl. Acad. Sci. USA 106, 18763-18768. 10.1073/pnas.0900705106 - DOI - PMC - PubMed
    1. Al-Qusairi, L., Prokic, I., Amoasii, L., Kretz, C., Messaddeq, N., Mandel, J. L. and Laporte, J. (2013). Lack of myotubularin (MTM1) leads to muscle hypotrophy through unbalanced regulation of the autophagy and ubiquitin-proteasome pathways. FASEB J. 27, 3384-3394. 10.1096/fj.12-220947 - DOI - PubMed
    1. Amburgey, K., Tsuchiya, E., de Chastonay, S., Glueck, M., Alverez, R., Nguyen, C. T., Rutkowski, A., Hornyak, J., Beggs, A. H. and Dowling, J. J. (2017). A natural history study of X-linked myotubular myopathy. Neurology 89, 1355-1364. 10.1212/WNL.0000000000004415 - DOI - PMC - PubMed
    1. Annoussamy, M., Lilien, C., Gidaro, T., Gargaun, E., Che, V., Schara, U., Gangfuss, A., D'Amico, A., Dowling, J. J., Darras, B. T.et al. (2019). X-linked myotubular myopathy: A prospective international natural history study. Neurology 92, e1852-e1867. 10.1212/WNL.0000000000007319 - DOI - PMC - PubMed

Publication types