

Feasibility of a Clinical-Radiomics Model to Predict the Outcomes of Acute Ischemic Stroke
- PMID: 35695316
- PMCID: PMC9340229
- DOI: 10.3348/kjr.2022.0160
Feasibility of a Clinical-Radiomics Model to Predict the Outcomes of Acute Ischemic Stroke
Abstract
Objective: To develop a model incorporating radiomic features and clinical factors to accurately predict acute ischemic stroke (AIS) outcomes.
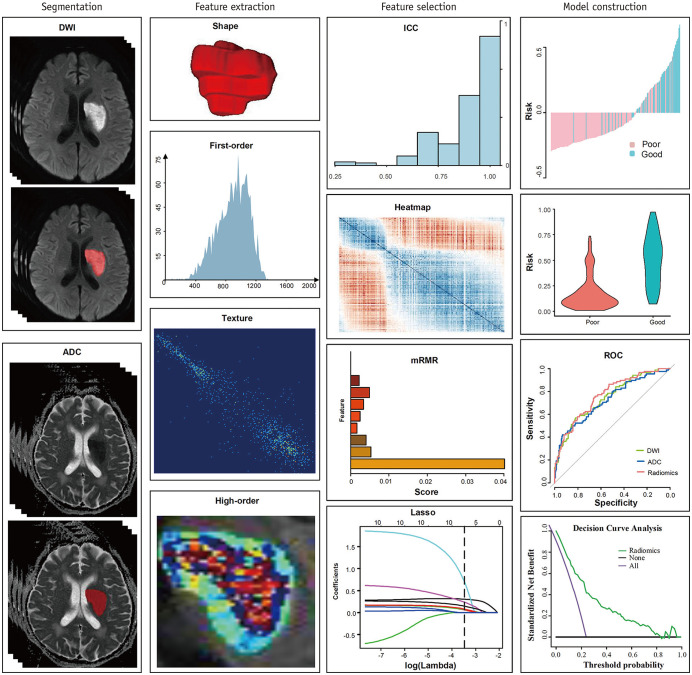
Materials and methods: Data from 522 AIS patients (382 male [73.2%]; mean age ± standard deviation, 58.9 ± 11.5 years) were randomly divided into the training (n = 311) and validation cohorts (n = 211). According to the modified Rankin Scale (mRS) at 6 months after hospital discharge, prognosis was dichotomized into good (mRS ≤ 2) and poor (mRS > 2); 1310 radiomics features were extracted from diffusion-weighted imaging and apparent diffusion coefficient maps. The minimum redundancy maximum relevance algorithm and the least absolute shrinkage and selection operator logistic regression method were implemented to select the features and establish a radiomics model. Univariable and multivariable logistic regression analyses were performed to identify the clinical factors and construct a clinical model. Ultimately, a multivariable logistic regression analysis incorporating independent clinical factors and radiomics score was implemented to establish the final combined prediction model using a backward step-down selection procedure, and a clinical-radiomics nomogram was developed. The models were evaluated using calibration, receiver operating characteristic (ROC), and decision curve analyses.
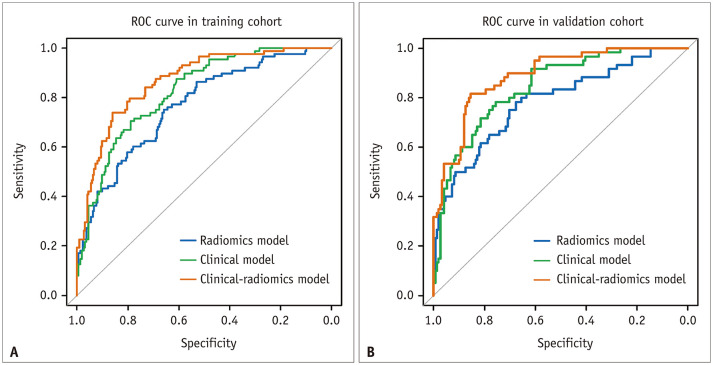
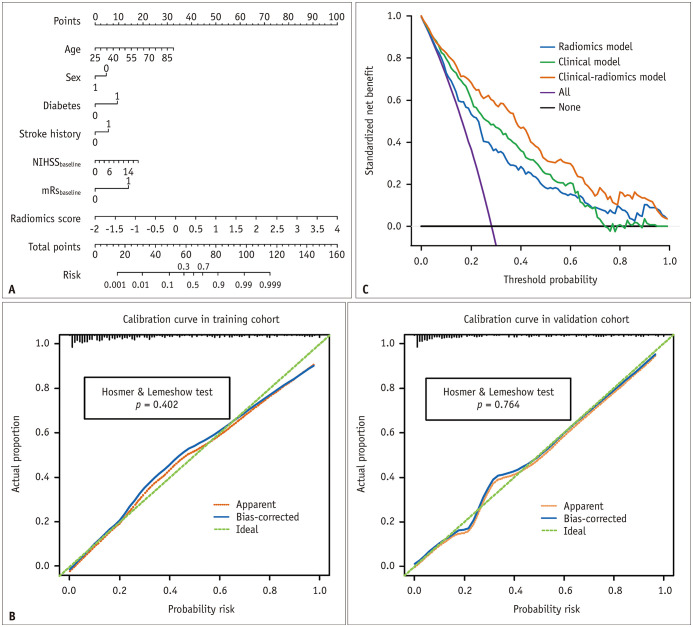
Results: Age, sex, stroke history, diabetes, baseline mRS, baseline National Institutes of Health Stroke Scale score, and radiomics score were independent predictors of AIS outcomes. The area under the ROC curve of the clinical-radiomics model was 0.868 (95% confidence interval, 0.825-0.910) in the training cohort and 0.890 (0.844-0.936) in the validation cohort, which was significantly larger than that of the clinical or radiomics models. The clinical radiomics nomogram was well calibrated (p > 0.05). The decision curve analysis indicated its clinical usefulness.
Conclusion: The clinical-radiomics model outperformed individual clinical or radiomics models and achieved satisfactory performance in predicting AIS outcomes.
Keywords: Diffusion-weighted imaging; Ischemic stroke; Nomogram; Prognosis; Radiomics.
Copyright © 2022 The Korean Society of Radiology.
Conflict of interest statement
The authors have no potential conflicts of interest to disclose.
Figures
References
-
- Campbell BCV, Khatri P. Stroke. Lancet. 2020;396:129–142. - PubMed
-
- Powers WJ, Rabinstein AA, Ackerson T, Adeoye OM, Bambakidis NC, Becker K, et al. 2018 guidelines for the early management of patients with acute ischemic stroke: a guideline for healthcare professionals from the American Heart Association/American Stroke Association. Stroke. 2018;49:e46–e110. - PubMed
-
- Campbell BCV, De Silva DA, Macleod MR, Coutts SB, Schwamm LH, Davis SM, et al. Ischaemic stroke. Nat Rev Dis Primers. 2019;5:70. - PubMed
-
- Barber PA, Powers W. MR DWI does not substitute for stroke severity scores in predicting stroke outcome. Neurology. 2006;66:1138–1139. - PubMed
Publication types
MeSH terms
LinkOut - more resources
Full Text Sources
Medical
