. 2022 Jun 17;479(11):1221-1235.
doi: 10.1042/BCJ20220144.

Endogenous glutamine is rate-limiting for anti-CD3 and anti-CD28 induced CD4+ T-cell proliferation and glycolytic activity under hypoxia and normoxia

Affiliations

Endogenous glutamine is rate-limiting for anti-CD3 and anti-CD28 induced CD4+ T-cell proliferation and glycolytic activity under hypoxia and normoxia

Jonas A Wik et al. Biochem J. .

Abstract

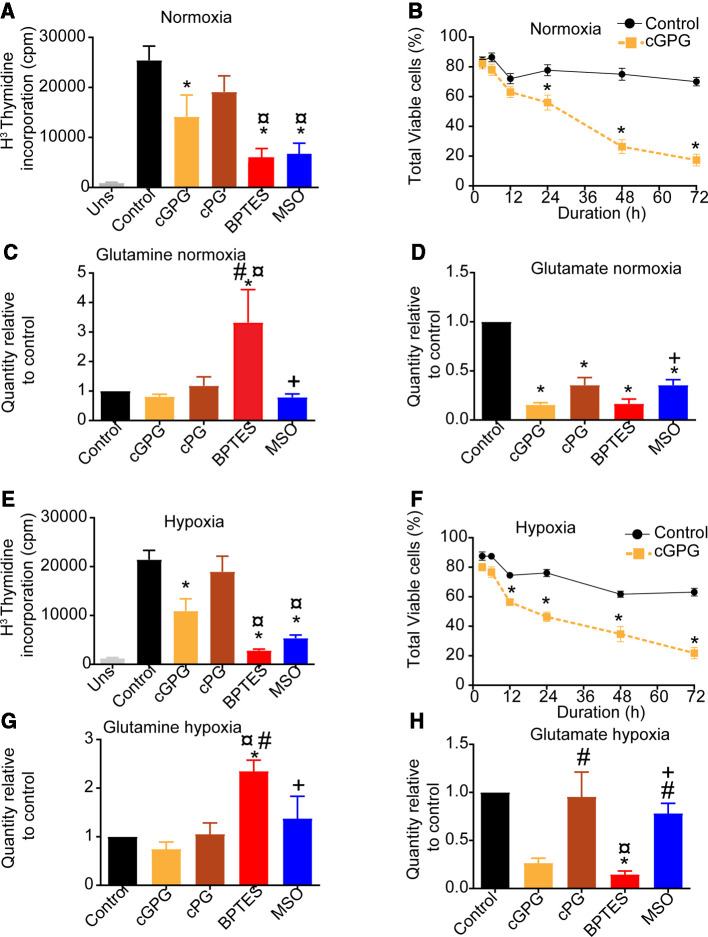
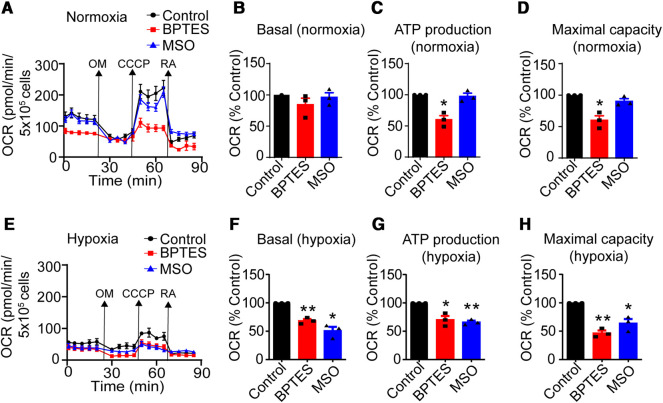
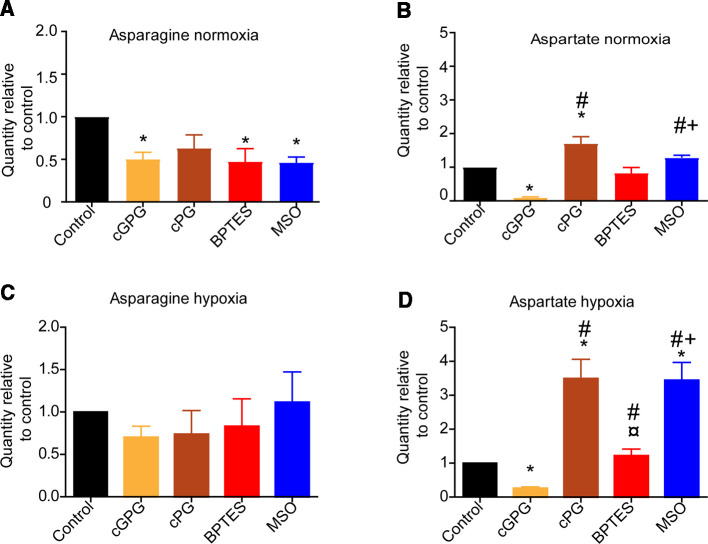
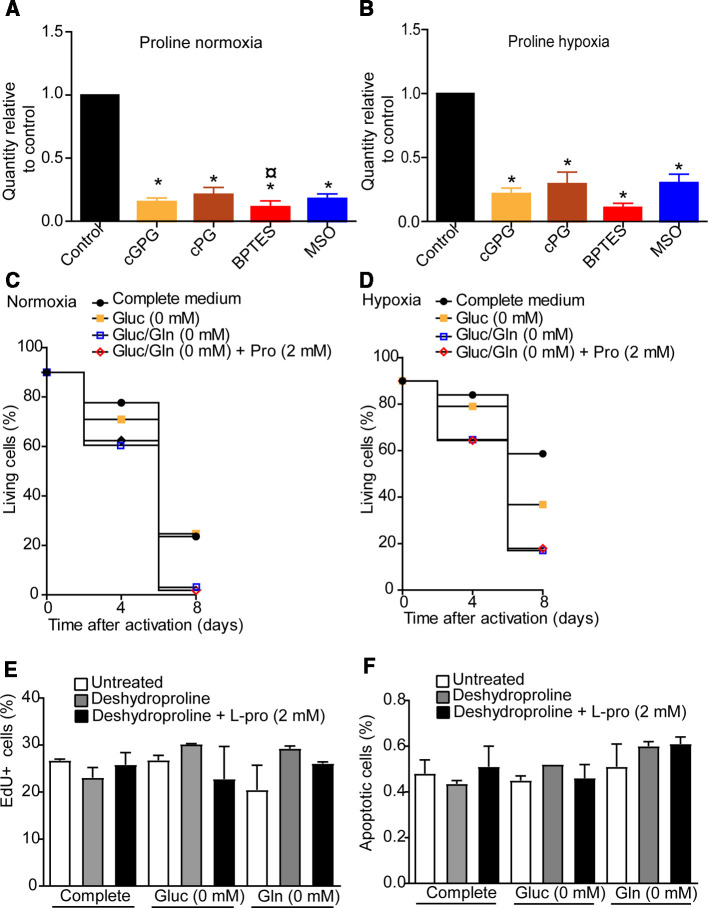
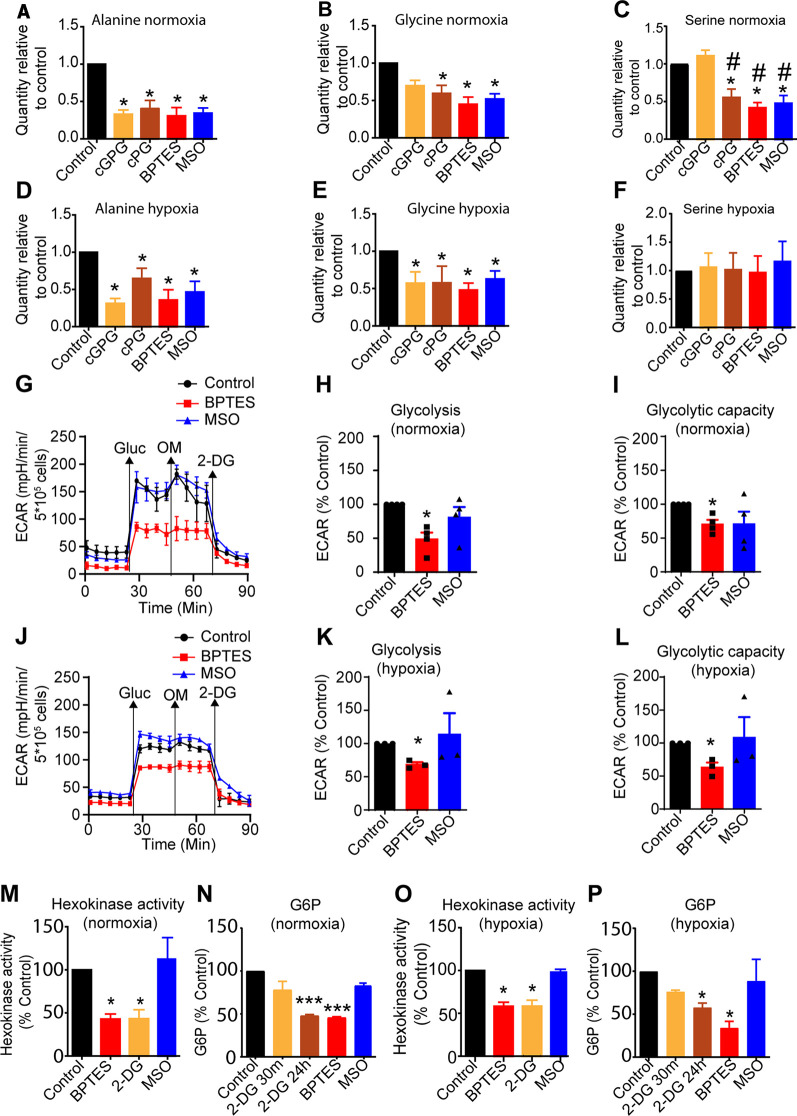
To meet the demand for energy and biomass, T lymphocytes (T cells) activated to proliferation and clonal expansion, require uptake and metabolism of glucose (Gluc) and the amino acid (AA) glutamine (Gln). Whereas exogenous Gln is converted to glutamate (Glu) by glutaminase (GLS), Gln is also synthesized from the endogenous pool of AA through Glu and activity of glutamine synthase (GS). Most of this knowledge comes from studies on cell cultures under ambient oxygen conditions (normoxia, 21% O2). However, in vivo, antigen induced T-cell activation often occurs under moderately hypoxic (1-4% O2) conditions and at various levels of exogenous nutrients. Here, CD4+ T cells were stimulated for 72 h with antibodies targeting the CD3 and CD28 markers at normoxia and hypoxia (1% O2). This was done in the presence and absence of the GLS and GS inhibitors, Bis-2-(5-phenylacetamido-1,3,4-thiadiazol-2-yl) ethyl sulfide (BPTES) and methionine sulfoximine (MSO) and at various combinations of exogenous Gluc, Gln and pyruvate (Pyr) for the last 12 h of stimulation. We found that T-cell proliferation, viability and levels of endogenous AA were significantly influenced by the availability of exogenous Gln, Gluc and Pyr as well as inhibition of GLS and GS. Moreover, inhibition of GLS and GS and levels of oxygen differentially influenced oxygen consumption rate (OCR) and extracellular acidification rate (ECAR). Finally, BPTES-dependent down-regulation of ECAR was associated with reduced hexokinase (HK) activity at both normoxia and hypoxia. Our results demonstrate that Gln availability and metabolism is rate-limiting for CD4+ T-cell activity.

Keywords: BPTES; CD4+ T cells; glutamine; hypoxia; metabolism; normoxia.


Conflict of interest statement

The authors declare that there are no competing interests associated with the manuscript.

Figures

Figure 1.
Figure 1.. Gln deprivation reduces proliferation and viability of CD4+ T cells.
(A) Thymidine incorporation rate in anti-CD3/CD28-stimulated CD4+ T cells under normoxia (21% O2) at 72 h post anti-CD3/CD28-stimulation following in complete media (control) or after deprivation of Gluc, Pyr and Gln (cGPG), Gluc and Pyr (cPG) or treatment with BPTES (25 µM) or MSO (7.5 µM) for the last 12 h. (B) Viability of αCD3/CD28-stimulated CD4+ T cells in control or following cGPG depletion at normoxia (21% O2). Relative levels of Gln (C) and Glu (D) at 72 h post anti-CD3/CD28-stimulation following 12 h of cGPG, cGP depletion, or BPTES or MSO treatment at normoxia (21% O2). (E) Thymidine incorporation rate of αCD3/CD28-stimulated CD4+ T cells under hypoxia (1% O2) at 72 h following either cGPG, cPG depletion or treatment with BPTES or MSO for the last 12 h. (F) Viability of αCD3/CD28)-stimulated CD4+ T cells in control or following cGPG depletion at hypoxia (1% O2). Relative levels of Gln (G) and Glu (H) at 72 h following 12 h of cGPG, cGP depletion, or BPTES or MSO treatment at hypoxia (1% O2). Data are mean ± SEM of three independent experiments in triplicates. * P < 0.05 compared with control , # p < 0.05 compared to cGPG, ¤ P < 0.05 compared to cPG, + P < 0.05 compared with BPTES.
Figure 2.
Figure 2.. Inhibition of Gln metabolism differentially affects OCR at normoxia and hypoxia.
(A) Representative Seahorse experiment of control (●), BPTES stimulated (▪) and MSO (▴) treated CD4+ T cells at normoxia. Basal (B), ATP production (C) and maximal OCR (D) of BPTES and MSO treated CD4+ T cells at normoxia relative to control. (E) Representative Seahorse experiment of control (●), BPTES stimulated (▪) and MSO (▴) treated cells at hypoxia. Basal (F), ATP production (G) and maximal OCR (H) of BPTES and MSO treated CD4+ T cells relative to control at hypoxia. Data are mean ± SEM of three independent experiments in triplicates. * P < 0.05 compared with control, ** P < 0.01 compared with control.
Figure 3.
Figure 3.. Gln deprivation and inhibition of Gln metabolism differentially affects Asn and Asp at normoxia and hypoxia.
Relative quantities of Asn (A) and Asp (B) at normoxia and relative quantities of Asn (C) and Asp (D) at hypoxia relative to control at 72 h following 12 h of cGPG, cPG depletion, or BPTES or MSO treatment. Data are mean ± SEM of three independent experiments in triplicates. * P compared with control # P < 0.05 compared with control, ¤ P < 0.05, compared with cPG, + P < 0.05 compared with BPTES.
Figure 4.
Figure 4.. Pro is depleted following Gln deprivation or inhibition of Gln metabolism at normoxia and hypoxia.
Relative quantities of Pro at 72 h following 12 h of cGPG or cPG depletion, or BPTES or MSO treatment at normoxia (A) and hypoxia (B). Proliferation (C) and apoptosis (D) at 72 h in complete media, gluc-free media or Gln-free media supplemented in the presence or absence of deshydroproline or deshydroproline +2 mM of Pro at normoxia. (D) Long-term survival in complete media, gluc-free media or Gln-free media supplemented in the presence or absence of deshydroproline or deshydroproline +2 mM of Pro at normoxia. (E) Relative quantities of Pro at 72 h following 12 h of cGPG or cPG depletion, or BPTES or MSO treatment at hypoxia. (F) Long-term survival in complete media, gluc-free media or Gln-free media supplemented in the presence or absence of deshydroproline or deshydroproline +2 mM of Pro at hypoxia. Data are mean ± SEM of three independent experiments in triplicates. * P < 0.05 compared with control, # P < 0.05 compared with cGPG, ¤ P < 0.05 compared with cPG, + P < 0.05 compared with BPTES.
Figure 5.
Figure 5.. GLS inhibition, but not GS inhibition reduces glycolysis.
Relative quantities of Ala (A) Gly (B) and Ser (C) at normoxia and Ala (D), Gly (E) and Ser (F) at hypoxia at 72 h following 12 h of cGPG or cPG depletion, or BPTES or MSO treatment at normoxia. (G) Representative Seahorse, glycolytic stress test of control, BPTES and MSO treated cells at normoxia. Glycolysis, (H) glycolytic capacity, (I) relative to control at normoxia. (J) Representative Seahorse experiment of control, BPTES and MSO treated cells at hypoxia. Glycolysis (K) and glycolytic capacity (L) relative to control at hypoxia. (M) HK activity and (N) G6P concentration in BPTES, 2-DG and MSO treated cells relative to control at normoxia. (O) HK activity and G6P (P) concentration in BPTES, MSO and 2-DG treated cells relative to control at hypoxia. Data are mean ± SEM of three independent experiments. * P < 0.05, *** P < 0.001 compared with control.

Similar articles

Cited by

References

    1. Kedia-Mehta, N. and Finlay, D.K. (2019) Competition for nutrients and its role in controlling immune responses. Nat. Commun. 10, 2123 10.1038/s41467-019-10015-4 - DOI - PMC - PubMed
    1. Braun, R.D., Lanzen, J.L., Snyder, S.A. and Dewhirst, M.W. (2001) Comparison of tumor and normal tissue oxygen tension measurements using oxyLite or microelectrodes in rodents. Am. J. Physiol. Heart Circ. Physiol. 280, H2533–H2H44 10.1152/ajpheart.2001.280.6.H2533 - DOI - PubMed
    1. McKeown, S.R. (2014) Defining normoxia, physoxia and hypoxia in tumours-implications for treatment response. Br. J. Radiol. 87, 20130676 10.1259/bjr.20130676 - DOI - PMC - PubMed
    1. Jagannathan, L., Cuddapah, S. and Costa, M. (2016) Oxidative stress under ambient and physiological oxygen tension in tissue culture. Curr. Pharmacol. Rep. 2, 64–72 10.1007/s40495-016-0050-5 - DOI - PMC - PubMed
    1. Abbud, W., Habinowski, S., Zhang, J.Z., Kendrew, J., Elkairi, F.S., Kemp, B.E.et al. (2000) Stimulation of AMP-activated protein kinase (AMPK) is associated with enhancement of Glut1-mediated glucose transport. Arch. Biochem. Biophys. 380, 347–352 10.1006/abbi.2000.1935 - DOI - PubMed

Publication types