. 2022 Jan-Dec;14(1):2083905.
doi: 10.1080/19490976.2022.2083905.

Fecal carriage of vanB antibiotic resistance gene affects adipose tissue function under vancomycin use

Affiliations

Fecal carriage of vanB antibiotic resistance gene affects adipose tissue function under vancomycin use

Lars M M Vliex et al. Gut Microbes. 2022 Jan-Dec.

Abstract

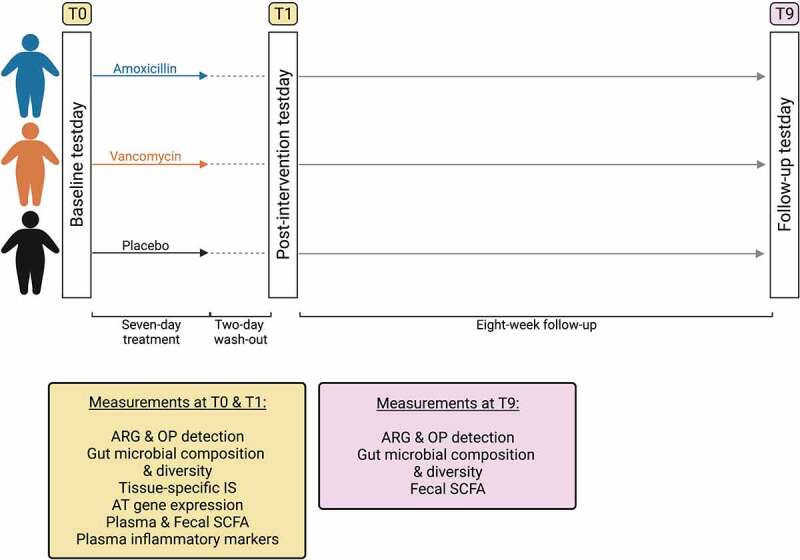
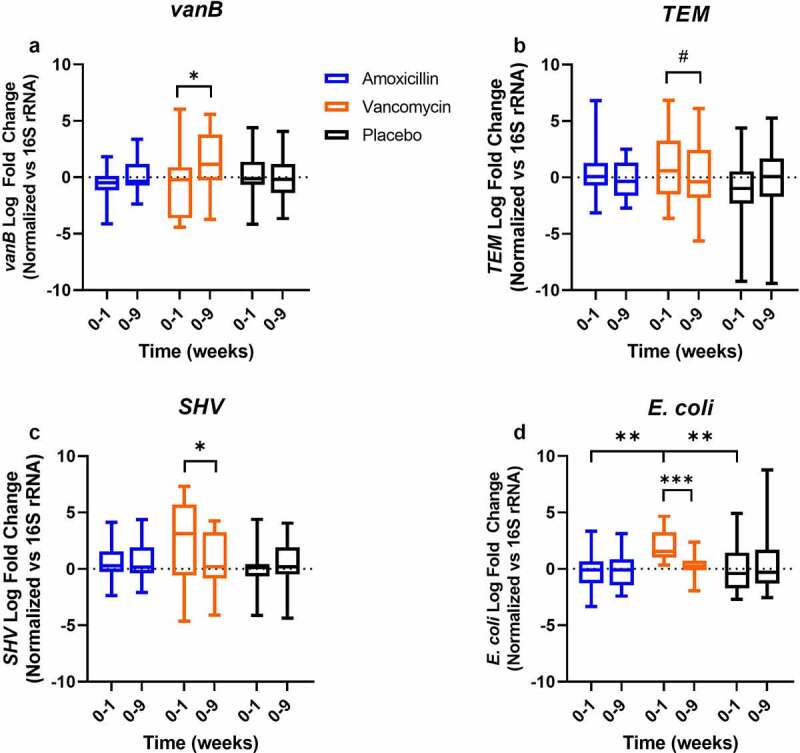
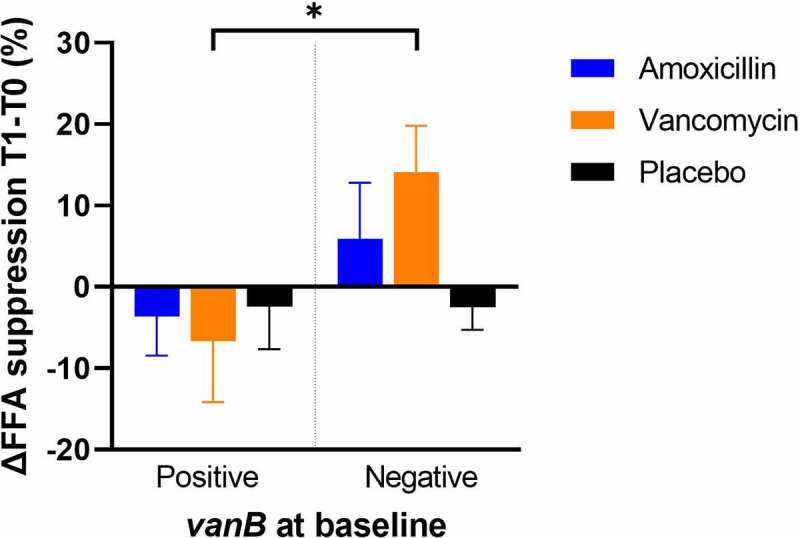
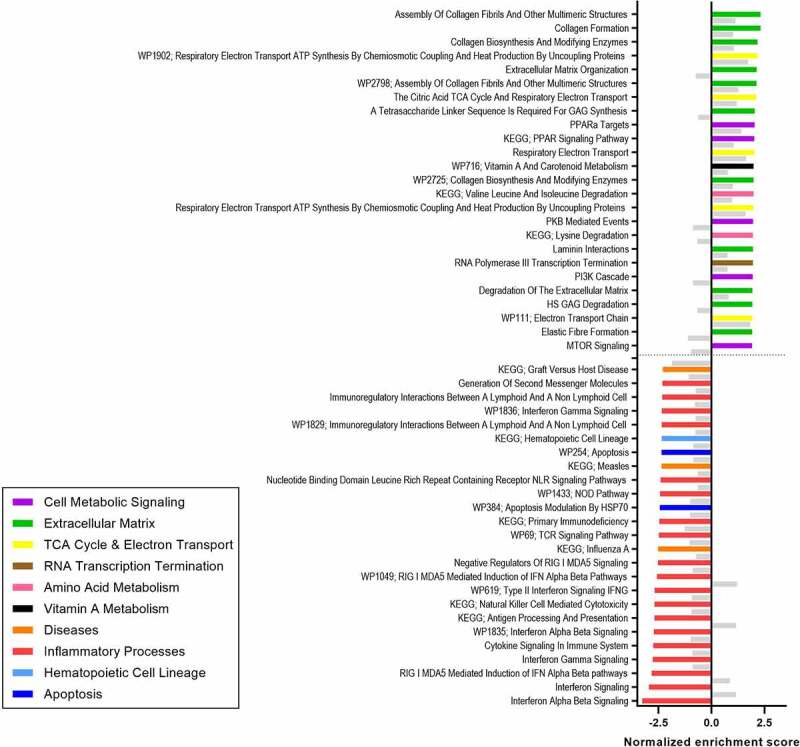
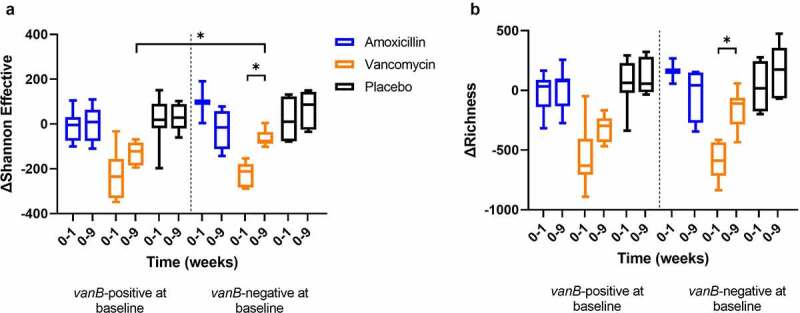
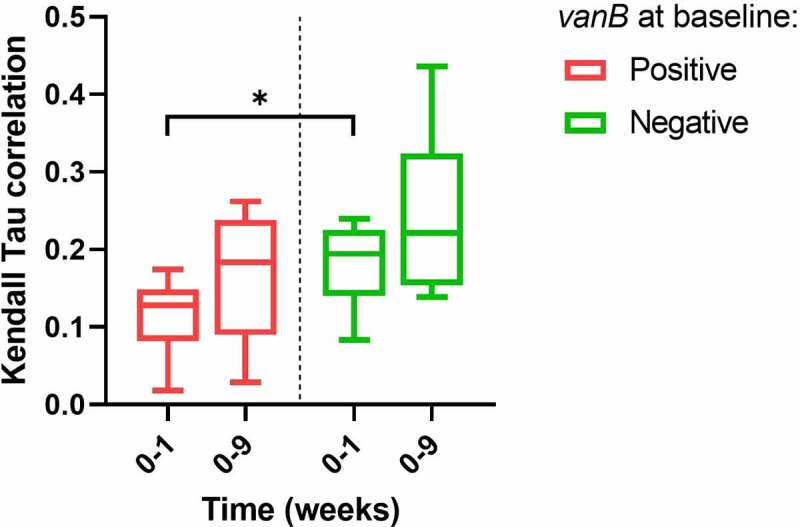
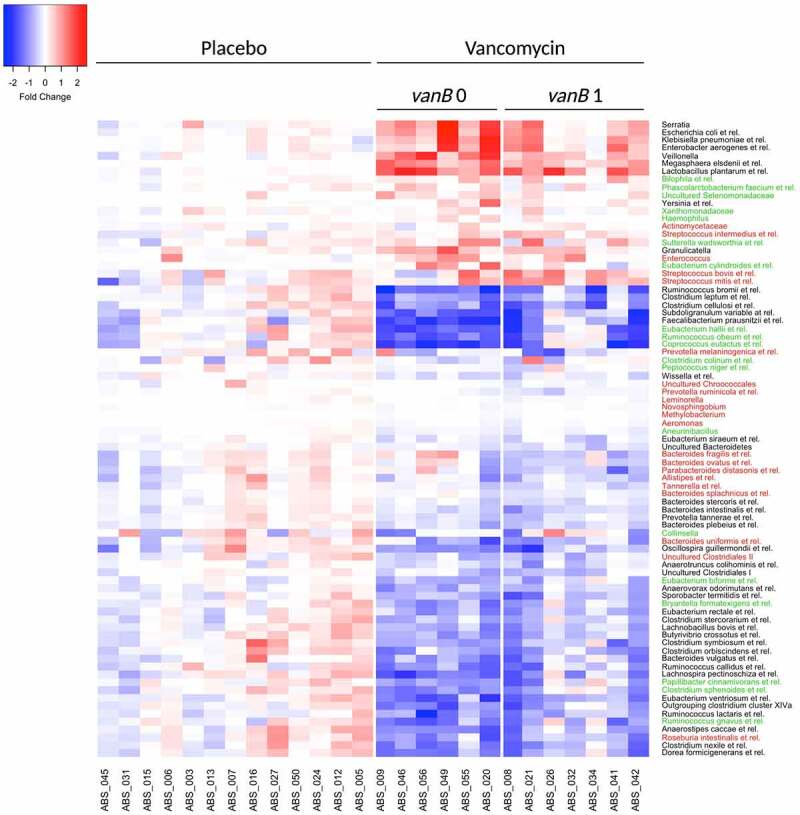
Detrimental consequences of antibiotic treatment may include long-lasting disruption of the gut microbiota. Previous studies found no negative effects of antibiotics on metabolic health, although individualized responses were observed. Here, we aimed to investigate the subject-specific response to vancomycin use in tissue-specific insulin sensitivity by stratifying individuals based on the presence of antibiotic resistance genes (ARGs) or opportunistic pathogens (OPs) in the baseline fecal microbiota. Quantitative Polymerase Chain Reaction (qPCR) was used to detect ARGs and OPs in DNA isolated from fecal samples of 56 males with overweight/obesity (Body Mass Index: 25-35 kg/m2) and impaired glucose metabolism (fasting plasma glucose ≥5.6 mmol/L and/or 2-hour glucose 7.8-11.1 mmol/L). A two-step hyperinsulinemic-euglycemic clamp was performed to determine tissue-specific insulin sensitivity. Abdominal subcutaneous adipose tissue (AT) gene expression was assessed using Affymetrix microarray. Gut microbial composition was determined using the Human Intestinal Tract Chip (HITChip) microarray. At baseline, the vancomycin resistance gene vanB was present in 60% of our population. In individuals that were vanB-negative at baseline, AT insulin sensitivity (insulin-mediated suppression of plasma free fatty acids) improved during vancomycin use, while it decreased among vanB-positive individuals (% change post versus baseline: 14.1 ± 5.6 vs. -6.7 ± 7.5% (p = .042)). The vancomycin-induced increase in AT insulin sensitivity was accompanied by downregulation of inflammatory pathways and enrichment of extracellular matrix remodeling pathways in AT. In the vanB-positive group, well-known vanB-carrying bacteria, Enterococcus and Streptococcus, expanded in the gut microbiome. In conclusion, microbiome composition and adipose tissue biology were differentially affected by vancomycin treatment based on fecal vanB carriage.

Keywords: Antibiotic resistance; adipose tissue; gut microbiome; insulin sensitivity; metabolic health; obesity; vanB; vancomycin.


Conflict of interest statement

No potential conflict of interest was reported by the author(s).

Figures

Figure 1.
Figure 1.
Study overview. Participants received a 7-day treatment with amoxicillin, vancomycin or placebo. Testdays took place at baseline (T0), after a 2-day wash-out after treatment cessation (T1) and after an 8-week follow-up (T9). Created with BioRender.com.
Figure 2.
Figure 2.
Log fold change of antibiotic resistance genes targets and E. coli after the 7-day amoxicillin, vancomycin or placebo treatment (week 0–1) and after 8-week follow-up (week 0–9). Data were normalized vs. 16S rRNA gene copy number (n = 17, 17, 19, 17, 18, 16 for Amoxicillin 0–1, 0–9, Vancomycin 0–1, 0–9, Placebo 0–1, 0–9, respectively). Differences within treatment groups were analyzed using paired t-test. Differences between treatment groups were analyzed using one-way ANOVA with post-hoc testing. *p < .05; #p < .1; **p < .001.
Figure 3.
Figure 3.
Changes in insulin-mediated suppression of FFA release (indicator of AT insulin sensitivity) after the 7-day amoxicillin, vancomycin or placebo treatment compared to baseline, with treatment groups split based on vanB presence at baseline (n = 12, 5, 9, 10, 11, 7 for amoxicillin vanB-positive, vanB-negative, vancomycin vanB-positive, vanB-negative, placebo vanB-positive, vanB-negative respectively). Differences within treatment groups between were analyzed using paired t-test. *p < .05.
Figure 4.
Figure 4.
Top 25 upregulated and downregulated pathways in subcutaneous AT after vancomycin treatment compared to baseline in the vanB-negative at baseline (vanB0) group (FDRq < 0.1) (n = 5). Non-significant enrichment of these pathways in the vanB-positive group is given as a reference in gray (n = 6).
Figure 5.
Figure 5.
Changes in α-diversity indices (Shannon Effective (a) and richness (b)) between baseline and after the 7-day treatment (week 0–1), and between baseline and 8-week follow-up (week 0–9) with treatment groups split by vanB presence at baseline (vanB-positive: n = 10, 9, 7, 7, 9, 6; vanB-negative: n = 2, 4, 6, 6, 4, 6 for Amoxicillin 0–1, 0–9, Vancomycin 0–1, 0–9, Placebo 0–1, 0–9, respectively). Differences between vanB-positive and negative groups were analyzed using independent t-test. Differences within vanB-positive and negative groups were analyzed using paired t-test. *p < .05.
Figure 6.
Figure 6.
Kendall Tau correlation of sample similarity between baseline and after 7-day vancomycin treatment (week 0–1) and baseline and 8-week follow-up (week 0–9) as a measure of β-diversity, with treatment groups split by vanB presence at baseline (n = 7, 6 for vanB-positive and negative, respectively). Differences between vanB-positive and vanB-negative groups were analyzed using independent t-test. *p < .05.
Figure 7.
Figure 7.
Heatmap of bacterial groups at genus-like level whose relative abundance was significantly different after 7-day vancomycin treatment compared to baseline, with treatment groups split by vanB presence at baseline (FDRq < 0.1). Wilcoxon SR test with Benjamini–Hochberg correction was used to analyze differences in bacterial groups over time. Color values show log10 fold changes compared to baseline. Color of genus-like groups indicates the subgroup in which the significant difference was found. Green: vanB0; red: vanB1; black: both groups.

References

    1. The review on antimicrobial resistance cbJON . Antimicrobial resistance: tackling a crisis for the health and wealth of nations. 2014. https://amr-review.org/sites/default/files/AMR%20Review%20Paper%20-%20Ta....
    1. Smith RA, M’Ikanatha NM, Read AF.. Antibiotic resistance: a primer and call to action. Health Commun. 2015;30(3):309–16. doi:10.1080/10410236.2014.943634. - DOI - PMC - PubMed
    1. Dethlefsen L, Relman DA.. Incomplete recovery and individualized responses of the human distal gut microbiota to repeated antibiotic perturbation. Proc Natl Acad Sci U S A. 2011;108(Suppl 1):4554–4561. doi:10.1073/pnas.1000087107. - DOI - PMC - PubMed
    1. Ferrer M, Méndez-García C, Rojo D, Barbas C, Moya A. Antibiotic use and microbiome function. Biochem Pharmacol. 2017;134:114–126. doi:10.1016/j.bcp.2016.09.007. - DOI - PubMed
    1. Schwartz DJ, Langdon AE, Dantas G. Understanding the impact of antibiotic perturbation on the human microbiome. Genome Med. 2020;12(1):82. doi:10.1186/s13073-020-00782-x. - DOI - PMC - PubMed

Publication types

LinkOut - more resources