

Gut microbiota in mucosa and feces of newly diagnosed, treatment-naïve adult inflammatory bowel disease and irritable bowel syndrome patients
- PMID: 35695669
- PMCID: PMC9196785
- DOI: 10.1080/19490976.2022.2083419
Gut microbiota in mucosa and feces of newly diagnosed, treatment-naïve adult inflammatory bowel disease and irritable bowel syndrome patients
Abstract
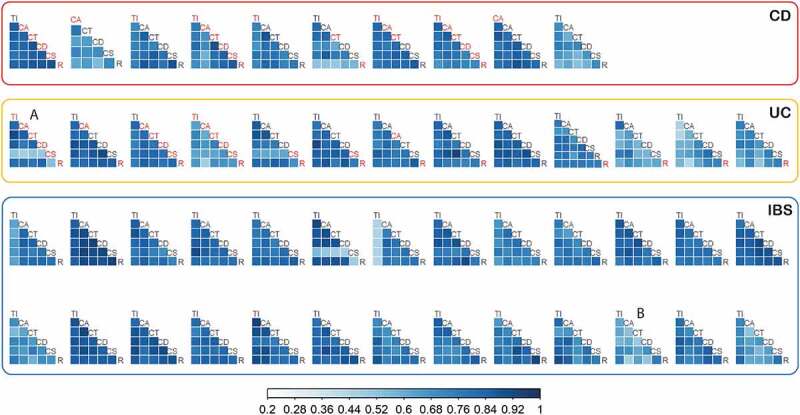
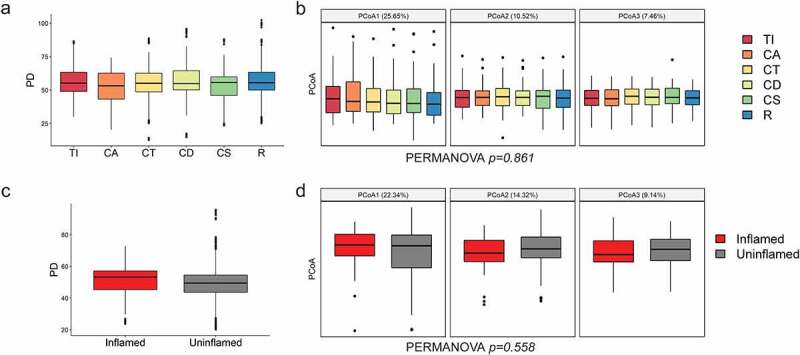
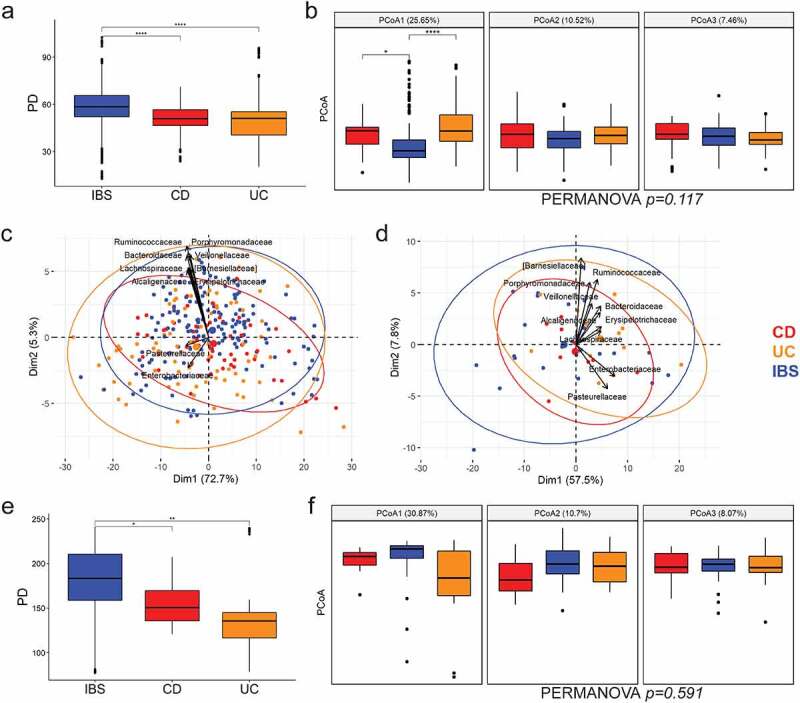
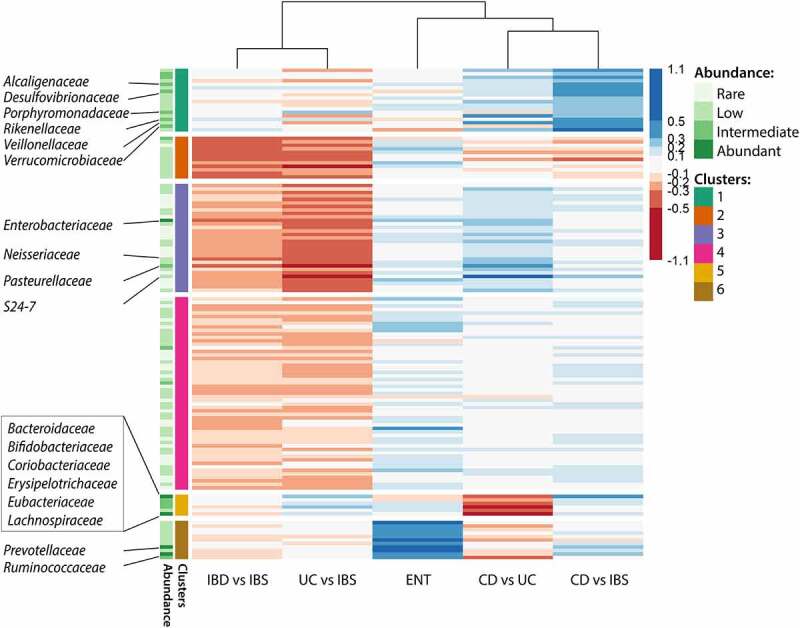
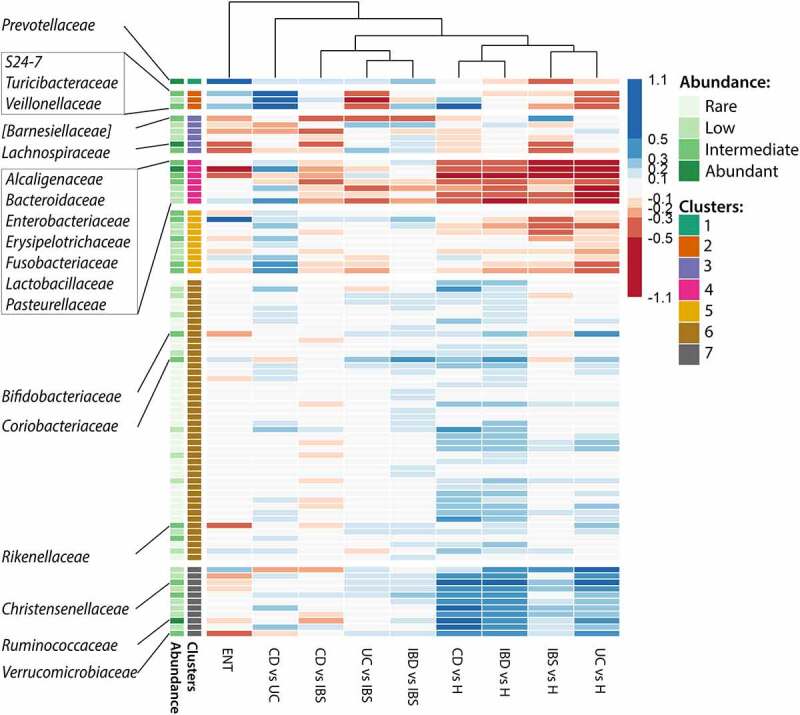
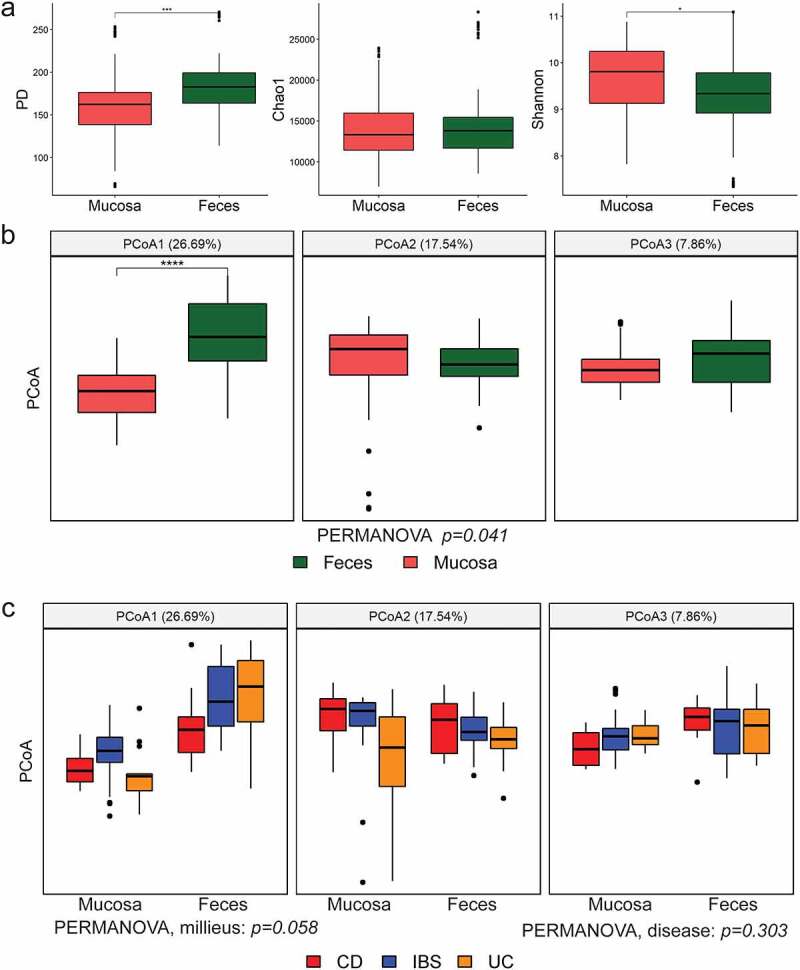
The knowledge on how gut microbes contribute to the inflammatory bowel disease (IBD) at the onset of disease is still scarce. We compared gut microbiota in newly diagnosed, treatment-naïve adult IBD (Crohn's disease (CD) and ulcerative colitis (UC)) to irritable bowel syndrome (IBS) patients and healthy group. Mucosal and fecal microbiota of 49 patients (13 UC, 10 CD, and 26 IBS) before treatment initiation, and fecal microbiota of 12 healthy subjects was characterized by 16S rRNA gene sequencing. Mucosa was sampled at six positions, from terminal ileum to rectum. We demonstrate that mucosal microbiota is spatially homogeneous, cannot be differentiated based on the local inflammation status and yet provides bacterial footprints superior to fecal in discriminating disease phenotypes. IBD groups showed decreased bacterial diversity in mucosa at all taxonomic levels compared to IBS. In CD and UC, Dialister was significantly increased, and expansion of Haemophilus and Propionibacterium characterized UC. Compared to healthy individuals, fecal microbiota of IBD and IBS patients had increased abundance of Proteobacteria, Enterobacteriaceae, in particular. Shift toward reduction of Adlercreutzia and butyrate-producing taxa was found in feces of IBD patients. Microbiota alterations detected in newly diagnosed treatment-naïve adult patients indicate that the microbiota changes are set and detectable at the disease onset and likely have a discerning role in IBD pathophysiology. Our results justify further investigation of the taxa discriminating between disease groups, such as H. parainfluenzae, R. gnavus, Turicibacteriaceae, Dialister, and Adlercreutzia as potential biomarkers of the disease.
Keywords: Crohn’s disease; Gut microbiota; fecal microbiota; gut mucosa; inflammatory bowel disease; irritable bowel syndrome; treatment-naïve patients; ulcerative colitis.
Conflict of interest statement
The authors report no conflict of interest.
Figures
Similar articles
-
Serum proteins and faecal microbiota as potential biomarkers in newly diagnosed, treatment-naïve inflammatory bowel disease and irritable bowel syndrome patients.J Mol Med (Berl). 2025 Aug;103(8):963-974. doi: 10.1007/s00109-025-02558-5. Epub 2025 Jun 7. J Mol Med (Berl). 2025. PMID: 40481885 Free PMC article.
-
Microbial Dynamics in Newly Diagnosed and Treatment Naïve IBD Patients in the Mediterranean.Inflamm Bowel Dis. 2023 Jul 5;29(7):1118-1132. doi: 10.1093/ibd/izad004. Inflamm Bowel Dis. 2023. PMID: 36735955 Free PMC article.
-
Fecal microbial dysbiosis in Chinese patients with inflammatory bowel disease.World J Gastroenterol. 2018 Apr 7;24(13):1464-1477. doi: 10.3748/wjg.v24.i13.1464. World J Gastroenterol. 2018. PMID: 29632427 Free PMC article.
-
Gut microbiome diversity in acute infective and chronic inflammatory gastrointestinal diseases in North India.J Gastroenterol. 2016 Jul;51(7):660-71. doi: 10.1007/s00535-016-1193-1. Epub 2016 Mar 19. J Gastroenterol. 2016. PMID: 26994772 Review.
-
Differences in Gut Microbiota in Patients With vs Without Inflammatory Bowel Diseases: A Systematic Review.Gastroenterology. 2020 Mar;158(4):930-946.e1. doi: 10.1053/j.gastro.2019.11.294. Epub 2019 Dec 5. Gastroenterology. 2020. PMID: 31812509
Cited by
-
Microbiome characterization of patients with Crohn disease and the use of fecal microbiota transplantation: A review.Medicine (Baltimore). 2025 Jan 24;104(4):e41262. doi: 10.1097/MD.0000000000041262. Medicine (Baltimore). 2025. PMID: 39854760 Free PMC article. Review.
-
Gut microbiota signatures in tissues of the colorectal polyp and normal colorectal mucosa, and faeces.Front Cell Infect Microbiol. 2023 Jan 10;12:1054808. doi: 10.3389/fcimb.2022.1054808. eCollection 2022. Front Cell Infect Microbiol. 2023. PMID: 36704106 Free PMC article. Clinical Trial.
-
Short-chain fatty acids ameliorate imiquimod-induced skin thickening and IL-17 levels and alter gut microbiota in mice: a metagenomic association analysis.Sci Rep. 2024 Jul 30;14(1):17495. doi: 10.1038/s41598-024-67325-x. Sci Rep. 2024. PMID: 39079980 Free PMC article.
-
The role of complex interactions between the intestinal flora and host in regulating intestinal homeostasis and inflammatory bowel disease.Front Microbiol. 2023 Jun 14;14:1188455. doi: 10.3389/fmicb.2023.1188455. eCollection 2023. Front Microbiol. 2023. PMID: 37389342 Free PMC article. Review.
-
Integrated Macrogenomics and Metabolomics Analysis of the Effect of Sea Cucumber Ovum Hydrolysates on Dextran Sodium Sulfate-Induced Colitis.Mar Drugs. 2025 Feb 7;23(2):73. doi: 10.3390/md23020073. Mar Drugs. 2025. PMID: 39997197 Free PMC article.
References
-
- Alatab S, Sepanlou SG, Ikuta K, Vahedi H, Bisignano C, Safiri S, Sadeghi A, Nixon MR, Abdoli A, Abolhassani H, et al. The global, regional, and national burden of inflammatory bowel disease in 195 countries and territories, 1990-2017: a systematic analysis for the global burden of disease study 2017. Lancet Gastroenterol Hepatol. 2020;5(1):17–21. doi:10.1016/S2468-1253(19)30333-4. - DOI - PMC - PubMed
Publication types
MeSH terms
Substances
LinkOut - more resources
Full Text Sources
Medical