. 2022 Aug 29;190(1):421-440.
doi: 10.1093/plphys/kiac286.

Evolution of the DEHYDRATION-RESPONSIVE ELEMENT-BINDING PROTEIN subfamily in green plants

Affiliations

Evolution of the DEHYDRATION-RESPONSIVE ELEMENT-BINDING PROTEIN subfamily in green plants

Jiapeng Han et al. Plant Physiol. .

Abstract

Adapting to unfavorable environments is a necessary step in plant terrestrialization and radiation. The dehydration-responsive element-binding (DREB) protein subfamily plays a pivotal role in plant abiotic stress regulation. However, relationships between the origin and expansion of the DREB subfamily and adaptive evolution of land plants are still being elucidated. Here, we constructed the evolutionary history of the DREB subfamily by compiling APETALA2/ethylene-responsive element-binding protein superfamily genes from 169 representative species of green plants. Through extensive phylogenetic analyses and comparative genomic analysis, our results revealed that the DREB subfamily diverged from the ethylene-responsive factor (ERF) subfamily in the common ancestor of Zygnemophyceae and Embryophyta during the colonization of land by plants, followed by expansions to form three different ancient archetypal genes in Zygnemophyceae species, designated as groups archetype-I, archetype-II/III, and archetype-IV. Four large-scale expansions paralleling the evolution of land plants led to the nine-subgroup divergence of group archetype-II/III in angiosperms, and five whole-genome duplications during Brassicaceae and Poaceae radiation shaped the diversity of subgroup IIb-1. We identified a Poaceae-specific gene in subgroup IIb-1, ERF014, remaining in a Poaceae-specific microsynteny block and co-evolving with a small heat shock protein cluster. Expression analyses demonstrated that heat acclimation may have driven the neofunctionalization of ERF014s in Pooideae by engaging in the conserved heat-responsive module in Poaceae. This study provides insights into lineage-specific expansion and neofunctionalization in the DREB subfamily, together with evolutionary information valuable for future functional studies of plant stress biology.


Figures

Figure 1
Figure 1
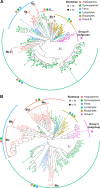
The DREB subfamily of extant angiosperms originated from three ancient archetypal genes. A, Phylogenetic analysis of the DREB subfamily members in 21 representative angiosperm genomes. B, Phylogenetic analysis of the DREB subfamily members in two angiosperm genomes (A. thaliana and B. distachyon) and three representative gymnosperm genomes (G. biloba, P. abies, and P. taeda). C, Phylogenetic analysis of the DREB subfamily members in two angiosperm genomes (A. thaliana and B. distachyon), two monilophyte genomes (A. filiculoides and S. cucullata), one lycophyte genome (S. moellendorffii), and three bryophyte genomes (M. polymorpha, P. patens, and S. fallax). D, Phylogenetic analysis of the ERF family in green plants with protein sequences from OneKP database. All ML trees were built using the AP2 domains (A) or the full-length protein sequences (B, C, and D) by FastTree with the JTT+CAT+G20 model. The RAV (related to ABI3/VP1) proteins were selected as outgroup for rooting the phylogenetic trees. The angiosperm proteins were used as control for grouping in (B) and (C). The solid dots on the internal nodes indicate bootstrap value ≥0.7 and the hollow dots indicate bootstrap value <0.7. Scale bars indicate substitutions per site. The colors of external nodes and background in (A) indicate different groups or subgroups of the DREB subfamily. The colors of external nodes in (B), (C), and (D) correspond to the taxonomy listed at the upper right corner of each figure. The background color of each clade in (B), (C), and (D) indicate different groups of the DREB subfamily (B, C) or the ERF subfamily (D). The symbolic points near clade labels in (D) correspond to the taxonomy at the upper right corner.
Figure 2
Figure 2
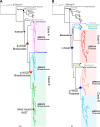
Groups II and III in the DREB subfamily have undergone the most numerous expansions during plant evolution. The full-length protein sequences from eleven representative land plants, including angiosperms (A. thaliana and B. distachyon), gymnosperms (G. biloba, P. abies, and P. taeda), ferns (A. filiculoides and S. cucullata), lycophyte (S. moellendorffii), and bryophytes (M. polymorpha, P. patens, and S. fallax), were used for the phylogenetic analyses of group II (A) and group III (B). The phylogenetic analyses were conducted using RAxML with the JTT + I + G4 model for 1,000 bootstrap replications. The group III proteins (A) and group II proteins (B) were selected as outgroup for rooting the phylogenetic trees, respectively. The solid dots on the internal nodes indicate bootstrap value ≥70 and the hollow dots indicate bootstrap value <70. Scale bars indicate substitutions per site. The branch colors and symbolic points near clade labels correspond to the taxonomy listed at the upper right corner of each figure. Support trees with other methods are displayed in Supplemental Figures S7 and S8 (for groups II and III, respectively).
Figure 3
Figure 3
Gene expansions shape the evolutionary diversification of subgroup IIb-1 in angiosperms. A, Phylogenetic analysis of subgroup IIb-1 in vascular plants. The ML tree was built by FastTree with the JTT + CAT + G20 model. The group IV proteins were selected as outgroup for rooting the phylogenetic tree. Bootstrap support values are shown. Scale bars indicate substitutions per site. The clades are labeled and collapsed into triangles according to the taxonomic information. Support trees with other methods are displayed in Supplemental Figure S9. B and C, The cascaded profile of syntenic gene pairs composed of subgroup IIb-1 genes in representative dicot (B) and monocot (C) genomes. The bracketed number after the species names indicates the gene number of subgroup IIb-1 identified in the corresponding species. The bracketed number below the taxonomic family names indicates the expansion patterns of subgroup IIb-1 genes in the corresponding family. The colored backgrounds indicate different taxonomic families. The two duplication types of the subgroup IIb-1 genes, “Segmental duplication or WGD” and “Dispersed duplication,” are represented by the red solid inverted triangles and the red hollow inverted triangles, respectively. The colored solid connected lines between different chromosomes across species indicate the syntenic gene pairs. The red dotted lines between different chromosomes within species indicate the WGDs from (D’Hont et al., 2012; Vanneste et al., 2014; Wang et al., 2014; Ming et al., 2015; Clark and Donoghue, 2018).
Figure 4
Figure 4
The DREB subgroup IIb-1 genes in Brassicaceae and Poaceae are gained and expanded as a result of polyploidy events. Phylogenetic analyses of subgroup IIb-1 members in Brassicaceae (A) and Poaceae (B) were conducted using ML and Bayesian methods with JTT + I + G4 model, respectively. The support trees with more detailed information are displayed in Supplemental Figures S12 and S14 (for Brassicaceae and Poaceae, respectively). Group IV proteins were used as outgroup (dotted lines in (A) and (B)). Scale bars indicate substitutions per site. The colors of branches with diamond symbol on external nodes correspond to the taxonomic information behind the symbols. The background colors and the corresponding branch colors correspond to the paralogous gene information of the clade. Stars indicate the polyploidy events during plant evolution.
Figure 5
Figure 5
ERF014 is located on a genomic segment highly conserved in Poaceae. A, Microsynteny of Poaceae-specific blocks containing ERF014s in representative Poaceae genomes and their common ancestral chromosomal segment. The gene locations on the chromosomes are not drawn to scale, with the actual length labeled at the end of each segment. Arrowheads indicate the genes and their directions corresponding to the infomation below (A). Syntenic genes among species are aligned and connected by vertical dashed lines. The chromosomal regions containing the sHSP gene cluster are marked with rectangles. B, The circos plot showing the conserved syntenic blocks haboring ERF014s in representative Poaceae genomes according to the synteny. The circle indicates the chromosomes of 14 representative Poaceae species where ERF014s are located. The colored bands linking chromosome pairs indicate syntenic blocks shared by the connected chromosomes. C, The evolutionary history of the ancestral ERF014-harboring chromosomal segment reconstructed according to the syntenic analysis in (A). The protochromosomes in ancestral genomes (ancestral monocot and APGs) and representative extant Poaceae genomes (Brachypodium, foxtail millet, rice, and sorghum) are represented with color bars with diamonds indicating the centromeric regions. Lines link the syntenic gene pairs among intra-genomes and inter-genomes. Triangles and rectangles indicate the locations of ERF014-containing chromosomal segments in Poaceae genomes.
Figure 6
Figure 6
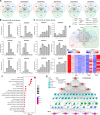
BdERF014 might engage in HSR by cross-talking with preexisting HSFAs-HSPs signaling pathways. A, Venn diagram showing overlap of the genes highly co-expressed with BdERF014, BdDREB2A, BdHSFA2a, BdHSFA2c, BdHSFA2e, BdHSFA6, respectively, under heat stress conditions. The numbers of genes in each region of the diagram are indicated. B and C, The expression analysis of BdERF014 and five typical heat-stress responsive TF genes under heat stress. After treated at 42°C, the leaves of the 2-week-old seedlings (B) and the two-month-old plants (C) were harvested for the expression analysis. β-Actin gene was used as the internal control for normalization. The relative expression levels were calculated by the 2−ΔCt method. The error bars indicate the SE of three independent biological replicates. D, Venn diagram showing overlap of the CCGs identified in (A). E, Heatmap revealing the expression of CCGs of BdERF014. F, The top 20 GO terms enriched in CCGs of BdERF014. G, Co-expression network of the CCGs of heat stress related TF genes in B. distachyon and rice. Diamond and circular nodes indicate TF genes of B. distachyon and rice. Nodes with other shapes correspond to the groups in the legend. Five rectangular boxes indicate the five HSP gene clusters, C1–C5, respectively. Brachypodium distachyon genes are above the dotted line and rice genes are below. Edge types correspond to the edge information in the legend.
Figure 7
Figure 7
Summary model for the origin, evolution, and neofunctionalization of the Pooideae ERF014s. The AP2 family and the common ancestor of the RAV and ERF families have evolved independently in green plants. The split of the RAV and ERF families occurred in the common ancestor of Zygnemophyceae and Embryophyta. The DREB subfamily originated from the ERF subfamily in the common ancestor of Zygnemophyceae after the divergence of Charophyceae and Zygnemophyceae. The ancestral archetypal DREB genes expanded into three archetypal groups of land plants in Zygnemophyceae. One of the three groups, group archetype-II/III, broadly expanded during land plant radiation, resulting in nine subgroups in angiosperms and one moss-specific group in mosses (left panel). Subgroup IIb-1 genes have evolved independently in the radiation of dicots and monocots. After three paleopolyploidy events in Brassicaceae and two in Poaceae, five parologs of subgroup IIb-1 in Brassicaceae, and three in Poaceae were detected in this study, respectively (middle panel). We infer that one duplicate of ERF014s was lost in each of the taxonomic families after the WGDs (dotted lines in middle panel). The orthologs of monocot ERF014s have undergone chromosomal rearrangements to form sHSP-ERF014 locus in Poaceae and neofunctionalized to response to heat stress in Pooideae (right panel). The time shown in the time scales is from Morris et al. (2018) and Wu et al. (2020).

Similar articles

Cited by

References

    1. Agarwal PK, Gupta K, Lopato S, Agarwal P (2017) Dehydration responsive element binding transcription factors and their applications for the engineering of stress tolerance. J Exp Bot 68: 2135–2148 - PubMed
    1. Alaux M, Rogers J, Letellier T, Flores R, Alfama F, Pommier C, Mohellibi N, Durand S, Kimmel E, Michotey C, et al. (2018) Linking the International Wheat Genome Sequencing Consortium bread wheat reference genome sequence to wheat genetic and phenomic data. Genome Biol 19: 111. - PMC - PubMed
    1. Allen MD, Yamasaki K, Ohme-Takagi M, Tateno M, Suzuki M (1998) A novel mode of DNA recognition by a beta-sheet revealed by the solution structure of the GCC-box binding domain in complex with DNA. EMBO J 17: 5484–5496 - PMC - PubMed
    1. Amalraj A, Luang S, Kumar MY, Sornaraj P, Eini O, Kovalchuk N, Bazanova N, Li Y, Yang NN, Eliby S, et al. (2016) Change of function of the wheat stress-responsive transcriptional repressor TaRAP2.1L by repressor motif modification. Plant Biotechnol J 14: 820–832 - PMC - PubMed
    1. Appels R, Eversole K, Feuillet C, Keller B, Rogers J, Stein N, Pozniak CJ, Stein N, Choulet F, Distelfeld A, et al. (2018) Shifting the limits in wheat research and breeding using a fully annotated reference genome. Science 361: eaar7191. - PubMed

Publication types