. 2022 Aug 15;28(16):3509-3525.
doi: 10.1158/1078-0432.CCR-22-0851.

Assessment of Androgen Receptor Splice Variant-7 as a Biomarker of Clinical Response in Castration-Sensitive Prostate Cancer

Affiliations

Assessment of Androgen Receptor Splice Variant-7 as a Biomarker of Clinical Response in Castration-Sensitive Prostate Cancer

Adam G Sowalsky et al. Clin Cancer Res. .

Abstract

Purpose: Therapies targeting the androgen receptor (AR) have improved the outcome for patients with castration-sensitive prostate cancer (CSPC). Expression of the constitutively active AR splice variant-7 (AR-V7) has shown clinical utility as a predictive biomarker of AR-targeted therapy resistance in castration-resistant prostate cancer (CRPC), but its importance in CSPC remains understudied.

Experimental design: We assessed different approaches to quantify AR-V7 mRNA and protein in prostate cancer cell lines, patient-derived xenograft (PDX) models, publicly available cohorts, and independent institutional clinical cohorts, to identify reliable approaches for detecting AR-V7 mRNA and protein and its association with clinical outcome.

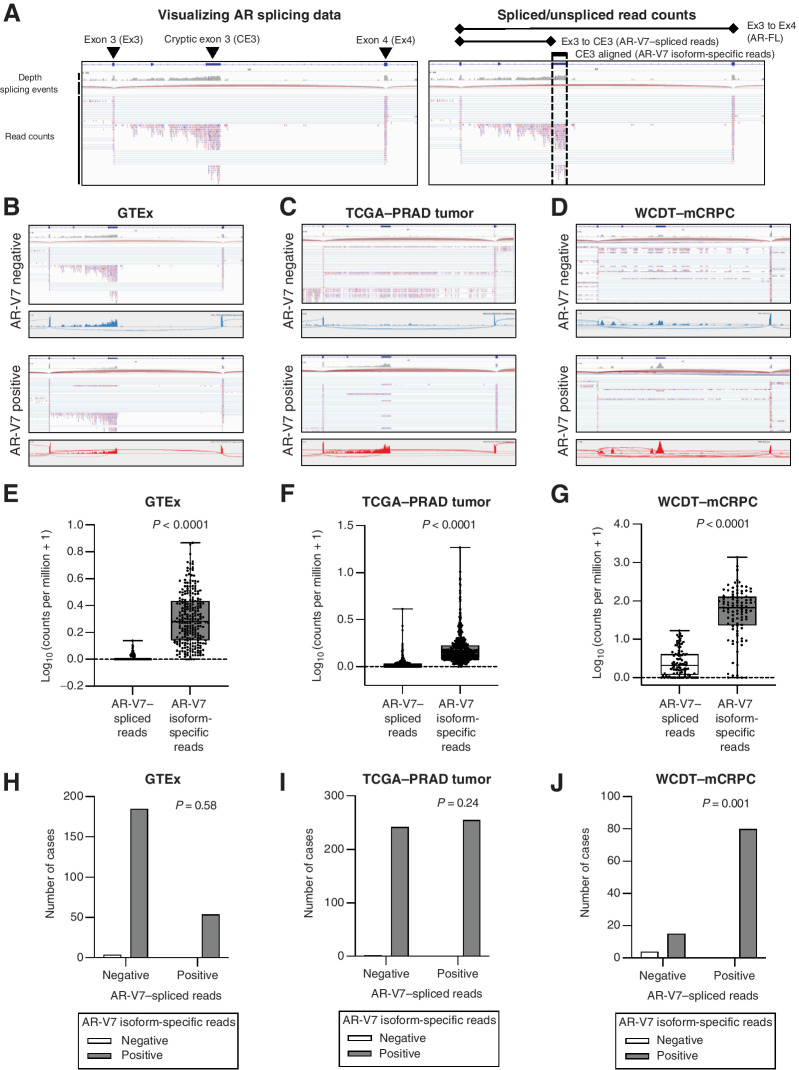
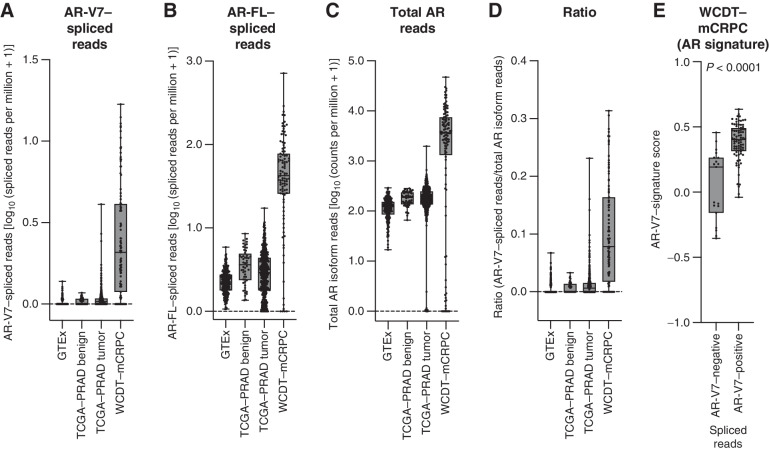
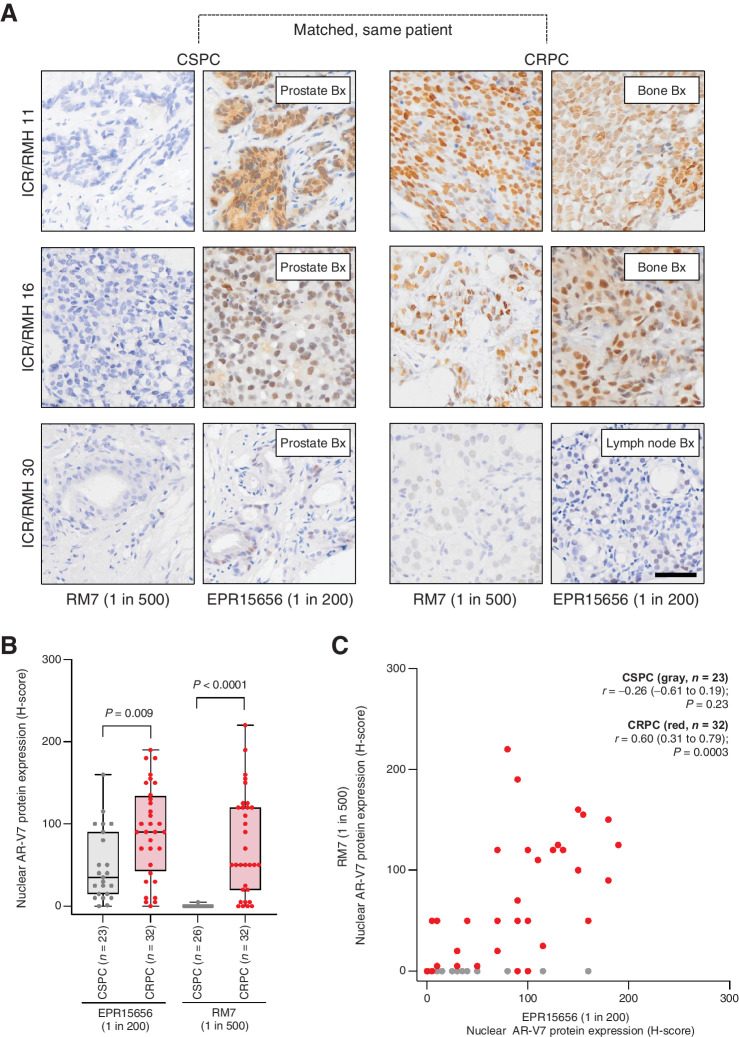
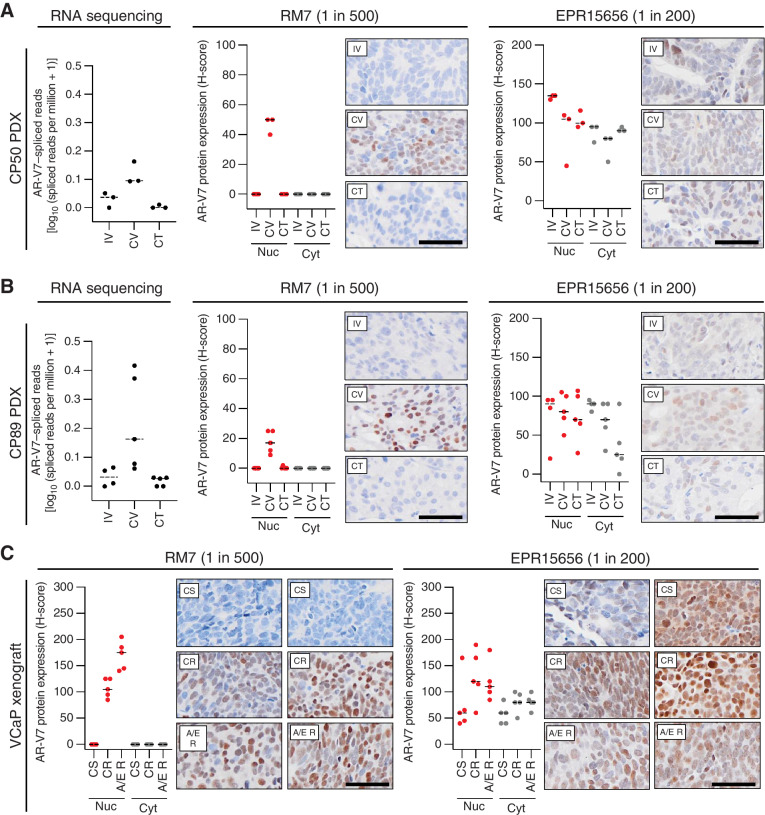
Results: In CSPC and CRPC cohorts, AR-V7 mRNA was much less abundant when detected using reads across splice boundaries than when considering isoform-specific exonic reads. The RM7 AR-V7 antibody had increased sensitivity and specificity for AR-V7 protein detection by immunohistochemistry (IHC) in CRPC cohorts but rarely identified AR-V7 protein reactivity in CSPC cohorts, when compared with the EPR15656 AR-V7 antibody. Using multiple CRPC PDX models, we demonstrated that AR-V7 expression was exquisitely sensitive to hormonal manipulation. In CSPC institutional cohorts, AR-V7 protein quantification by either assay was associated neither with time to development of castration resistance nor with overall survival, and intense neoadjuvant androgen-deprivation therapy did not lead to significant AR-V7 mRNA or staining following treatment. Neither pre- nor posttreatment AR-V7 levels were associated with volumes of residual disease after therapy.

Conclusions: This study demonstrates that further analytical validation and clinical qualification are required before AR-V7 can be considered for clinical use in CSPC as a predictive biomarker.


Figures

Figure 1. Comparison of AR-V7 quantification in publicly available datasets. A, Screenshot of the Integrative Genomics Viewer (IGV) annotated with the information contained in each track with respect to specific regions of the AR locus (left) and splice junctions (right). B–D, Screenshots (as in A) and sashimi plots for cases from genotype–tissue expression (GTEx, B), The Cancer Genome Atlas-prostate adenocarcinoma tumor (TCGA–PRAD tumor, C) and West Coast Dream Team-metastatic CRPC (WCDT–mCRPC, D) cohorts. Representative cases of AR-V7–negative (blue) and AR-V7–positive (red) cases are shown as determined by the presence of splicing between exon 3 and cryptic exon 3 as shown in the red sashimi plots. E–G, For each case in the GTEx (n = 243, E), TCGA–PRAD tumor (n = 499, F), and WCDT–mCRPC (n = 99, G) cohorts, the number of read counts corresponding to AR-V7–spliced reads (between exon 3 and cryptic exon 3) and AR-V7 isoform–specific reads (aligning to cryptic exon 3, dashed vertical lines in A) are shown. Spliced reads data are shown as log10 (spliced reads per million + 1); isoform-specific read data are shown as log10 (read counts per million + 1). Statistical significance between differences was measured by Mann–Whitney tests. Box shows median and interquartile range; bars show minimum and maximum values. H–J, The number of cases showing concordance between the presence of AR-V7 isoform-specific reads and the presence of AR-V7–spliced reads is shown for GTEx (H), TCGA-PRAD tumor (I), and WCDT–mCRPC (J) cohorts. Statistical significance between associations was measured by two-sided Fisher exact tests.
Figure 1.
Comparison of AR-V7 quantification in publicly available datasets. A, Screenshot of the Integrative Genomics Viewer (IGV) annotated with the information contained in each track with respect to specific regions of the AR locus (left) and splice junctions (right). B–D, Screenshots (as in A) and sashimi plots for cases from genotype–tissue expression (GTEx; B), The Cancer Genome Atlas–prostate adenocarcinoma tumor (TCGA–PRAD tumor; C) and West Coast Dream Team–metastatic CRPC (WCDT–mCRPC; D) cohorts. Representative cases of AR-V7–negative (blue) and AR-V7–positive (red) cases are shown as determined by the presence of splicing between exon 3 and cryptic exon 3 as shown in the red sashimi plots. E–G, For each case in the GTEx (n = 243; E), TCGA–PRAD tumor (n = 499; F), and WCDT–mCRPC (n = 99; G) cohorts, the number of read counts corresponding to AR-V7–spliced reads (between exon 3 and cryptic exon 3) and AR-V7 isoform–specific reads (aligning to cryptic exon 3, dashed vertical lines in A) are shown. Spliced reads data are shown as log10 (spliced reads per million + 1); isoform-specific read data are shown as log10 (read counts per million + 1). Statistical significance between differences was measured by Mann–Whitney tests. Box shows median and interquartile range; bars show minimum and maximum values. H–J, The number of cases showing concordance between the presence of AR-V7 isoform-specific reads and the presence of AR-V7–spliced reads is shown for GTEx (H), TCGA-PRAD tumor (I), and WCDT–mCRPC (J) cohorts. Statistical significance between associations was measured by two-sided Fisher exact tests.
Figure 2. Enumeration of AR isoforms and AR-V7 signature scores in publicly available data sets. A–D, The number of reads corresponding to AR-V7 (splicing between exon 3 and cryptic exon 3, A), full-length AR (AR-FL, splicing between exon 3 and exon 4, B), mapped to the AR locus (C), and AR-V7/AR-FL read count ratio (D) are shown for the GTEx (n = 243), TCGA–PRAD benign (n = 52), TCGA–PRAD tumor (n = 499), and WCDT–mCRPC (n = 99) cohorts. Spliced read data (A–B) are shown as log10 (spliced reads per million + 1) and isoform-specific read data (C) are shown as log10 (read counts per million + 1). Box shows median and interquartile range; bars show minimum and maximum values. E, AR-V7–signature score for AR-V7–negative and –positive patients determined by AR-V7–spliced reads in the WCDT–mCRPC cohort. Box shows median and interquartile range; bars show minimum and maximum values. Statistical significance between differences was measured by the Welch t test.
Figure 2.
Enumeration of AR isoforms and AR-V7 signature scores in publicly available data sets. A–D, The number of reads corresponding to AR-V7 (splicing between exon 3 and cryptic exon 3; A), full-length AR (AR-FL; splicing between exon 3 and exon 4; B), mapped to the AR locus (C), and AR-V7/AR-FL read count ratio (D) are shown for the GTEx (n = 243), TCGA–PRAD benign (n = 52), TCGA–PRAD tumor (n = 499), and WCDT–mCRPC (n = 99) cohorts. Spliced read data (A–B) are shown as log10 (spliced reads per million + 1), and isoform-specific read data (C) are shown as log10 (read counts per million + 1). Box shows median and interquartile range; bars show minimum and maximum values. E, AR-V7–signature score for AR-V7–negative and –positive patients determined by AR-V7–spliced reads in the WCDT–mCRPC cohort. Box shows median and interquartile range; bars show minimum and maximum values. Statistical significance between differences was measured by the Welch t test.
Figure 3. AR-V7 protein quantification by two IHC assays in matched, same patient, castration-sensitive and castration-resistant prostate cancer tissue biopsies. A, Representative micrographs of AR-V7 protein detection by IHC using EPR15656 (Abcam, 1 in 200) and RM7 (RevMAb, 1 in 500) antibodies in three patients with matched CSPC and CRPC tissue biopsies from the Institute of Cancer Research/Royal Marsden Hospital (ICR/RMH) matched CSPC and CRPC cohort (scale bar: 50 μm). Prostate, lymph node, and bone biopsies (Bx) are shown. B, Nuclear AR-V7 staining (H-score) using EPR15656 (23 CSPC and 32 CRPC) and RM7 (26 CSPC and 32 CRPC) antibodies was determined. Box shows median and interquartile range; bars show minimum and maximum values. Statistical significance between differences was measured by Mann–Whitney tests. C, Nuclear AR-V7 staining (H-score) for EPR15656 and RM7 in the same 23 CSPC (gray) and 32 CRPC (red) biopsies is shown. Statistical significance between correlations was determined by Spearman rank.
Figure 3.
AR-V7 protein quantification by two IHC assays in matched, same patient, castration-sensitive and castration-resistant prostate cancer tissue biopsies. A, Representative micrographs of AR-V7 protein detection by IHC using EPR15656 (Abcam, 1 in 200) and RM7 (RevMAb, 1 in 500) antibodies in three patients with matched CSPC and CRPC tissue biopsies from the Institute of Cancer Research/Royal Marsden Hospital (ICR/RMH) matched CSPC and CRPC cohort (scale bar: 50 μm). Prostate, lymph node, and bone biopsies (Bx) are shown. B, Nuclear AR-V7 staining (H-score) using EPR15656 (23 CSPC and 32 CRPC) and RM7 (26 CSPC and 32 CRPC) antibodies was determined. Box shows median and interquartile range; bars show minimum and maximum values. Statistical significance between differences was measured by Mann–Whitney tests. C, Nuclear AR-V7 staining (H-score) for EPR15656 and RM7 in the same 23 CSPC (gray) and 32 CRPC (red) biopsies is shown. Statistical significance between correlations was determined by Spearman rank.
Figure 4. Comparison of AR-V7 IHC assays, and AR-V7–spliced reads from RNA analysis, in the CP50 and CP89 prostate cancer PDX, and VCaP mouse xenograft, in response to hormonal manipulation. A, For CP50 prostate cancer PDX; intact CP50 was treated with vehicle for 7 days (i.v., n = 3) and its castrate subline CP50C was treated with either vehicle (CV, n = 3) or 20 mg/kg testosterone daily (CT, n = 3) for 7 days and RNA-seq and IHC was performed. AR-V7–spliced reads (between exon 3 and cryptic exon 3) were determined from RNA-seq analysis. Spliced reads data are shown as log10 (spliced reads per million + 1). Representative micrographs of AR-V7 protein detection by IHC using EPR15656 (Abcam, 1 in 200) and RM7 (RevMAb, 1 in 500) antibodies are shown (scale bar: 50 μm). Nuclear and cytoplasmic AR-V7 staining (H-score) was determined. Line represents the median H-score. B, For CP89 prostate cancer PDX, intact CP89 was treated with vehicle for 7 days (i.v., n = 4) and its castrate subline CP89C was treated with either vehicle (CV, n = 5) or 20 mg/kg testosterone daily (CT, n = 5) for 7 days and RNA-seq and IHC was performed. AR-V7 spliced reads (between exon 3 and cryptic exon 3) were determined from RNA-seq analysis. Spliced reads data are shown as log10 (spliced reads per million + 1). Representative micrographs of AR-V7 protein detection by IHC using EPR15656 (Abcam, 1 in 200) and RM7 (RevMAb, 1 in 500) antibodies are shown (scale bar: 50 μm). Nuclear and cytoplasmic AR-V7 staining (H-score) was determined. Line represents the median H-score. C, For VCaP mouse xenografts; samples were taken from tumors that were castration-sensitive (CS, n = 5), as they progressed to CR (n = 5), and as resistance to abiraterone and enzalutamide developed (A/E R, n = 5), and IHC was performed. Representative micrographs of AR-V7 protein detection by IHC using EPR15656 (Abcam, 1 in 200) and RM7 (RevMAb, 1 in 500) antibodies are shown (scale bar: 50 μm). Nuclear and cytoplasmic AR-V7 staining (H-score) was determined. Line represents the median H-score.
Figure 4.
Comparison of AR-V7 IHC assays, and AR-V7–spliced reads from RNA analysis, in the CP50 and CP89 prostate cancer PDX, and VCaP mouse xenograft, in response to hormonal manipulation. A, For CP50 prostate cancer PDX: intact CP50 was treated with vehicle for 7 days (IV, n = 3) and its castrate subline CP50C was treated with either vehicle (CV, n = 3) or 20 mg/kg testosterone daily (CT, n = 3) for 7 days and RNA-seq and IHC was performed. AR-V7–spliced reads (between exon 3 and cryptic exon 3) were determined from RNA-seq analysis. Spliced reads data are shown as log10 (spliced reads per million + 1). Representative micrographs of AR-V7 protein detection by IHC using EPR15656 (Abcam, 1 in 200) and RM7 (RevMAb, 1 in 500) antibodies are shown (scale bar: 50 μm). Nuclear and cytoplasmic AR-V7 staining (H-score) was determined. Line represents the median H-score. B, For CP89 prostate cancer PDX: intact CP89 was treated with vehicle for 7 days (IV, n = 4) and its castrate subline CP89C was treated with either vehicle (CV, n = 5) or 20 mg/kg testosterone daily (CT, n = 5) for 7 days and RNA-seq and IHC was performed. AR-V7 spliced reads (between exon 3 and cryptic exon 3) were determined from RNA-seq analysis. Spliced reads data are shown as log10 (spliced reads per million + 1). Representative micrographs of AR-V7 protein detection by IHC using EPR15656 (Abcam, 1 in 200) and RM7 (RevMAb, 1 in 500) antibodies are shown (scale bar: 50 μm). Nuclear and cytoplasmic AR-V7 staining (H-score) was determined. Line represents the median H-score. C, For VCaP mouse xenografts; samples were taken from tumors that were castration sensitive (CS; n = 5), as they progressed to castration resistant (CR; n = 5), and as resistance to abiraterone and enzalutamide developed (A/E R, n = 5), and IHC was performed. Representative micrographs of AR-V7 protein detection by IHC using EPR15656 (Abcam, 1 in 200) and RM7 (RevMAb, 1 in 500) antibodies are shown (scale bar: 50 μm). Nuclear and cytoplasmic AR-V7 staining (H-score) was determined. Line represents the median H-score.
Figure 5. Comparison of AR-V7 IHC assays between laboratories, and with AR-V7 spliced reads from RNA analysis, in the LuCaP series of prostate cancer PDX models. A, For each model in the LuCaP series, the number of read counts corresponding to AR-V7 spliced reads (between exon 3 and cryptic exon 3) was determined from RNA-seq analysis. Spliced reads data are shown as log10 (spliced reads per million + 1). Box shows mean and bars show minimum and maximum values. AR-V7 signature score shown for AR-V7–negative and –positive models determined by AR-V7–spliced reads. Box shows median and interquartile range; bars show minimum and maximum values. Statistical significance between differences were measured by the Welch t test. B–C, For each model in the LuCaP series nuclear AR-V7 staining (H-score) was determined by IHC using RM7 antibody and was performed at the ICR (1 in 500, B) and UW (1 in 50, C). Box shows mean and bars show minimum and maximum values. AR-V7 signature score shown for AR-V7–negative and positive models determined by ICR and UW RM7 IHC. Box shows median and interquartile range; bars show minimum and maximum values. Statistical significance between differences were measured by the Welch t test. D–E, The association between mean AR-V7–spliced reads and mean nuclear AR-V7 staining determined at ICR (D) and UW (E) is shown. Statistical significance between correlations was determined by Spearman rank. F, The association between mean nuclear AR-V7 staining determined at ICR and UW is shown. Statistical significance between correlations was determined by Spearman rank.
Figure 5.
Comparison of AR-V7 IHC assays between laboratories, and with AR-V7 spliced reads from RNA analysis, in the LuCaP series of prostate cancer PDX models. A, For each model in the LuCaP series, the number of read counts corresponding to AR-V7 spliced reads (between exon 3 and cryptic exon 3) was determined from RNA-seq analysis. Spliced reads data are shown as log10 (spliced reads per million + 1). Box shows mean and bars show minimum and maximum values. AR-V7 signature score shown for AR-V7–negative and –positive models determined by AR-V7–spliced reads. Box shows median and interquartile range; bars show minimum and maximum values. Statistical significance between differences were measured by the Welch t test. B–C, For each model in the LuCaP series nuclear AR-V7 staining (H-score) was determined by IHC using RM7 antibody and was performed at the ICR (1 in 500; B) and UW (1 in 50; C). Box shows mean and bars show minimum and maximum values. AR-V7 signature score shown for AR-V7–negative and –positive models determined by ICR and UW RM7 IHC. Box shows median and interquartile range; bars show minimum and maximum values. Statistical significance between differences were measured by the Welch t test. D–E, The association between mean AR-V7–spliced reads and mean nuclear AR-V7 staining determined at ICR (D) and UW (E) is shown. Statistical significance between correlations was determined by Spearman rank. F, The association between mean nuclear AR-V7 staining determined at ICR and UW is shown. Statistical significance between correlations was determined by Spearman rank.
Figure 6. AR-V7 protein quantification by two IHC assays in diagnostic biopsies of prostate cancer patients who received systemic therapy alone. A, Representative micrographs of AR-V7 protein detection by IHC using EPR15656 (Abcam, 1 in 200) and RM7 (RevMAb, 1 in 50) antibodies in three diagnostic CSPC prostate biopsies from patients in the Institute of Cancer Research/Royal Marsden Hospital (ICR/RMH) primary advanced cohort (scale bar: 50 μm). B, Nuclear and cytoplasmic AR-V7 staining (H-score) using EPR15656 (Abcam, 1 in 200, red circles) and RM7 (RevMAb, 1 in 50, gray circles) antibodies was determined. Box shows median and interquartile range; bars show minimum and maximum values. C, Association between nuclear AR-V7 staining (H-score) using EPR15656 (EPR15656, 1 in 200, red circles) and RM7 (RevMAb, 1 in 50, gray circles) antibodies and time to CRPC, months) from diagnosis is shown. Statistical significance between correlations were determined by Spearman rank. D, Association between nuclear AR-V7 staining (H-score) using EPR15656 (EPR15656, 1 in 200, red circles) and RM7 (RevMAb, 1 in 50, gray circles) antibodies and overall survival (months) from diagnosis is shown. Three patients remain alive at last follow-up (black circle outline). Statistical significance between correlations was determined by Spearman rank.
Figure 6.
AR-V7 protein quantification by two IHC assays in diagnostic biopsies of prostate cancer patients who received systemic therapy alone. A, Representative micrographs of AR-V7 protein detection by IHC using EPR15656 (Abcam, 1 in 200) and RM7 (RevMAb, 1 in 50) antibodies in three diagnostic CSPC prostate biopsies from patients in the Institute of Cancer Research/Royal Marsden Hospital (ICR/RMH) primary advanced cohort (scale bar: 50 μm). B, Nuclear and cytoplasmic AR-V7 staining (H-score) using EPR15656 (Abcam, 1 in 200, red circles) and RM7 (RevMAb, 1 in 50, gray circles) antibodies was determined. Box shows median and interquartile range; bars show minimum and maximum values. C, Association between nuclear AR-V7 staining (H-score) using EPR15656 (EPR15656, 1 in 200, red circles) and RM7 (RevMAb, 1 in 50, gray circles) antibodies and time to CRPC (months) from diagnosis is shown. Statistical significance between correlations were determined by Spearman rank. D, Association between nuclear AR-V7 staining (H-score) using EPR15656 (EPR15656, 1 in 200, red circles) and RM7 (RevMAb, 1 in 50, gray circles) antibodies and overall survival (months) from diagnosis is shown. Three patients remain alive at last follow-up (black circle outline). Statistical significance between correlations was determined by Spearman rank.
Figure 7. AR-V7 quantification in prostate cancer patients who had primary radical prostatectomy or were treated with neoadjuvant ADT plus enzalutamide for locally advanced disease prior to prostatectomy. A, AR-V7–spliced reads [depicted as log10 (spliced reads per million + 1)] from 84 cases treated by radical prostatectomy. The red dot indicates the only case that received short-course neoadjuvant bicalutamide. Box shows median and interquartile range; bars show minimum and maximum values. Statistical significance between differences were measured by the Mann–Whitney test. B, AR-V7–spliced reads [depicted as log10 (spliced reads per million + 1)] from 37 cases treated with six months of neoadjuvant ADT plus enzalutamide prior to radical prostatectomy. Left, comparison of AR-V7 spliced reads from baseline biopsy and posttreatment. Right, stratification of baseline biopsies based on pathologic outcome of responder (n = 15) or incomplete/nonresponder (n = 22). C, Left, whole-slide imaging of a radical prostatectomy specimen from a representative incomplete/nonresponder; region of residual tumor is marked by a dotted line. Serial whole-slide section of AR-V7 staining using the RM7 (RevMAb, 1 in 100) antibody to identify regions of residual tumors that are AR-V7 positive (small foci marked in red) or AR-V7 negative (larger region marked in blue). Right, representative micrographs of AR-V7 and AR N-terminal (AR-NTD) IHC of residual tumor from serial sections (scale bar: 200 μm). D, Distribution of H-scores for AR-V7 IHC from posttreatment specimens with residual tumor (n = 34). E, Distribution of residual cancer volumes for each patient receiving six months of neoadjuvant ADT plus enzalutamide prior to radical prostatectomy. Data, log10 (cm3 + 1). F, Overlay of data presented in B, D, and E, displayed by patient with all data available (n = 34). AR-V7–spliced read abundance and residual cancer volume are plotted on the left Y axis, and mean H-score for nuclear AR-V7 staining is plotted on the right Y axis.
Figure 7.
AR-V7 quantification in prostate cancer patients who had primary radical prostatectomy or were treated with neoadjuvant ADT plus enzalutamide for locally advanced disease prior to prostatectomy. A, AR-V7–spliced reads [depicted as log10 (spliced reads per million + 1)] from 84 cases treated by radical prostatectomy. The red dot indicates the only case that received short-course neoadjuvant bicalutamide. Box shows median and interquartile range; bars show minimum and maximum values. Statistical significance between differences were measured by the Mann–Whitney test. B, AR-V7–spliced reads [depicted as log10 (spliced reads per million + 1)] from 37 cases treated with six months of neoadjuvant ADT plus enzalutamide prior to radical prostatectomy. Left, comparison of AR-V7–spliced reads from baseline biopsy and posttreatment. Right, stratification of baseline biopsies based on pathologic outcome of responder (n = 15) or incomplete/nonresponder (n = 22). C, Left, whole-slide imaging of a radical prostatectomy specimen from a representative incomplete/nonresponder; region of residual tumor is marked by a dotted line. Serial whole-slide section of AR-V7 staining using the RM7 (RevMAb, 1 in 100) antibody to identify regions of residual tumors that are AR-V7 positive (small foci marked in red) or AR-V7 negative (larger region marked in blue). Right, representative micrographs of AR-V7 and AR N-terminal (AR-NTD) IHC of residual tumor from serial sections (scale bar: 200 μm). D, Distribution of H-scores for AR-V7 IHC from posttreatment specimens with residual tumor (n = 34). E, Distribution of residual cancer volumes for each patient receiving six months of neoadjuvant ADT plus enzalutamide prior to radical prostatectomy. Data, log10 (cm3 + 1). F, Overlay of data presented in B, D, and E, displayed by patient with all data available (n = 34). AR-V7–spliced read abundance and residual cancer volume are plotted on the left Y axis, and mean H-score for nuclear AR-V7 staining is plotted on the right Y axis.

References

    1. Culp MB, Soerjomataram I, Efstathiou JA, Bray F, Jemal A. Recent global patterns in prostate cancer incidence and mortality rates. Eur Urol 2020;77:38–52. - PubMed
    1. Sartor O, de Bono JS. Metastatic prostate cancer. N Engl J Med 2018;378:1653–4. - PubMed
    1. Westaby D, Fenor de La Maza MLD, Paschalis A, Jimenez-Vacas JM, Welti J, de Bono J, et al. A new old target: androgen receptor signaling and advanced prostate cancer. Annu Rev Pharmacol Toxicol 2022;62:131–53. - PubMed
    1. Conteduca V, Wetterskog D, Sharabiani MTA, Grande E, Fernandez-Perez MP, Jayaram A, et al. Androgen receptor gene status in plasma DNA associates with worse outcome on enzalutamide or abiraterone for castration-resistant prostate cancer: a multi-institution correlative biomarker study. Ann Oncol 2017;28:1508–16. - PMC - PubMed
    1. Kumar A, Coleman I, Morrissey C, Zhang X, True LD, Gulati R, et al. Substantial interindividual and limited intraindividual genomic diversity among tumors from men with metastatic prostate cancer. Nat Med 2016;22:369–78. - PMC - PubMed

Publication types

MeSH terms