. 2023 Feb;37(1):165-177.
doi: 10.1007/s10877-022-00873-7. Epub 2022 Jun 13.

Using generalized additive models to decompose time series and waveforms, and dissect heart-lung interaction physiology

Affiliations

Using generalized additive models to decompose time series and waveforms, and dissect heart-lung interaction physiology

Johannes Enevoldsen et al. J Clin Monit Comput. 2023 Feb.

Abstract

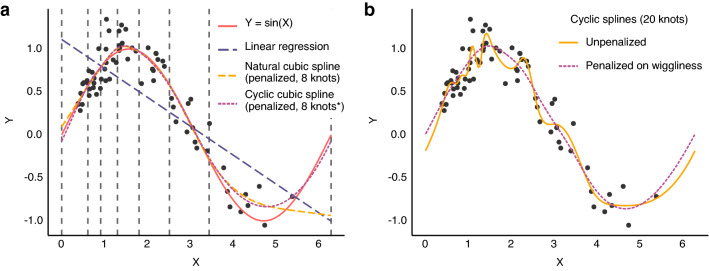
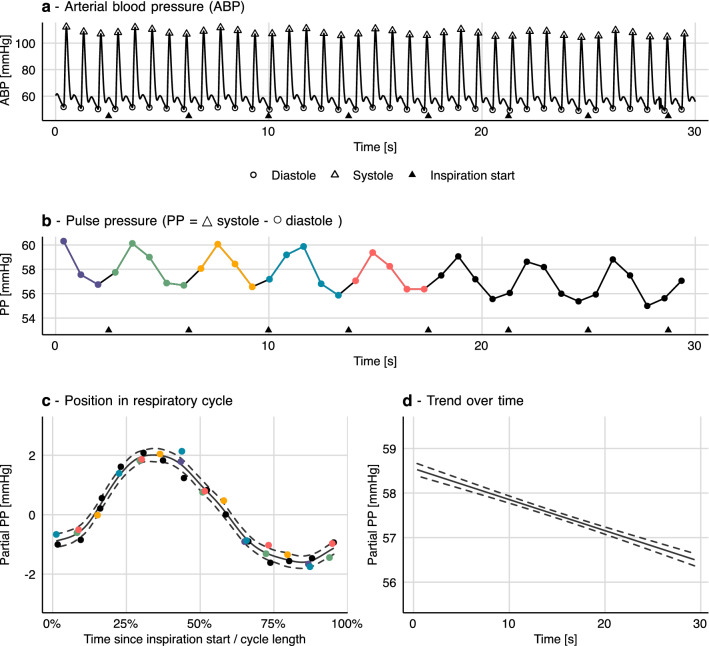
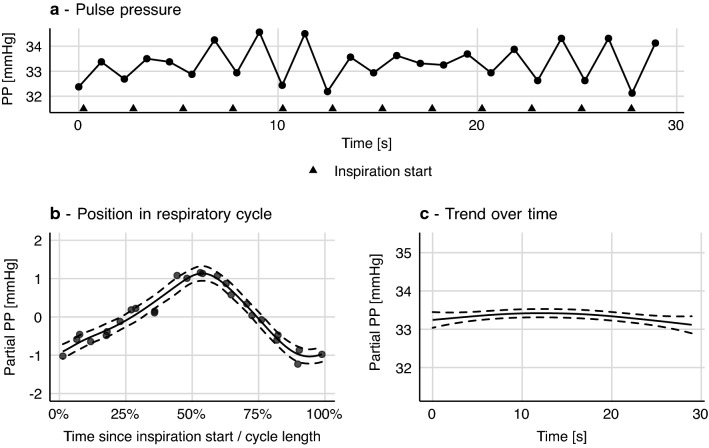
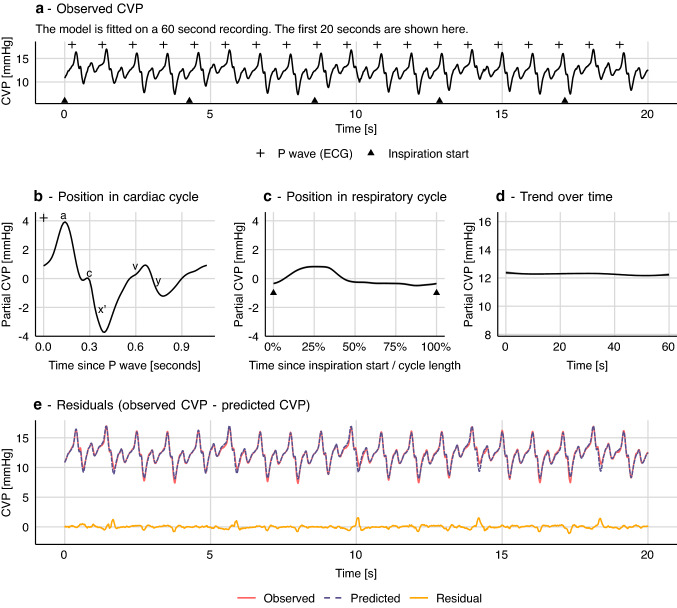
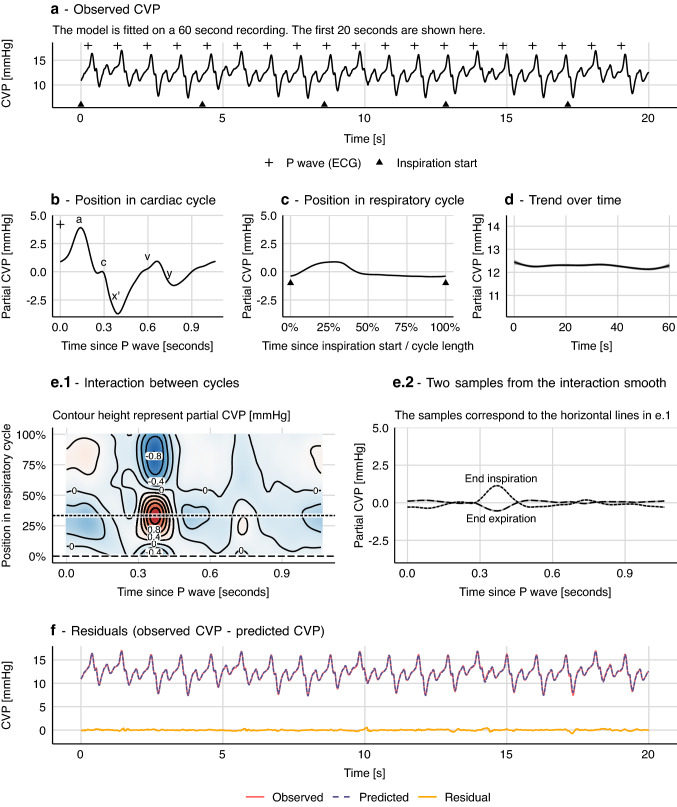
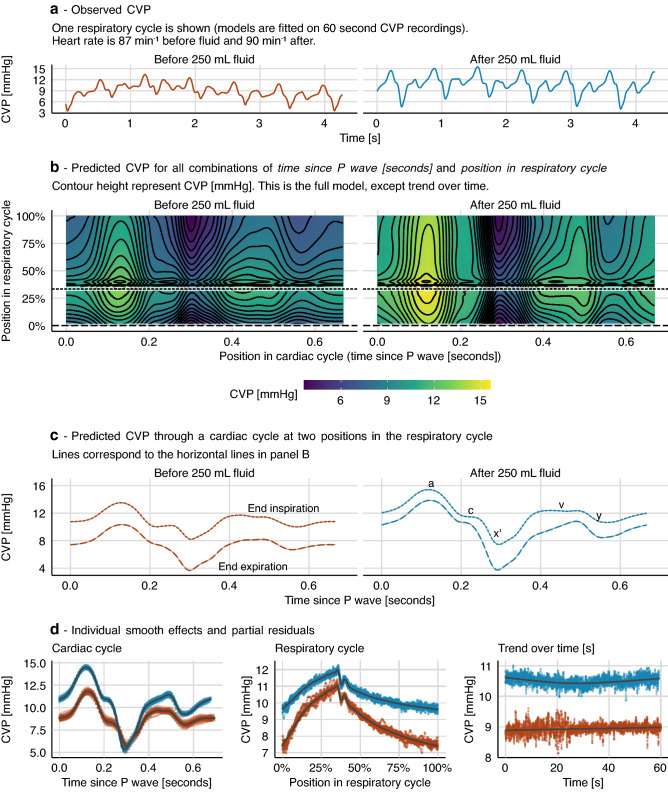
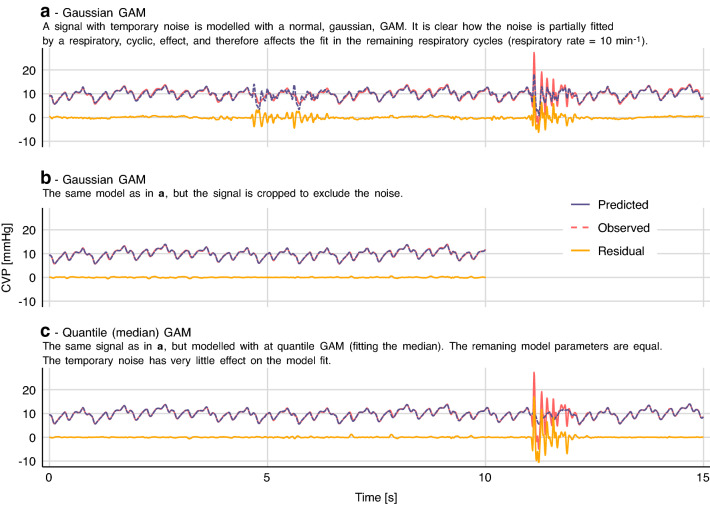
Common physiological time series and waveforms are composed of repeating cardiac and respiratory cycles. Often, the cardiac effect is the primary interest, but for, e.g., fluid responsiveness prediction, the respiratory effect on arterial blood pressure also convey important information. In either case, it is relevant to disentangle the two effects. Generalized additive models (GAMs) allow estimating the effect of predictors as nonlinear, smooth functions. These smooth functions can represent the cardiac and respiratory cycles' effects on a physiological signal. We demonstrate how GAMs allow a decomposition of physiological signals from mechanically ventilated subjects into separate effects of the cardiac and respiratory cycles. Two examples are presented. The first is a model of the respiratory variation in pulse pressure. The second demonstrates how a central venous pressure waveform can be decomposed into a cardiac effect, a respiratory effect and the interaction between the two cycles. Generalized additive models provide an intuitive and flexible approach to modelling the repeating, smooth, patterns common in medical monitoring data.

Keywords: Central venous pressure; Hemodynamic monitoring; Mechanical ventilation; Signal processing; Statistical modelling.


Conflict of interest statement

STV is associate editor of Journal of Clinical Monitoring and Computing. JE and GLS report no competing interests.

Figures

Fig. 1
Fig. 1
Splines fitted to simulated data (n = 70). The data-generating function is Y = sin(X) with added normally distributed noise. a Vertical dashed lines show the position of the 8 knots. *In the cyclic spline there are effectively 7 knots, since the first and last line represent a single knot, joining the ends of the spline. b Comparison of a penalised and an unpenalised spline fitted to the same data. The unpenalised spline with 20 knots is clearly too wiggly and overfits the data. Penalising the spline on wiggliness reduces the risk of overfitting, but keeps the model flexible in case the data demand it
Fig. 2
Fig. 2
How a generalized additive model (GAM) can be fitted to a series of pulse pressure measurements (derived from the arterial waveform). a and b For each beat, systolic and diastolic pressure are detected, and pulse pressure (PP) is calculated. A GAM with two smooths c and d is fitted to the PP time series (b). c This first smooth represents the variation in PP explained by the beats’ position in the respiratory cycle. Coloured points (beats) correspond between panels b and c. d The second smooth represents the trend in PP over time with the model constant (α) added. The sum of these two smooths (b and c) gives the model prediction. Residuals of the model (ε) are the vertical distance from the smooth to the points in panel c (i.e. the scatters are partial residuals). Dashed curves represent 95% confidence intervals
Fig. 3
Fig. 3
This patient has a heart-rate-to-respiratory rate ratio just beyond 2:1 (52:24). a From the pulse pressure (PP) plot, it is difficult to assess pulse pressure variability (PPV), and it seems to be changing. b When PP is modelled as a smooth function of each beat’s position in the respiratory cycle, a tight relationship between respiration and PP is revealed. Dashed curves represent 95% confidence intervals
Fig. 4
Fig. 4
Generalized additive model of central venous pressure (CVP). Variation in CVP is explained by the effects of the cardiac cycle and the respiratory cycle. In this model there is no interaction between the two effects. Grey shades in b, c and d represent 95% confidence intervals (often too narrow to be visible)
Fig. 5
Fig. 5
How a generalized additive model (GAM) can be fitted to a CVP waveform. a Each sample from a 125 Hz CVP waveform is represented with three predictor variables: position in cardiac cycle, position in respiratory cycle and time (seconds since sample start). A GAM is fitted giving the smooth functions b to e (the model constant (α) is added to the smooth function in d. f Model fit including residuals that are markedly reduced compared to the model without an interaction term, visualised in Fig. 4. Grey shades in panel b, c and e represent 95% confidence intervals (often too narrow to be visible)
Fig. 6
Fig. 6
Comparison of sections of a generalized additive model (GAM). The model is fitted to two one-minute sections of central venous pressure (CVP) recordings. One section before a 250 ml fluid infusion and one after. A grey shade in panel c represents 95% confidence intervals (often too narrow to be visible). The constant terms (α and βs) are included in all predictions (b, c and d)
Fig. 7
Fig. 7
Quantile generalized additive models (QGAM) robustly fit medical signals with non-normal errors. The models correspond to the model shown in Fig. 5

References

    1. Marik PE, Cavallazzi R, Vasu T, Hirani A. Dynamic changes in arterial waveform derived variables and fluid responsiveness in mechanically ventilated patients: a systematic review of the literature. Crit Care Med. 2009;37:2642–2647. doi: 10.1097/CCM.0b013e3181a590da. - DOI - PubMed
    1. Guerin L, Monnet X, Teboul J-L. Monitoring volume and fluid responsiveness: from static to dynamic indicators. Best Pract Res Clin Anaesthesiol. 2013;27:177–185. doi: 10.1016/j.bpa.2013.06.002. - DOI - PubMed
    1. Michard F, Chemla D, Teboul J-L. Applicability of pulse pressure variation: how many shades of grey? Crit Care. 2015;19:15–17. doi: 10.1186/s13054-015-0869-x. - DOI - PMC - PubMed
    1. Wyffels PAH, De Hert S, Wouters PF. New algorithm to quantify cardiopulmonary interaction in patients with atrial fibrillation: a proof-of-concept study. Br J Anaesth. 2021;126:111–119. doi: 10.1016/j.bja.2020.09.039. - DOI - PubMed
    1. Hastie T, Tibshirani R. Generalized additive models. Stat Sci Inst Math Stat. 1986;1:297–318.

Publication types

LinkOut - more resources