. 2020 Sep 15;28(3):461-474.
doi: 10.38212/2224-6614.1241.

Acarbose attenuates migration/proliferation via targeting microRNA-143 in vascular smooth muscle cells under diabetic conditions

Affiliations

Acarbose attenuates migration/proliferation via targeting microRNA-143 in vascular smooth muscle cells under diabetic conditions

Wei-Yuan Chuang et al. J Food Drug Anal. .

Abstract

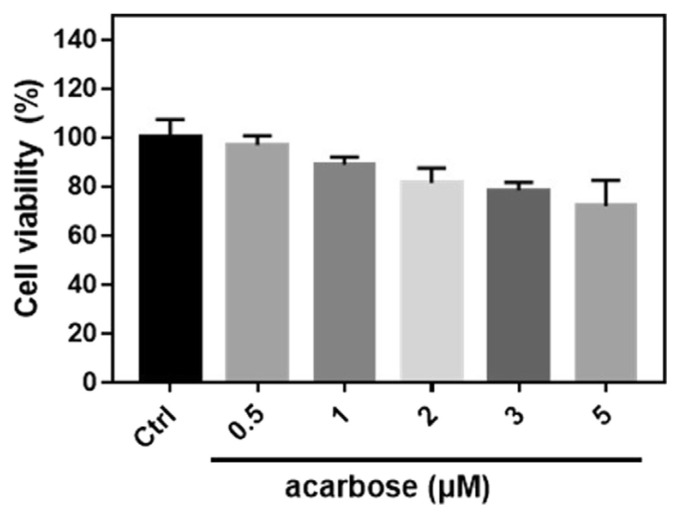
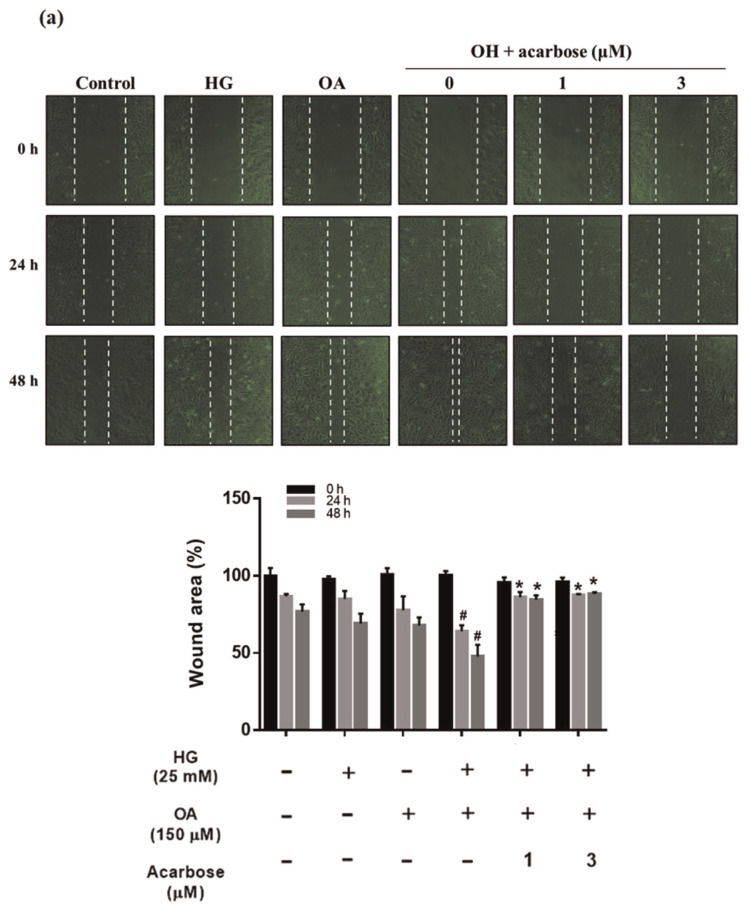
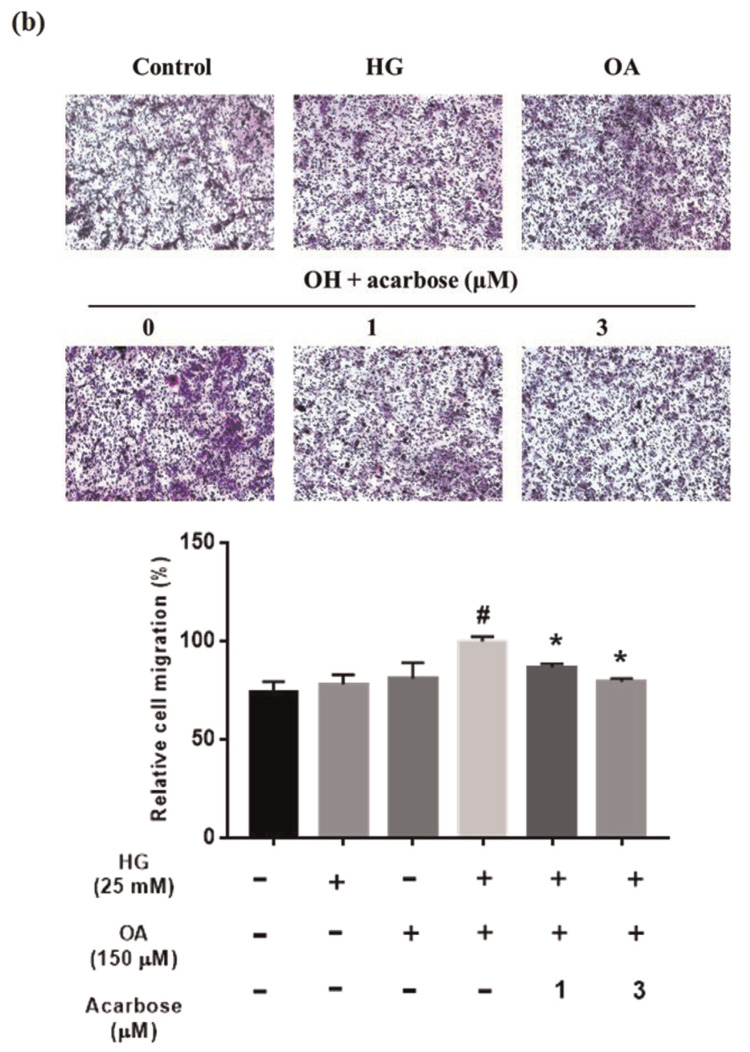
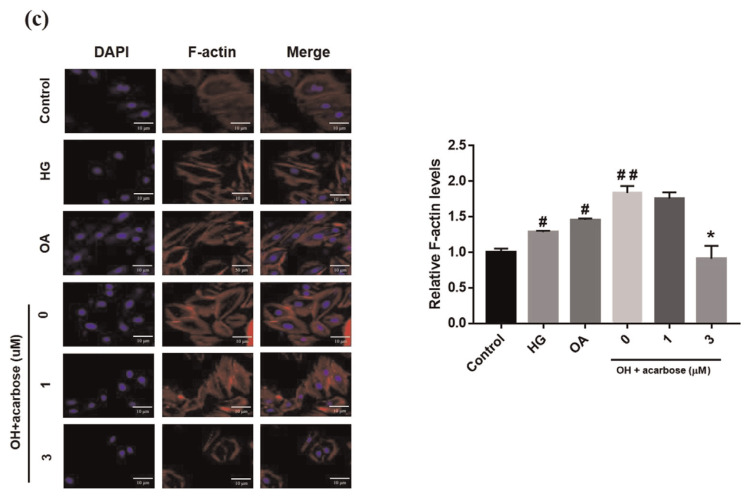
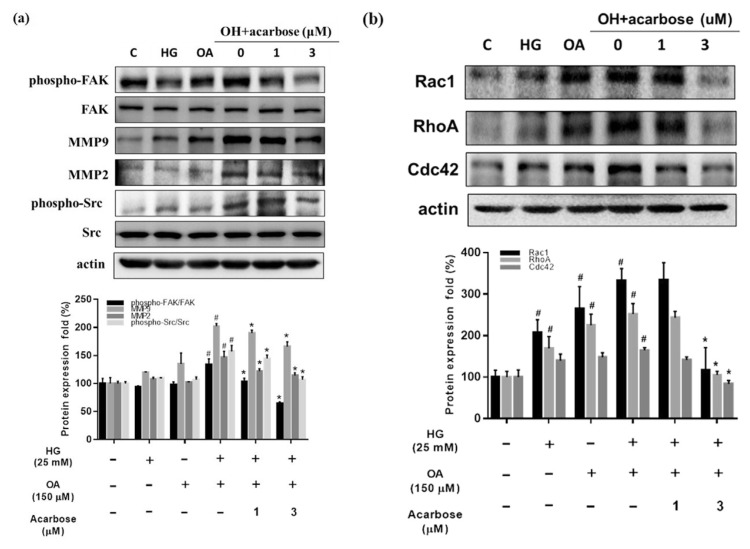
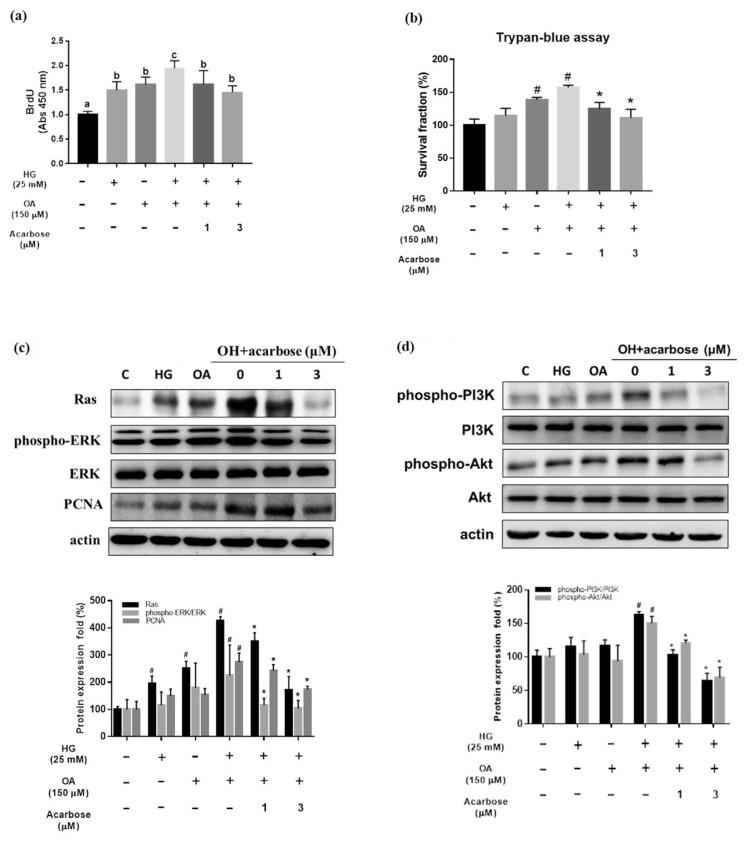
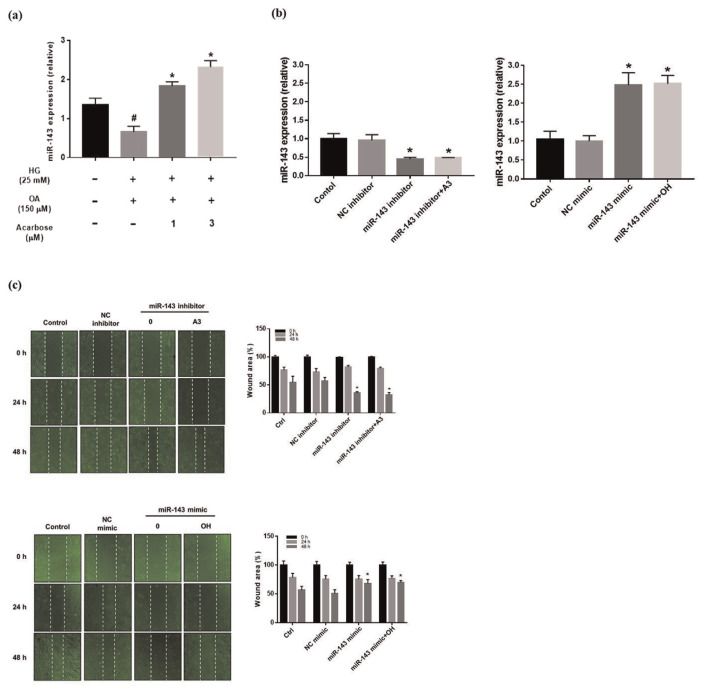
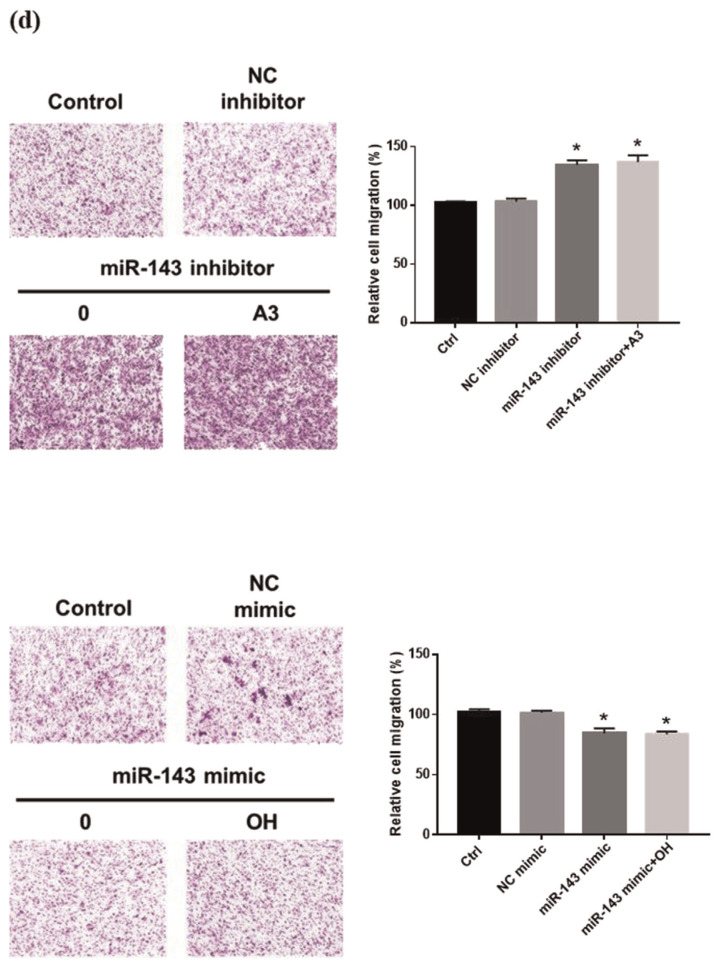
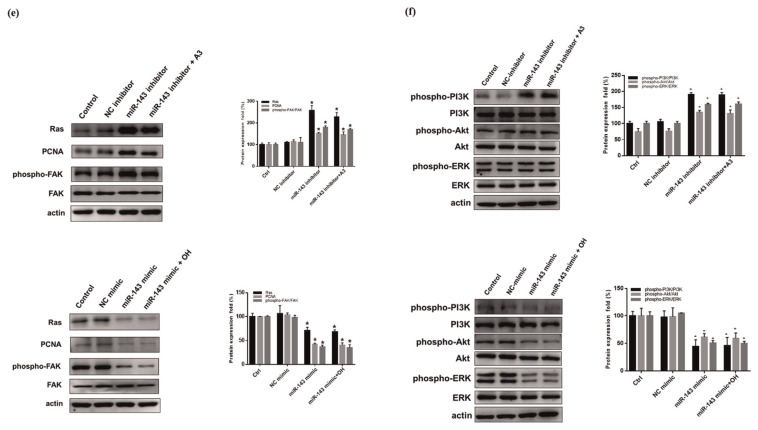
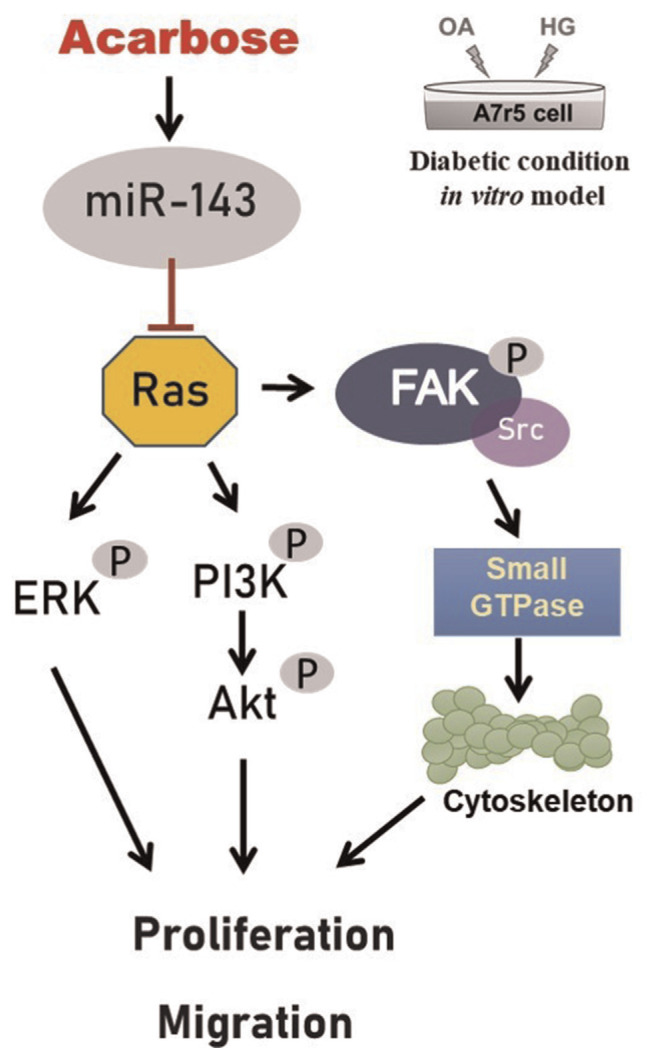
Acarbose (an α-glucosidase inhibitor) has been demonstrated to reduce the progression of atherosclerosis without affecting serum levels of glucose in rabbits fed a high cholesterol diet. The main focus of recent atherosclerosis studies has been microRNA targets. However, the mechanism by which acarbose targets miRNA-mediated atherosclerosis remains unclear. This study aimed to evaluate the effect of acarbose on microRNA-related regulation of rat aortic vascular smooth cell line (A7r5 cell) migration and proliferation induced by diabetic conditions. We reported that acabose exhibit significantly inhibits proliferative and cell migration abilities in A7r5 cells. The expression of protein and levels of mRNA were measured by Western blot analysis and real-time PCR. Acarbose inhibited the phosphorylation of focal adhesion kinase (FAK) and phosphoinositide 3-kinases (PI3K)/protein kinase B (Akt), Ras signals, small GTPase proteins expression to attenuate cell migration and proliferation. Furthermore, acarbose upregulated the expression of miR-143, and transfected miR-143 mimic and its inhibitor to explore its mechanism. In conclusion, acarbose reduces VSMC migration and proliferation via upregulating miR-143 to inhibit Ras-related signaling, and potentially prevention of atherosclerosis.


Conflict of interest statement

Conflict of interest

The authors declare no competing financial interests.

Figures

Fig. 1
Fig. 1
Cell viability of normal-A7r5 cells treated with different concentrations of acarbose. A7r5 cells were treated with 0.5, 1, 2, 3 and 5 μM acarbose for 24 h and analyzed by MTT assay. The data are presented as the mean ± SD from three independent experiments.
Fig. 2
Fig. 2
Effect of acarbose on migration of A7r5 cells. Normal-A7r5 cells were treated with HG, OA, or OH and acarbose (1 and 3 μM) for 24 h. Migration was evaluated with the (a) scratch wound assay and (b) Transwell assay. The results of B were consistent with those of A. In the Transwell assay, cells were seeded in the upper chamber, and cell migration to the lower surface of the membrane was assessed after 24 h. After membrane fixation and staining with Giemsa, the number of migrated cells was counted under a light microscope. (c) Confocal micrographs showing A7r5 cells fixed with paraformaldehyde and stained with DAPI (blue, nucleic acid) and phalloidin-TRITC (red, F-actin). The scale bars represent 10 μm. Representative images of F-actin staining and quantified with fluorescence intensity ratio using ImageJ. The data are presented as the mean ± SD from three independent experiments. #p < 0.05, # #p < 0.01 compared with Ctrl. *p < 0.05 compared with OH group.
Fig. 2
Fig. 2
Effect of acarbose on migration of A7r5 cells. Normal-A7r5 cells were treated with HG, OA, or OH and acarbose (1 and 3 μM) for 24 h. Migration was evaluated with the (a) scratch wound assay and (b) Transwell assay. The results of B were consistent with those of A. In the Transwell assay, cells were seeded in the upper chamber, and cell migration to the lower surface of the membrane was assessed after 24 h. After membrane fixation and staining with Giemsa, the number of migrated cells was counted under a light microscope. (c) Confocal micrographs showing A7r5 cells fixed with paraformaldehyde and stained with DAPI (blue, nucleic acid) and phalloidin-TRITC (red, F-actin). The scale bars represent 10 μm. Representative images of F-actin staining and quantified with fluorescence intensity ratio using ImageJ. The data are presented as the mean ± SD from three independent experiments. #p < 0.05, # #p < 0.01 compared with Ctrl. *p < 0.05 compared with OH group.
Fig. 3
Fig. 3
Acarbose reduced the expression of migration-related protein in A7r5 cells. Normal-A7r5 cells were co-treated with acarbose (1 or 3 μM) and HG, OA, or OH for 24 h. After the cells were harvested, Western blot analyses were conducted with (a) phosphorylated FAK (p-FAK), FAK, phosphorylated Src (p-Src), Src, MMP 2/9, and β-actin antibodies as described in Materials and methods. Densitometry was used to quantify p-FAK relative to total FAK, p-Src relative to total Src, and MMP 2/9 relative to the β-actin. (b) Small GTPase protein (Rac1, Rho A, Cdc42), and β-actin were detected using specific antibodies for each protein. Densitometry was used to quantify Rac1, Rho A, and Cdc42 relative to the β-actin. The Western blot data are presented as the mean ± SD from three independent experiments. #p < 0.05, compared with Ctrl. *p < 0.05 compared with OH group.
Fig. 4
Fig. 4
Acarbose inhibits oleic acid/high glucose-induced proliferation and related protein expression in A7r5 cells. Normal-A7r5 cells were co-treated with acarbose (1 or 3 μM) and HG, OA, or OH for 24 h and then analyzed by (a) the BrdU assay, (b) Trypan blue assay and (c and d) Western blot. (a) The BrdU data are presented as the mean ± SD from three independent experiments. P < 0.05 considered statistically significant using one-way ANOVA, followed by Duncan’s new multiple range test. Bars not sharing a common small letter are significantly different from each other. (b) Cell survival fraction was measured by trypan blue staining to measure viable cells against control. #p < 0.05, compared with Ctrl. *p < 0.05 compared with OH group. (c) Acarbose downregulated expression of Ras, phosphorylated ERK1/2 (p-ERK), ERK, PCNA and β-actin. Densitometry was used to quantify p-ERK relative to total ERK, Ras and PCNA relative to the β-actin. (d) phosphorylated PI3K (p-PI3K), PI3K, phosphorylated Akt (p-Akt), Akt, and β-actin. Densitometry was used to quantify p-PI3K relative to total PI3K, p-Akt relative to total Akt. The Western blot data are presented as the mean ± SD from three independent experiments. #p < 0.05, compared with Ctrl. *p < 0.05 compared with OH group.
Fig. 5
Fig. 5
Effect expression of miR-143 on migration in normal-A7r5 cells. (a) Relative expression of miR-143 in normal-A7r5 cells analyzed using real-time PCR. Each bar represents the mean ± SD from three independent experiments. #p < 0.05, compared with Ctrl. *p < 0.05 compared with OH group. The migration of normal-A7r5 cells transfected or not transfected with miRNA inhibitor/mimic in the presence of OH and acarbose measured by the (b) real-time PCR (c) Wound healing assay and (d) Transwell assay. (e) Western blot analysis of Ras, PCNA and FAK protein expression of normal-A7r5 cells in the presence of OH and A3 (acarbose 3 μM), or with a miR-143 inhibitor/mimic. Densitometry was used to quantify p-FAK relative to total FAK, Ras, and PCNA relative to the β-actin. (f) phosphorylated PI3K (p-PI3K), PI3K, phosphorylated Akt (p-Akt), Akt, phosphorylated ERK (p-ERK), ERK and β-actin. Densitometry was used to quantify p-PI3K relative to total PI3K, p-Akt relative to total Akt, p-ERK relative to total ERK. The Western blot data are presented as the mean ± SD from three independent experiments. *p < 0.05 compared with NC (inhibitor or mimic) group.
Fig. 5
Fig. 5
Effect expression of miR-143 on migration in normal-A7r5 cells. (a) Relative expression of miR-143 in normal-A7r5 cells analyzed using real-time PCR. Each bar represents the mean ± SD from three independent experiments. #p < 0.05, compared with Ctrl. *p < 0.05 compared with OH group. The migration of normal-A7r5 cells transfected or not transfected with miRNA inhibitor/mimic in the presence of OH and acarbose measured by the (b) real-time PCR (c) Wound healing assay and (d) Transwell assay. (e) Western blot analysis of Ras, PCNA and FAK protein expression of normal-A7r5 cells in the presence of OH and A3 (acarbose 3 μM), or with a miR-143 inhibitor/mimic. Densitometry was used to quantify p-FAK relative to total FAK, Ras, and PCNA relative to the β-actin. (f) phosphorylated PI3K (p-PI3K), PI3K, phosphorylated Akt (p-Akt), Akt, phosphorylated ERK (p-ERK), ERK and β-actin. Densitometry was used to quantify p-PI3K relative to total PI3K, p-Akt relative to total Akt, p-ERK relative to total ERK. The Western blot data are presented as the mean ± SD from three independent experiments. *p < 0.05 compared with NC (inhibitor or mimic) group.
Fig. 6
Fig. 6
Schematic diagram of acarbose attenuation of vascular smooth muscle cell proliferation and migration via miR-143 targeting of signals.

Similar articles

Cited by

References

    1. Redfern J, Neubeck L. e-Health in Cardiovascular medicine. Med Sci (Basel Switzerland) . 2019:7. - PMC - PubMed
    1. Sacks FM, Lichtenstein AH, Wu JH, Appel LJ, Creager MA, Kris-Etherton PM, et al. Dietary fats and cardiovascular disease: a presidential advisory from the American heart association. Circulation. 2017;136:e1–23. - PubMed
    1. Piché M-E, Poirier P, Lemieux I, Després J-P. Overview of epidemiology and contribution of obesity and body fat distribution to cardiovascular disease: an update. Prog Cardiovasc Dis. 2018;61:103–13. - PubMed
    1. Lopez-Candales A, Burgos PMH, Hernandez-Suarez DF, Harris D. Linking chronic inflammation with cardiovascular disease: from normal aging to the metabolic syndrome. J Nat Sci. 2017;3 - PMC - PubMed
    1. Standl E, Schnell O, McGuire DK, Ceriello A, Ryden L. Integration of recent evidence into management of patients with atherosclerotic cardiovascular disease and type 2 diabetes. Lancet Diab Endocrinol. 2017;5:391–402. - PubMed

LinkOut - more resources