. 2022 Jul 19;328(3):298-301.
doi: 10.1001/jama.2022.9745.

Updated US Infection- and Vaccine-Induced SARS-CoV-2 Seroprevalence Estimates Based on Blood Donations, July 2020-December 2021

Affiliations

Updated US Infection- and Vaccine-Induced SARS-CoV-2 Seroprevalence Estimates Based on Blood Donations, July 2020-December 2021

Jefferson M Jones et al. JAMA. .

Abstract

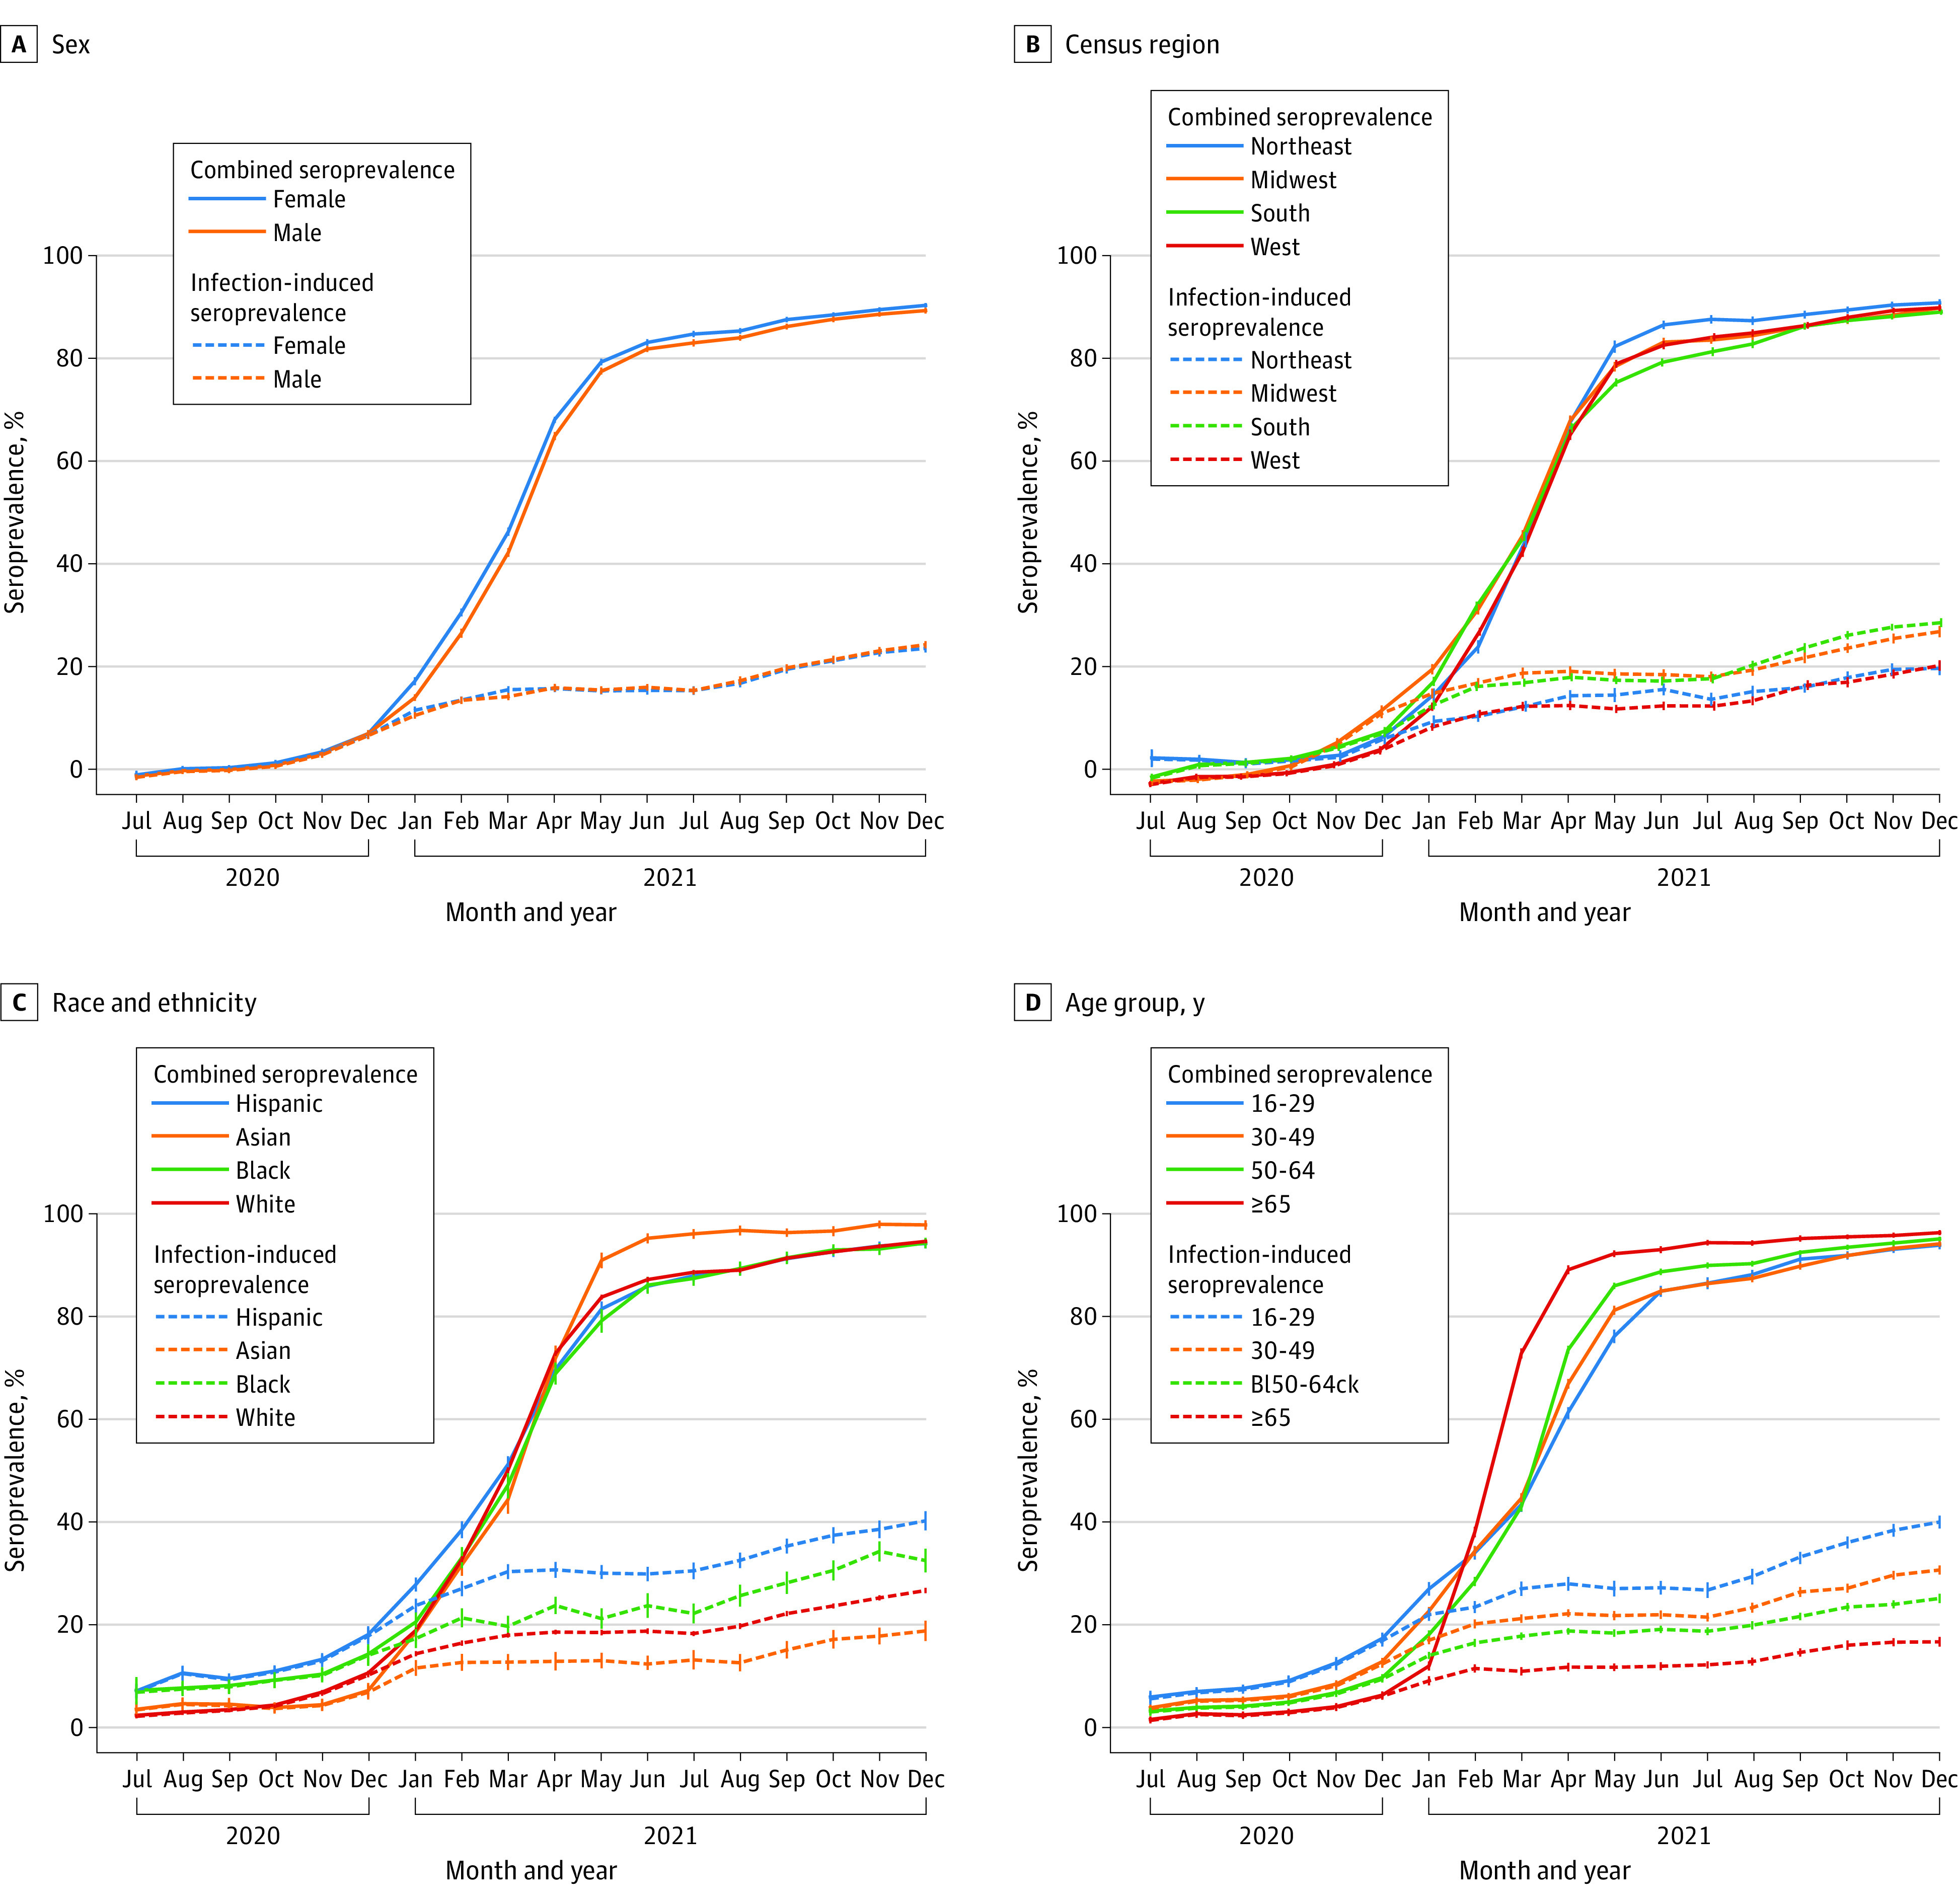
This cross-sectional study examines monthly blood donations from individuals aged 16 years and older to estimate the population with antibodies to SARS-CoV-2 from infection or vaccination.


Conflict of interest statement

Conflict of Interest Disclosures: Dr Stramer reported receiving a contract from the Centers for Disease Control and Prevention (CDC) via Vitalant Research Institute outside the submitted work. Dr Busch reported being an employee of Vitalant Research Institute and serving on the medical advisory board for Creative Testing Systems; Vitalant Research Institute receives research funds and reagents for studies from Ortho and Roche and Dr Busch has presented on behalf of both companies at meetings, with travel support, but does not receive personal compensation from these or other SARS-CoV-2 test-manufacturing companies. No other disclosures were reported.

Figures

Figure 1.
Figure 1.. SARS-CoV-2 Seroprevalence by Census Region, Race and Ethnicity, Sex, and Age, US, July 2020-December 2021
Blood donations were collected from a catchment area representing 69% of the US population in July 2020, increasing to 74% from October 2020 through December 2021. The solid lines represent the proportion of the population with antibodies from infection, vaccination, or both (antispike/combined seroprevalence). The dashed lines represent the proportion of the population with antibodies from infection (antinucleocapsid/infection-induced seroprevalence). Whiskers represent 95% CIs. Seroprevalence was estimated by race and ethnicity because infection and vaccination rates have been demonstrated to differ correspondingly. Blood donors self-identified race and ethnicity from 7 mutually exclusive categories: American Indian, Asian, Black, Hispanic, White, more than 1 race, and other. American Indian, more than 1 race, and other are not shown owing to small numbers. Of 2 475 061 blood donor specimens from donors residing in the study regions, 66 953 (2.7%) were excluded for missing race and ethnicity information and 16 (<0.1%) were excluded for missing data on sex or age. The x-axis tick marks represent the middle of each month.
Figure 2.
Figure 2.. Association Between Study Region December 2021 Vaccination Rate and Increase in Infection-Induced Seroprevalence During 2021
Fully vaccinated rates were measured with vaccine data as reported to the Centers for Disease Control and Prevention (CDC). Fully vaccinated was defined according to CDC definitions (ie, receipt of ≥2 messenger RNA COVID-19 vaccine doses or ≥1 Ad26.COV2.S dose [Janssen]). The fully vaccinated rate was measured as of December 31, 2021, among adults aged 18 years or older residing in the counties corresponding to each study region. Methods to form the study regions and a map of the study regions have been published. Georgia and Hawaiʻi regions were removed because county of residence was missing for most records. The increase in seroprevalence was measured as the change in infection-induced seroprevalence (ie, the N antibody seroprevalence) per increase in vaccine percentage from January 2021 to December 2021 to estimate the number of infections that occurred after COVID-19 vaccination administration had begun. A regression line is displayed in gray (slope = −0.32; P < .001). The correlation coefficient was −0.46. N indicates nucleocapsid.

References

    1. Jones JM, Stone M, Sulaeman H, et al. . Estimated US infection- and vaccine-induced SARS-CoV-2 seroprevalence based on blood donations, July 2020-May 2021. JAMA. 2021;326(14):1400-1409. doi:10.1001/jama.2021.15161 - DOI - PMC - PubMed
    1. Centers for Disease Control and Prevention . COVID data tracker. Accessed March 23, 2022. https://covid.cdc.gov/covid-data-tracker
    1. Fan Y, Li X, Zhang L, Wan S, Zhang L, Zhou F. SARS-CoV-2 Omicron variant: recent progress and future perspectives. Signal Transduct Target Ther. 2022;7(1):141. doi:10.1038/s41392-022-00997-x - DOI - PMC - PubMed
    1. Ferdinands JM, Rao S, Dixon BE, et al. . Waning 2-dose and 3-dose effectiveness of mRNA vaccines against COVID-19–associated emergency department and urgent care encounters and hospitalizations among adults during periods of Delta and Omicron variant predominance—VISION Network, 10 states, August 2021-January 2022. MMWR Morb Mortal Wkly Rep. 2022;71(7):255-263. doi:10.15585/mmwr.mm7107e2 - DOI - PMC - PubMed
    1. Hall V, Foulkes S, Insalata F, et al. ; SIREN Study Group . Protection against SARS-CoV-2 after Covid-19 vaccination and previous infection. N Engl J Med. 2022;386(13):1207-1220. doi:10.1056/NEJMoa2118691 - DOI - PMC - PubMed