. 2022 Jun 13;18(6):e1010229.
doi: 10.1371/journal.pgen.1010229. eCollection 2022 Jun.

Krüppel-like factor 15 integrated autophagy and gluconeogenesis to maintain glucose homeostasis under 20-hydroxyecdysone regulation

Affiliations

Krüppel-like factor 15 integrated autophagy and gluconeogenesis to maintain glucose homeostasis under 20-hydroxyecdysone regulation

Xiao-Pei Wang et al. PLoS Genet. .

Abstract

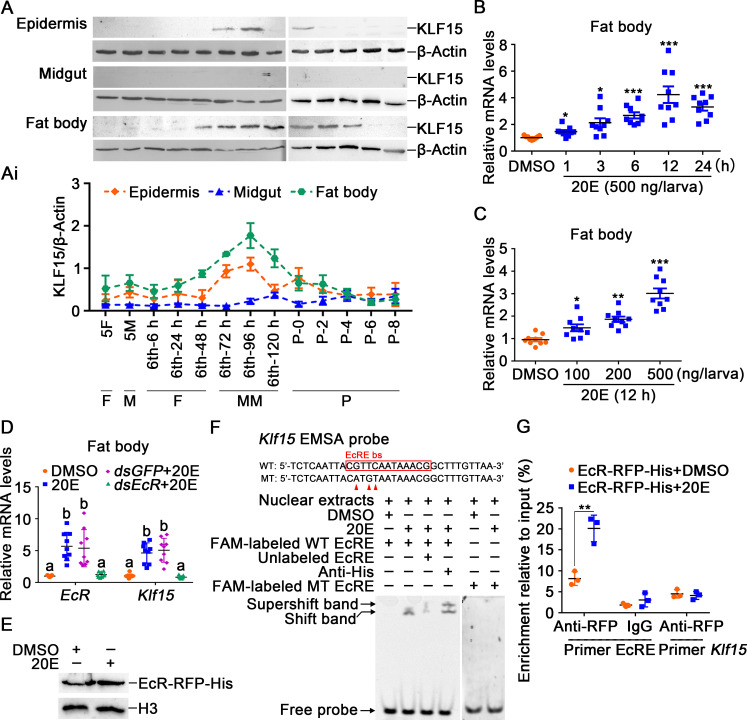
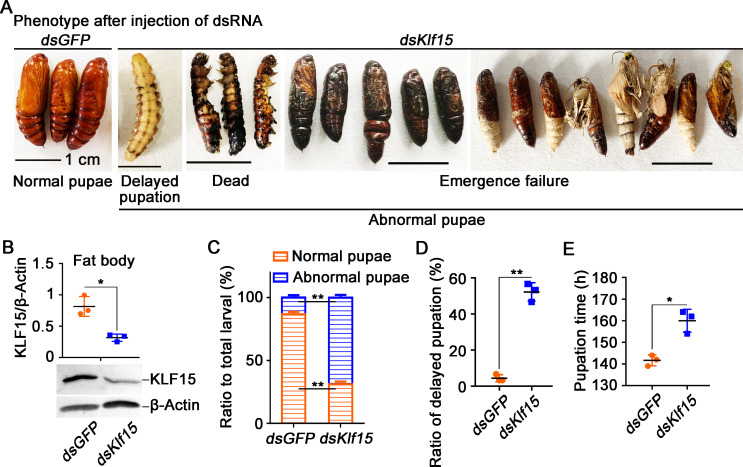
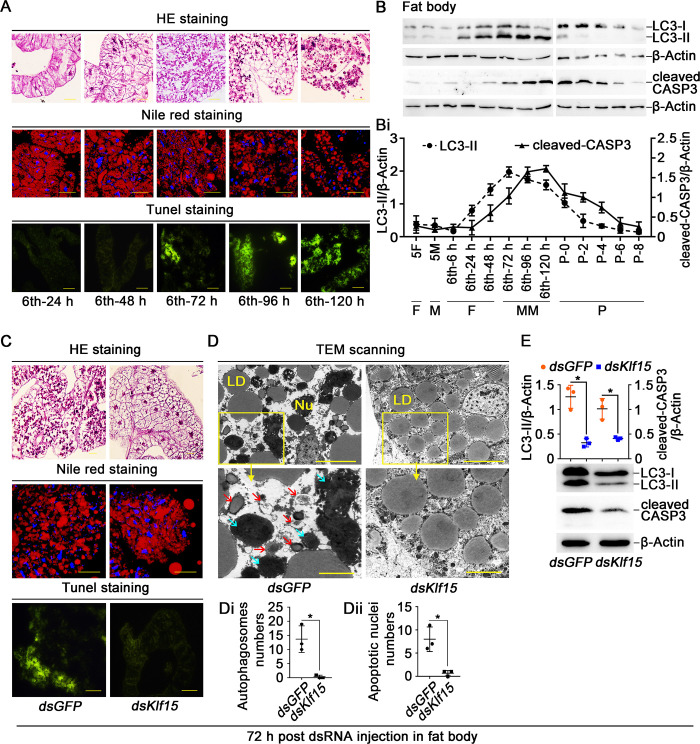
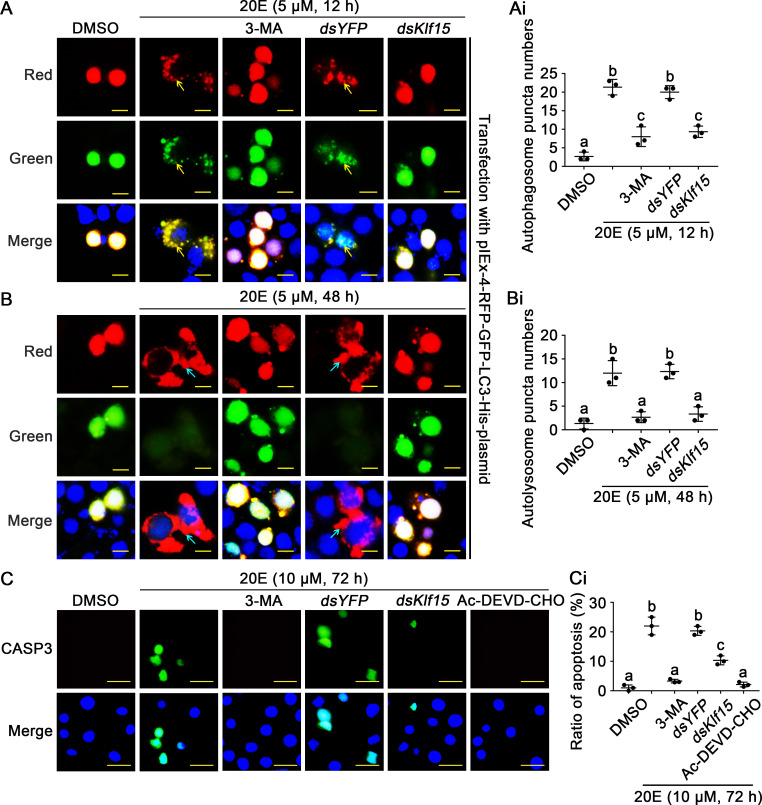
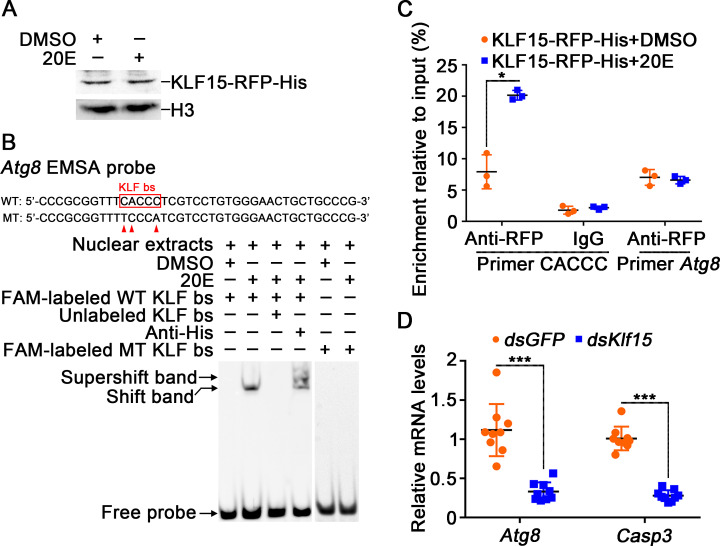
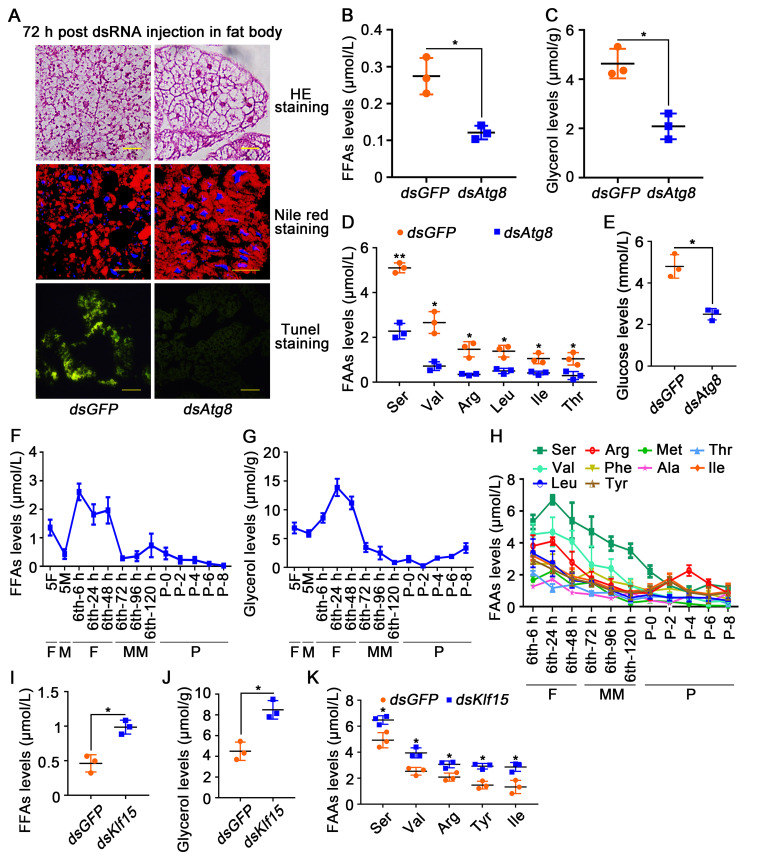
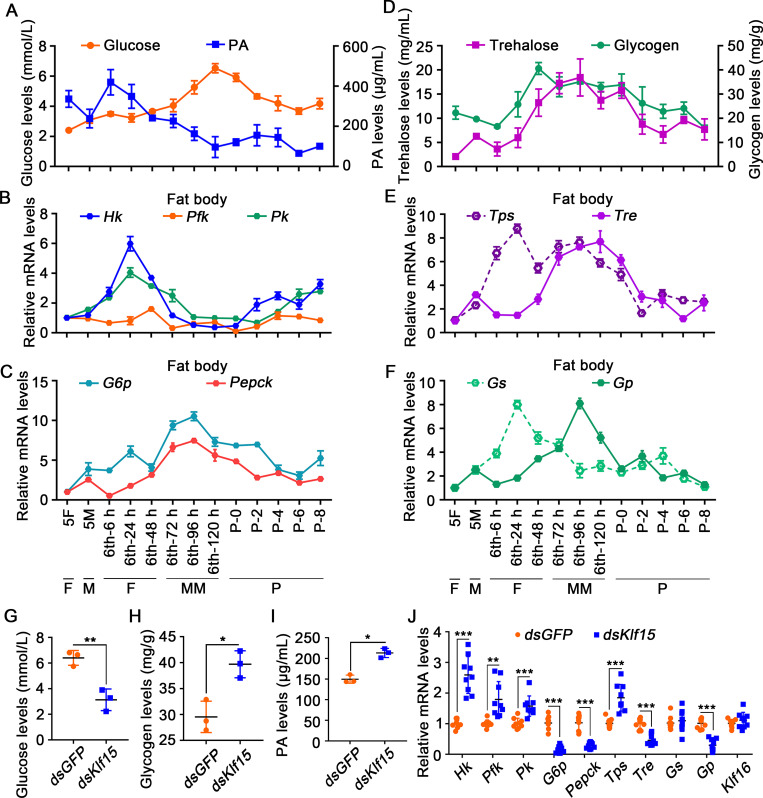
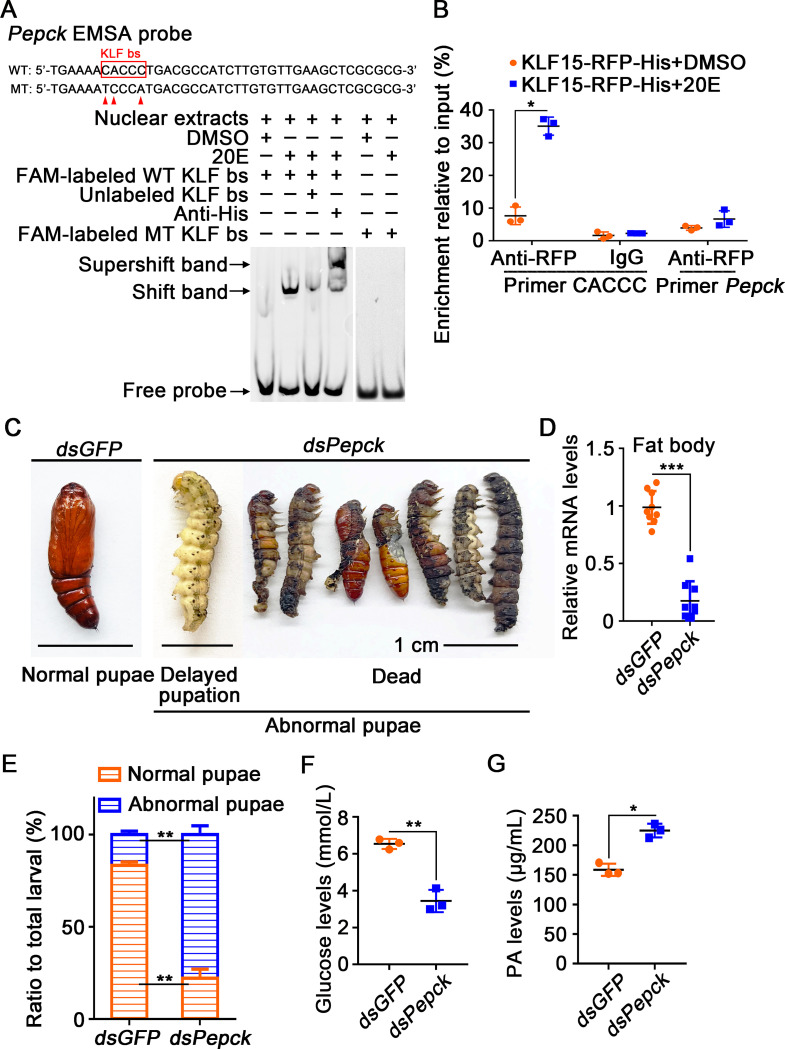
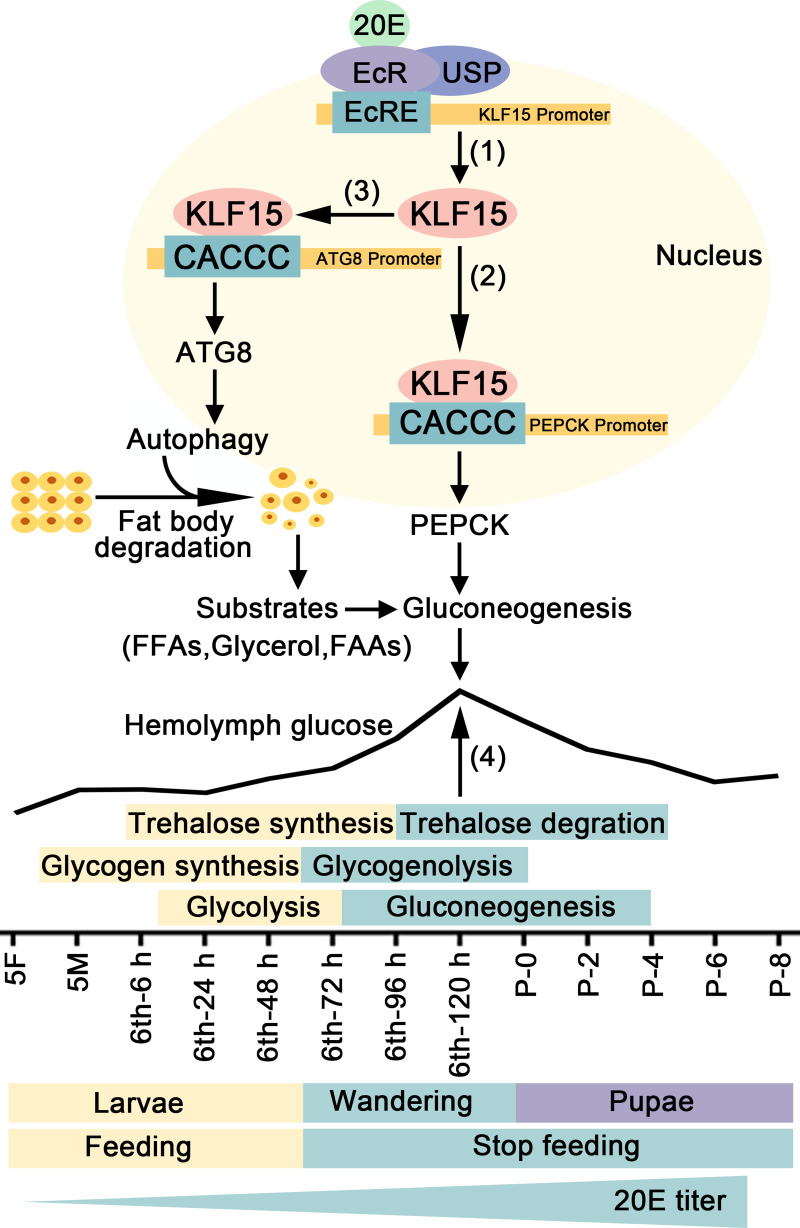
The regulation of glycometabolism homeostasis is vital to maintain health and development of animal and humans; however, the molecular mechanisms by which organisms regulate the glucose metabolism homeostasis from a feeding state switching to a non-feeding state are not fully understood. Using the holometabolous lepidopteran insect Helicoverpa armigera, cotton bollworm, as a model, we revealed that the steroid hormone 20-hydroxyecdysone (20E) upregulated the expression of transcription factor Krüppel-like factor (identified as Klf15) to promote macroautophagy/autophagy, apoptosis and gluconeogenesis during metamorphosis. 20E via its nuclear receptor EcR upregulated Klf15 transcription in the fat body during metamorphosis. Knockdown of Klf15 using RNA interference delayed pupation and repressed autophagy and apoptosis of larval fat body during metamorphosis. KLF15 promoted autophagic flux and transiting to apoptosis. KLF15 bound to the KLF binding site (KLF bs) in the promoter of Atg8 (autophagy-related gene 8/LC3) to upregulate Atg8 expression. Knockdown Atg8 reduced free fatty acids (FFAs), glycerol, free amino acids (FAAs) and glucose levels. However, knockdown of Klf15 accumulated FFAs, glycerol, and FAAs. Glycolysis was switched to gluconeogenesis, trehalose and glycogen synthesis were changed to degradation during metamorphosis, which were accompanied by the variation of the related genes expression. KLF15 upregulated phosphoenolpyruvate carboxykinase (Pepck) expression by binding to KLF bs in the Pepck promoter for gluconeogenesis, which utilised FFAs, glycerol, and FAAs directly or indirectly to increase glucose in the hemolymph. Taken together, 20E via KLF15 integrated autophagy and gluconeogenesis by promoting autophagy-related and gluconeogenesis-related genes expression.


Conflict of interest statement

The authors have declared that no competing interests exist.

Figures

Fig 1
Fig 1. 20E upregulated the expression of Klf15.
A. The protein profiles of KLF15 in the epidermis, midgut, and fat body detected using western blotting after 12.5% SDS-PAGE. 5F: fifth instar feeding larvae; 5M: fifth instar molting larvae; 6th-6 h to 120 h: sixth instar larvae at different stages; P0 to P8: 0 to 8-day-old pupae. F: feeding; M: molting; MM: metamorphic molting; P: pupae. Ai. Quantification of KLF15 in A using Image J software. B. Time course of the Klf15 expression in the fat body after 20E (500 ng/larva) induction. DMSO was used as the control. C. The expression of Klf15 in the fat body under stimulation with different concentrations of 20E for 12 h. D. Knockdown of EcR in the fat body by dsEcR (3 μg/larva) followed by stimulation with 20E (500 ng/larva) for 12 h to detect the expression of Klf15. E. Nuclear proteins from EcR-RFP-His overexpressed cells were extracted for EMSA. F. EcRE on the Klf15 promoter bound to EcR detected by EMSA assay. WT and MT represent EcRE probe and EcRE mutant probe, respectively. G. ChIP assay showing 20E promoted Klf15 expression via EcR binding to EcRE and detected by qRT-PCR. Primer EcRE is the sequence containing EcRE. Primer Klf15, as non-EcRE control targeting to Klf15 open reading frame (ORF).
Fig 2
Fig 2. Knockdown of Klf15 delayed pupation.
A. Phenotypes after injection of Klf15 dsRNA from 6th-6 h larva to 72 h; the ruler represents 1 cm, dsGFP was used as the control. B. Western blotting validation of the interference efficiency in the fat body after the third dsRNA injection. C. Ratio of phenotypes, abnormal pupae include larvae that die during the prepupa stage, dead pupae and chimeric pupae that cannot normally emerge. D. The ratio of delayed pupation after the dsRNA injection. E. The time at which the larvae pupated after knockdown GFP and Klf15. The data were obtained in triplicate with thirty larvae each time.
Fig 3
Fig 3. Knockdown of Klf15 repressed fat body degradation.
A. The morphological changes of fat body were assessed by HE staining, Nile red staining and TUNEL staining, the ruler represents 50 μm in the HE staining. Nile red stained for intracellular LD, the ruler represents 50 μm. The apoptotic cells in the fat body were determined by TUNEL staining assay, the ruler represents 100 μm. B. Western blotting detection of LC3-II and cleaved-CASP3 protein levels in the fat body using anti-LC3 and anti-CASP3 antibodies, with β-Actin as protein control after 15% SDS-PAGE. Bi. Quantification of the data in B. C. HE staining, Nile red staining and TUNEL staining showing fat body morphology after knockdown Klf15, observed after first injection dsRNA for 72 h. D. TEM observation after injection with dsKlf15 in the fat body. The bars in the wide field view represented 100 μm, in the small field view represented 40 μm. The red arrows indicated autophagosomes, the blue arrow represented the apoptotic nuclei. Nu: nucleus, LD: lipid droplets. Di. Counted the autophagosomes contained in three different sets of images. The area of each image is about 0.09 mm2. Dii. Counted the apoptotic nuclei of dsGFP and dsKlf15. E. After knockdown dsGFP and dsKlf15, western blotting detected LC3-II and cleaved-CASP3. 72 h post dsRNA injection in fat body: 72 h post dsRNA injection into hemocoel and observed the variation in the fat body.
Fig 4
Fig 4. KLF15 promoted autophagy and apoptosis as detected by autophagic flux and CASP3 activity.
A and B. The autophagic flux were detected in HaEpi cells when Klf15 was knocked down, dsYFP was used as the control. 3-MA (10 μM) is an autophagosome formation inhibitor; the yellow bars represented 20 μm. The yellow arrows represented autophagosome puncta. The blue arrows represented autolysosome puncta. Ai and Bi. Counted the number of autophagosome puncta and autolysosome puncta in successfully transfected with pIEx-GFP-RFP-LC3 cells. C. After knocked down Klf15 in HaEpi cells, examination of apoptosis by the addition of active CASP3, Ac-DEVD-CHO is a CASP3 inhibitor, the bars represented 50 μm. Ci. Quantification apoptotic cells in total from C.
Fig 5
Fig 5. KLF15 promoted autophagy through upregulating Atg8.
A. Nuclear proteins from KLF15-RFP-His overexpressed cells were extracted for EMSA. B. KLF bs on the Atg8 promoter bound to KLF15 detected by EMSA assay. WT and MT represent KLF bs probe and KLF bs mutant probe, respectively. C. ChIP assay showing 20E promoted Atg8 expression via KLF15 binding to KLF bs. Primer CACCC targeting KLF bs. Primer Atg8 targeting Atg8 ORF. D. Changes in the expression levels of Atg8 and Casp3 after Klf15 knockdown.
Fig 6
Fig 6. Autophagy presented substrates for gluconeogenesis.
A. HE staining, Nile red staining and TUNEL staining showing the morphology of fat body after dsGFP and dsAtg8 injection into hemocoel. B and C. Levels of FFAs in the hemolymph and glycerol in the fat body after knockdown of Atg8. D. FAAs levels in the hemolymph after knockdown of Atg8. E. Glucose levels in the hemolymph decreased after knockdown Atg8. F and G. FFAs levels in the hemolymph and glycerol levels in the fat body from 5th instar larvae to 8-day-old pupae. H. FAAs levels in the hemolymph. I and J. FFAs and glycerol levels after first injection dsKlf15 for 72 h. K. FAAs levels after knockdown of Klf15.
Fig 7
Fig 7. Variation in the levels of metabolites and related genes expression after Klf15 was knocked down in larvae.
A. The levels of glucose and PA in the hemolymph. B. The expression profiles of Hk, Pfk, and Pk in the fat body. C. The expression profiles of G6p and Pepck in the fat body. D. Trehalose levels in the hemolymph and glycogen levels in the fat body. E. qRT-PCR showing the mRNA expression profiles of Tps and Tre in the fat body. F. The expression profiles of Gs and Gp in the fat body. G-I. Variation in the levels of metabolites after first injection dsKlf15 for 72 h. J. Changes in the expression levels of certain genes after Klf15 knockdown by injection of dsRNA, as detected using qRT-PCR.
Fig 8
Fig 8. Knockdown of Pepck delayed pupation and decreased hemolymph glucose levels.
A. KLF bs on the Pepck promoter bound to KLF15 detected by EMSA assay. B. ChIP assay showing 20E promoted Pepck expression via KLF15 binding to KLF bs. C. Phenotypes after injection of dsPepck and dsGFP from 6th-6 h to 72 h; the ruler represents 1 cm. D. qRT-PCR validation of the interference efficiency in the fat body after the third dsRNA injection. E. Ratio of phenotypes. F. Glucose levels in the hemolymph decreased after knockdown Pepck. G. PA levels in the hemolymph increased after knockdown Pepck.
Fig 9
Fig 9. A diagram illustrating 20E regulates glycometabolism reprogramming, autophagy, and apoptosis via KLF15.
20E promotes the expression of Klf15 via nuclear receptors (1). By binding to the KLF bs, KLF15 promotes the transcription of Pepck, a crucial enzyme in gluconeogenesis (2). KLF15 increases the transcription of the autophagy-related gene Atg8 to induce autophagy (3), thereby providing substrates for gluconeogenesis. The increase of glucose during metamorphosis is due to trehalose and glycogen degradation, glycolysis inhibition, and gluconeogenesis (4).

Similar articles

Cited by

References

    1. Agius L. Role of glycogen phosphorylase in liver glycogen metabolism. Mol Aspects Med. 2015;46:34–45. doi: 10.1016/j.mam.2015.09.002 . - DOI - PubMed
    1. Doorneweerd DD, Tan AW, Nuttall FQ. Liver phosphorylase kinase: characterization of two interconvertible forms and partial purification of phosphorylase kinase a. Mol Cell Biochem. 1982;47(1):45–53. doi: 10.1007/BF00241565 . - DOI - PubMed
    1. Miyamoto T, Amrein H. Neuronal gluconeogenesis regulates systemic glucose homeostasis in Drosophila melanogaster. Curr Biol. 2019;29(8):1263–72 e5. doi: 10.1016/j.cub.2019.02.053 . - DOI - PubMed
    1. Ekberg K, Landau BR, Wajngot A, Chandramouli V, Efendic S, Brunengraber H, et al.. Contributions by kidney and liver to glucose production in the postabsorptive state and after 60 h of fasting. Diabetes. 1999;48(2):292–8. doi: 10.2337/diabetes.48.2.292 . - DOI - PubMed
    1. Shields JM, Yang VW. Identification of the DNA sequence that interacts with the gut-enriched Krüppel-like factor. Nucleic Acids Res. 1998;26(3):796–802. doi: 10.1093/nar/26.3.796 ; PubMed Central PMCID: PMC147321. - DOI - PMC - PubMed

Publication types