. 2022 Jun 13;18(6):e1010175.
doi: 10.1371/journal.pcbi.1010175. eCollection 2022 Jun.

Discrete modeling for integration and analysis of large-scale signaling networks

Affiliations

Discrete modeling for integration and analysis of large-scale signaling networks

Pierre Vignet et al. PLoS Comput Biol. .

Abstract

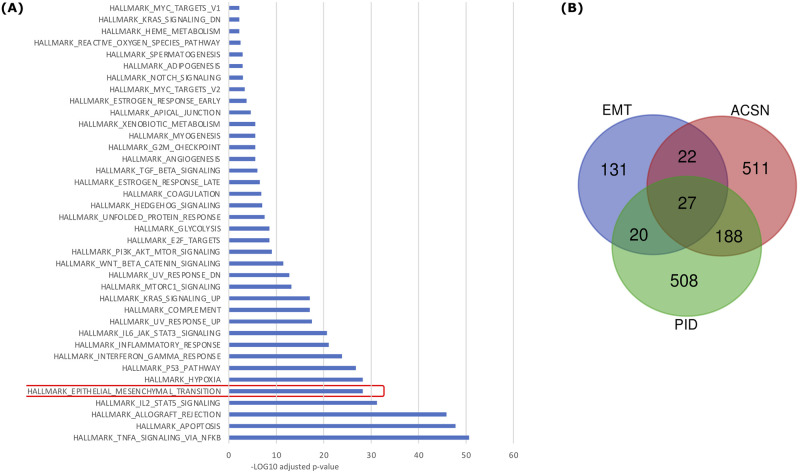
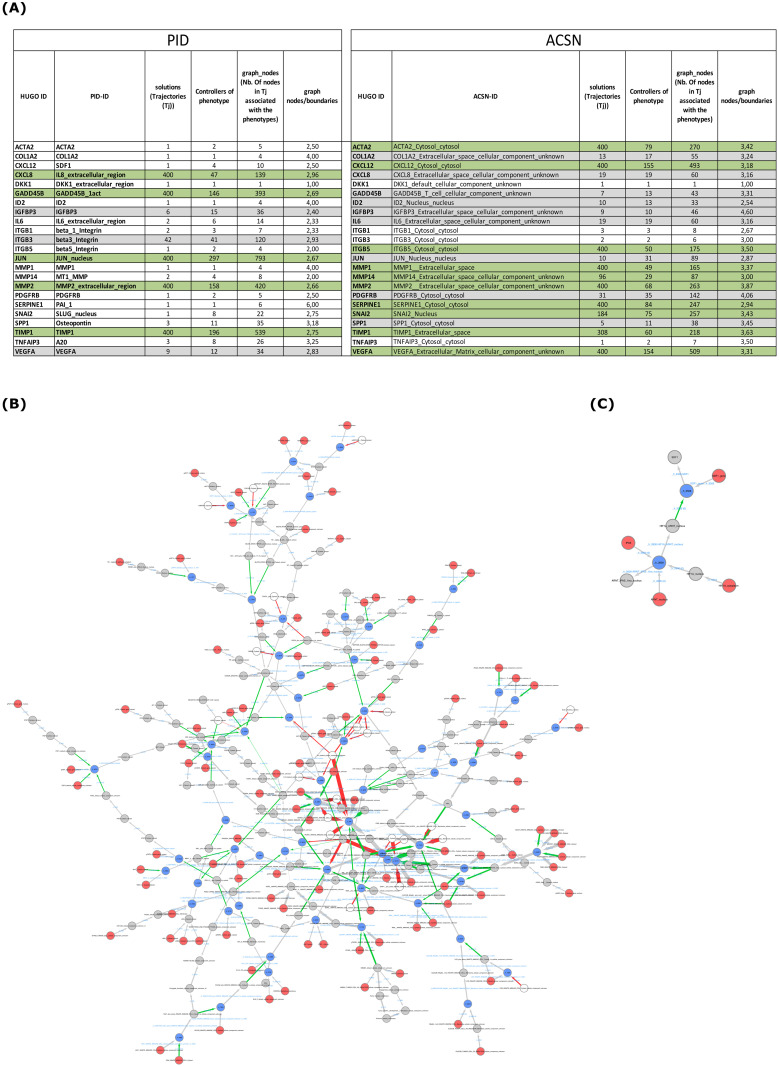
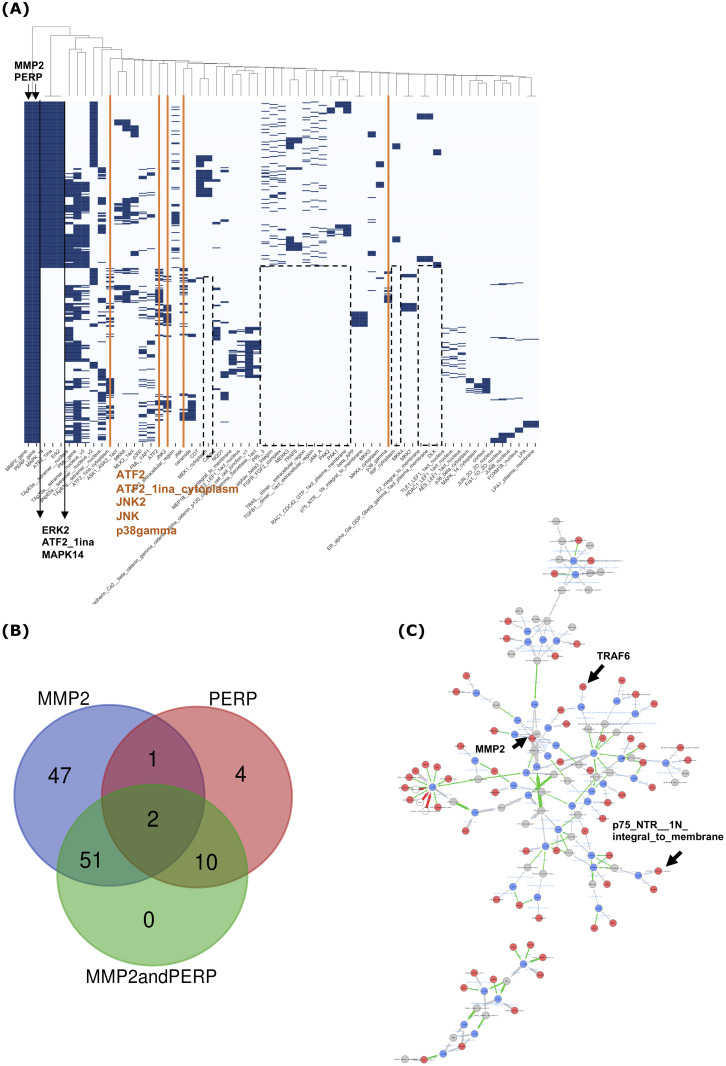
Most biological processes are orchestrated by large-scale molecular networks which are described in large-scale model repositories and whose dynamics are extremely complex. An observed phenotype is a state of this system that results from control mechanisms whose identification is key to its understanding. The Biological Pathway Exchange (BioPAX) format is widely used to standardize the biological information relative to regulatory processes. However, few modeling approaches developed so far enable for computing the events that control a phenotype in large-scale networks. Here we developed an integrated approach to build large-scale dynamic networks from BioPAX knowledge databases in order to analyse trajectories and to identify sets of biological entities that control a phenotype. The Cadbiom approach relies on the guarded transitions formalism, a discrete modeling approach which models a system dynamics by taking into account competition and cooperation events in chains of reactions. The method can be applied to every BioPAX (large-scale) model thanks to a specific package which automatically generates Cadbiom models from BioPAX files. The Cadbiom framework was applied to the BioPAX version of two resources (PID, KEGG) of the Pathway Commons database and to the Atlas of Cancer Signalling Network (ACSN). As a case-study, it was used to characterize sets of biological entities implicated in the epithelial-mesenchymal transition. Our results highlight the similarities between the PID and ACSN resources in terms of biological content, and underline the heterogeneity of usage of the BioPAX semantics limiting the fusion of models that require curation. Causality analyses demonstrate the smart complementarity of the databases in terms of combinatorics of controllers that explain a phenotype. From a biological perspective, our results show the specificity of controllers for epithelial and mesenchymal phenotypes that are consistent with the literature and identify a novel signature for intermediate states.


Conflict of interest statement

The authors have declared that no competing interests exist.

Figures

Fig 1
Fig 1. Conversion of BioPAX classes into guarded transitions.
BioPAX classes (in blue) denoting cellular and molecular objects in biological pathways are interpreted as Cadbiom entities, transitions and conditions (in green). Unused BioPAX classes are surrounded by dashes.
Fig 2
Fig 2. Interpretation of BioPAX models (represented in colored CheBi format) in guarded transitions.
(A) The complex assembly of PKG-cGMP is rewriten by two guarded transitions linked by the common event h0. Each guarded transition has one of the substrates as input and the other substrate as condition. By introducing a common h0 event in their guards, we model the fact that both guarded transitions must be activated simultaneously to produce the complex. This can happen if and only if, both inputs are present and if the condition guards are satisfied, i.e., if PKG and cGMP are present. (B) The catalysis reaction that decomposes the compound 4MTOBUT into L-Met and 2-Oxoacid under the regulation of Asat is modeled by two guarded transitions, sharing the same event h0 and the same Asat condition guard. (C) In the generic case when a BioPAX entity class A consists of two entities A1, A2 which do not appear individually in any reaction in the model, the entity class A is conserved as a single compound A in the guarded transition model, and A1 and A2 are eliminated from the Cadbiom model. The complex assembly reaction between any element of the class A and another compound B is modeled by two transitions producing the entity AB. This entity is then used in the guard of the transition modeling the biochemical reaction transforming AB into C and D. (D) A transport reaction of the Connexin26 and Connexin32 molecules, gathered in the class Cx26/Cx32, from Endoplasmic reticulum membrane to Endoplasmic reticulum-Golgi intermediate compartment. In the latter compartment, a complex assembly occurs between the connexins. In the guarded transition model, the class Cx26/Cx32 is deleted. The compounds Connexin26 and Connexin32 are each duplicated into the two compartments. The transport of each compound is modeled by independent guarded transitions.
Fig 3
Fig 3. Example of a guarded-transition model and controllers associated with different queries.
The guarded transition model consists of 15 biomolecules (A,B,C,D,E,F,G,H,I,J,K,L,M,N,P), 11 transitions (black arrows) for 7 temporal events (h1, … h7), which model reactions. Two events carry a guard (i.e., logical formula) restricting their triggering: h0 requires the satisfiability of the formula A and (P or L or K) and not(M), while h3 requires the presence of the reagent F.F is considered to be an activator of h3, just as A, P, L and K are activators of h0 (i.e., in the presence of A, and one of the latter 3 is sufficient to trigger h0); in contrast, M is an inhibitor of h0. The event h1 consumes N to produce simultaneously P and M; it is never triggered in the context of obtaining C because of the production of the inhibitor M. A cycle of 3 biomolecules I, J, K, constitutes a strongly connected component. This cycle is resolved by arbitrarily adding a virtual node named cycle_initiation_node on the first of the lexicographically sorted nodes (i.e., I); this has the effect of adding I to the system boundary entities.
Fig 4
Fig 4. Comparative analysis of Hugo identifiers associated with gene entities of the PID and ACSN cadbiom models.
(A) Venn diagram describing the intersection between the HUGO identifiers appearing in gene entities of the PID and ACSN cadbiom models. (B) Over-representation analysis of HUGO identifiers from PID. (C) Over-representation analysis of HUGO identifiers from ACSN. Red boxes are common GO terms between PID and ACSN models.
Fig 5
Fig 5. The PID and ACSN models are enriched in EMT genes.
(A) Gene set enrichment analysis (GSEA) of the 215 genes (HUGO identifiers) common to PID and ACSN models. (B) Venn diagram describing the intersection between genes in PID and ACSN Cadbiom models and the EMT gene set from the MSigDB collection.
Fig 6
Fig 6. Comparison of EMT gene trajectories in the PID and ACSN models.
(A) Analysis of 23 gene queries (phenotypes) in the PID and ACSN Cadbiom models. The first and second columns correspond to the HUGO and database identifiers, respectively. The third column describes the number of trajectories leading to the phenotype. The fourth column describes the number of controllers. The fifth column describes the number of nodes in all trajectories leading to the phenotype. The sixth column describes the ratio of the number of nodes in all trajectories to the number of controllers. Rows highlighted in green correspond to phenotypes with a high number of trajectories (from 96 to 400), grey rows correspond to phenotypes with an intermediate number of trajectories (from 6 to 42) and uncolored rows correspond to phenotypes with less than 3 trajectories. (B and C) Comparison of the trajectories to activate the CXCL12 gene in the ACSN (B) and PID (C) Cadbiom models. Graphical representations of trajectories. Red nodes are cadbiom model boundaries of the model. Grey nodes are basic entities/intermediate molecules which are not at the periphery of the model. Blue nodes denote reaction in which there are more than one reagent or one reactant (many-to-many or one-to-many relationships between reactants). White nodes are inhibitors, they are never in the solutions nor in the trajectories; their presence rule out the production/activation of molecules of interest. Grey arrows are unary reactions (one-to-one relationship). Red arrows are inhibitions and green arrows are activations (control reactions).
Fig 7
Fig 7. Analysis of trajectories obtained from PERP and MMP2 independent queries.
(A) & (C): Clustering analysis of trajectories based on controllers. PERP query (A) returns 10 trajectories including 17 controllers and MMP2 query (B) returns 400 trajectories including 101 controllers.(B) & (D): Graphical representation of the trajectories resulting from PERP (B) and MMP2 (D) queries. Red nodes are the cadbiom model boundaries. Grey nodes are the basic entities/intermediate molecules that are not at the boundary model. The blue nodes are reaction nodes that are only displayed when there is more than one reagent or one reactant in a reaction (many-to-many or one-to-many relationship between reactants). The white nodes are the inhibitors, they are never in the solutions nor in the trajectories. Their presence is forbidden for the production/activation of the molecules of interest. The grey arrows are the reactions (unary reactions) (one-to-one relationship). The red arrows are inhibitions and the green arrows are activations (reaction controls).
Fig 8
Fig 8. Analysis of trajectories obtained from the “PERPandMMP2” query.
(A) Clustering analysis of trajectories based on controllers (400 trajectories and 98 controllers). (B) Venn diagram describing the intersection between controllers obtained from MMP2, PERP and “PERP and MMP2” queries. (C) Graphical representation of the 400 trajectories.

References

    1. Chowdhury S, Sarkar RR. Comparison of Human Cell Signaling Pathway Databases–Evolution, Drawbacks and Challenges. Database: The Journal of Biological Databases and Curation. 2015;2015. doi: 10.1093/database/bau126 - DOI - PMC - PubMed
    1. Albert R, Thakar J. Boolean Modeling: A Logic-Based Dynamic Approach for Understanding Signaling and Regulatory Networks and for Making Useful Predictions. Wiley Interdisciplinary Reviews Systems Biology and Medicine. 2014. Sep-Oct;6(5):353–369. doi: 10.1002/wsbm.1273 - DOI - PubMed
    1. Le Novère N. Quantitative and Logic Modelling of Molecular and Gene Networks. Nature Reviews Genetics. 2015;16(3):146–158. doi: 10.1038/nrg3885 - DOI - PMC - PubMed
    1. Gonzalez AG, Naldi A, Sánchez L, Thieffry D, Chaouiya C. GINsim: A Software Suite for the Qualitative Modelling, Simulation and Analysis of Regulatory Networks. Bio Systems. 2006;84(2):91–100. doi: 10.1016/j.biosystems.2005.10.003 - DOI - PubMed
    1. Terfve C, Cokelaer T, Henriques D, MacNamara A, Goncalves E, Morris MK, et al.. CellNOptR: A Flexible Toolkit to Train Protein Signaling Networks to Data Using Multiple Logic Formalisms. BMC systems biology. 2012;6:133. doi: 10.1186/1752-0509-6-133 - DOI - PMC - PubMed

Publication types