. 2022 Nov 21;145(11):3816-3831.
doi: 10.1093/brain/awac210.

The gain of function SCN1A disorder spectrum: novel epilepsy phenotypes and therapeutic implications

Affiliations

The gain of function SCN1A disorder spectrum: novel epilepsy phenotypes and therapeutic implications

Andreas Brunklaus et al. Brain. .

Abstract

Brain voltage-gated sodium channel NaV1.1 (SCN1A) loss-of-function variants cause the severe epilepsy Dravet syndrome, as well as milder phenotypes associated with genetic epilepsy with febrile seizures plus. Gain of function SCN1A variants are associated with familial hemiplegic migraine type 3. Novel SCN1A-related phenotypes have been described including early infantile developmental and epileptic encephalopathy with movement disorder, and more recently neonatal presentations with arthrogryposis. Here we describe the clinical, genetic and functional evaluation of affected individuals. Thirty-five patients were ascertained via an international collaborative network using a structured clinical questionnaire and from the literature. We performed whole-cell voltage-clamp electrophysiological recordings comparing sodium channels containing wild-type versus variant NaV1.1 subunits. Findings were related to Dravet syndrome and familial hemiplegic migraine type 3 variants. We identified three distinct clinical presentations differing by age at onset and presence of arthrogryposis and/or movement disorder. The most severely affected infants (n = 13) presented with congenital arthrogryposis, neonatal onset epilepsy in the first 3 days of life, tonic seizures and apnoeas, accompanied by a significant movement disorder and profound intellectual disability. Twenty-one patients presented later, between 2 weeks and 3 months of age, with a severe early infantile developmental and epileptic encephalopathy and a movement disorder. One patient presented after 3 months with developmental and epileptic encephalopathy only. Associated SCN1A variants cluster in regions of channel inactivation associated with gain of function, different to Dravet syndrome variants (odds ratio = 17.8; confidence interval = 5.4-69.3; P = 1.3 × 10⁻⁷). Functional studies of both epilepsy and familial hemiplegic migraine type 3 variants reveal alterations of gating properties in keeping with neuronal hyperexcitability. While epilepsy variants result in a moderate increase in action current amplitude consistent with mild gain of function, familial hemiplegic migraine type 3 variants induce a larger effect on gating properties, in particular the increase of persistent current, resulting in a large increase of action current amplitude, consistent with stronger gain of function. Clinically, 13 out of 16 (81%) gain of function variants were associated with a reduction in seizures in response to sodium channel blocker treatment (carbamazepine, oxcarbazepine, phenytoin, lamotrigine or lacosamide) without evidence of symptom exacerbation. Our study expands the spectrum of gain of function SCN1A-related epilepsy phenotypes, defines key clinical features, provides novel insights into the underlying disease mechanisms between SCN1A-related epilepsy and familial hemiplegic migraine type 3, and identifies sodium channel blockers as potentially efficacious therapies. Gain of function disease should be considered in early onset epilepsies with a pathogenic SCN1A variant and non-Dravet syndrome phenotype.

Keywords: SCN1A; arthrogryposis; epilepsy; gain of function; movement disorder.


Figures

Figure 1
Figure 1
Distribution of early onset DEE versus Dravet syndrome SCN1A variants. Transmembrane voltage-gated sodium channel NaV1.1 protein structure in side view with central pore region and pore-loop located at the top (extracellular). Inactivation sites (S4–5 and D3–4 linkers) are located at the bottom (intracellular). (A) Early onset DEE missense variants are illustrated in blue. (B) Dravet syndrome missense variants are illustrated in red. Early onset DEE variants cluster in regions of channel inactivation (S4–5 and D3–4 linkers) whereas Dravet syndrome variants are frequently located in pore regions (S5–6) (OR = 17.8; CI = 5.4–69.3; P = 1.3 × 10⁻⁷).
Figure 2
Figure 2
Features of arthrogryposis in affected individuals. (A and B) (Patient 4) Contractures in both feet and upper limbs. Right humerus is posteriorly dislocated and left shoulder dysplastic. There are contractures in elbows, wrists and fingers. Ankles are mobile, but a vertical talus can be palpitated. Vertical talus was treated with repeated casting and Achilles tenotomy during infancy. Congenital scoliosis has been treated by prolonged plaster casting/corset and hip subluxation has been corrected surgically. (C and D) (Patient 3) Bilateral elbow contractures. (E) (Patient 1) Hand and finger contractures.
Figure 3
Figure 3
2D representation of GOF variant phenotypes across the SCN1A protein. The alpha subunit consists of four homologous domains (D1–4) each formed of six transmembrane segments (S1–S6). Segment 4 represents the voltage sensor and segments S5–6 the pore region. Individual missense variants are displayed as different coloured circles according to phenotype: Pink denotes NDEEMA, brown denotes EIDEE/MD, amber denotes DEE and blue denotes FHM3. Functionally studied variants are framed in red.
Figure 4
Figure 4
3D representation of GOF SCN1A variants. 3D SCN1A protein structure in side (top left) and bottom view (bottom left and right—enlarged). Individual missense variants are displayed as different coloured circles according to phenotype. Pink denotes NDEEMA, brown denotes EIDEE/MD, amber denotes DEE and blue denotes FHM3. Functionally studied variants are framed in red. NDEEMA variants are more frequently observed in the S4–5 linker regions compared to FHM3 variants that are clustered in the D3–4 linker region (n = 24; z = −3.8; r = 0.81; P = 8.2 × 10⁻⁵).
Figure 5
Figure 5
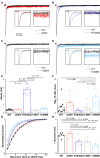
Effects of p.I236V, p.R1636Q, p.I1498M and p.I1498T on voltage-dependent properties of the hNav1.1 channel. Representative whole-cell Na+ current families for hNav1.1-WT. (A) hNav1.1-I236V, (B) hNav1.1-R1636Q, (C) hNav1.1-I1498T, (D and E) hNav1.1-I1498M, recorded with 100-ms-long depolarizing voltage steps from −80 to +60 mV in 5 mV increments from a holding potential of −100 mV. Scale bars = 1 nA, 2 ms. (F) Maximal current density calculated for cells transfected with the WT or the mutants. (G) Mean voltage dependence of activation, lines are mean Boltzmann fits. (H) Mean voltage dependence of fast inactivation, lines are mean Boltzmann fits. Comparison of mean normalized currents elicited with a 150-ms-long depolarizing step to −10 mV from a holding potential of −100 mV. Data are shown as mean ± SEM. *P < 0.05; ****P < 0.0001.
Figure 6
Figure 6
Effects on kinetic properties and persistent current. (A) hNav1.1-WT (black) and hNav1.1-I236V (red), (B) hNav1.1 (black) and hNav1.1-R1636Q (blue), (C) hNav1.1 (black) and hNav1.1-I1498T (light green), (D) hNav1.1-WT (black) and hNav1.1-I1498M (dark green). Scale bar = 10 ms. The left insets show a 6-ms window of the current traces to compare the current decay and the right insets show the traces between 73.5 and 78.5 ms to compare INap. (E) Time constant (τ in ms) of the current decay at −10 mV (single exponential fits at the indicated potentials). (F) Quantification of persistent current between 73.5 and 78.5 ms of the 150-ms-long depolarizing step. (G) Kinetics of recovery from fast inactivation at −80 mV and (H) time constant (τ in ms) of recovery obtained from the exponential fit of the recovery curves. Data are shown as mean ± SEM.
Figure 7
Figure 7
Comparison of the functional effects of epilepsy and FHM3 NaV1.1 variants. The modifications in the studied functional parameters are summarized with radar plots for the variants investigated and for three additional FHM3 variants (Q1489K, L1649Q and L1670W) that we previously investigated. To compare meaningful biological modifications, we displayed fold changes in current or conductance in comparison with WT hNaV1.1 for each of the functional parameters that we considered. Thus, values >1 are GOF, values <1 are LOF. CD = maximal current density; VD Act = voltage dependence of activation expressed as fold change in normalized conductance at Va; VD Ina = voltage dependence of inactivation expressed as fold change in normalized conductance at Vh; I at t 50% act (−10 mV) = activation kinetics expressed as fold changes in the current elicited by a −10 mV voltage step at t corresponding to 50% Imax of WT hNaV1.1; I @ 1 ms = kinetics of current decay quantified as fold changes in the current recorded 1 ms after the beginning of a voltage step to −10 mV; Ipers = persistent current; I @ 5 ms rec = kinetics of recovery from fast inactivation expressed as fold changes in current after 5 ms of recovery at −80 mV. KDFI = kinetics of development of fast inactivation. Holding potential was −100 mV for all the conditions. Slope factors of activation and inactivation were not included because their modifications do not directly induce net gain or LOF effects.
Figure 8
Figure 8
Overall effect of the variants evaluated with action potential-clamp experiments. Action Na+ currents (expressed as mean of conductance, error bars are not shown for clarity) recorded using as voltage stimulus an action potential discharge (A) recorded in a neuron in neocortical slices for (B) hNav1.1-WT, (C) hNav1.1-I236V, (D) hNav1.1-R1636Q, (E) hNav1.1-I1498T and (F) hNav1.1-I1498M. Scale bar = 20 ms. (G) Comparison of the current density of the first action current. (H) Comparison of the current density of the mean of the three last action currents. Data are shown as mean ± SEM.

References

    1. Mantegazza M, Cestèle S, Catterall WA. Sodium channelopathies of skeletal muscle and brain. Physiol Rev. 2021;101:1633–1689. - PMC - PubMed
    1. Claes L, Del-Favero J, Ceulemans B, Lagae L, Van Broeckhoven C, De Jonghe P. De novo mutations in the sodium-channel gene SCN1A cause severe myoclonic epilepsy of infancy. Am J Hum Genet. 2001;68:1327–1332. - PMC - PubMed
    1. Wolff M, Johannesen KM, Hedrich UBS, et al. . Genetic and phenotypic heterogeneity suggest therapeutic implications in SCN2A-related disorders. Brain. 2017;140:1316–1336. - PubMed
    1. Larsen J, Carvill GL, Gardella E, et al. . The phenotypic spectrum of SCN8A encephalopathy. Neurology. 2015;84:480–489. - PMC - PubMed
    1. Veeramah KR, O’Brien JE, Meisler MH, et al. . De novo pathogenic SCN8A mutation identified by whole-genome sequencing of a family quartet affected by infantile epileptic encephalopathy and SUDEP. Am J Hum Genet. 2012;90:502–510. - PMC - PubMed

Publication types

Substances

Supplementary concepts