

Cyanine Phototruncation Enables Spatiotemporal Cell Labeling
- PMID: 35696546
- PMCID: PMC10523398
- DOI: 10.1021/jacs.2c02962
Cyanine Phototruncation Enables Spatiotemporal Cell Labeling
Abstract
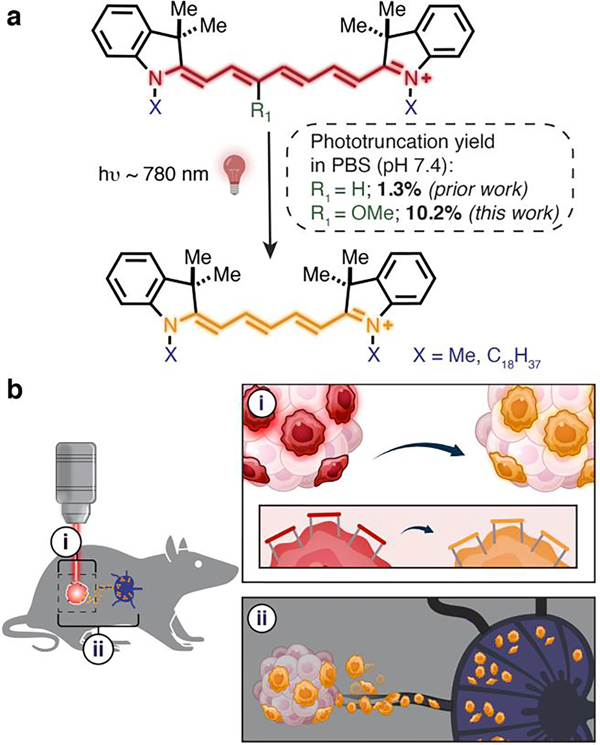
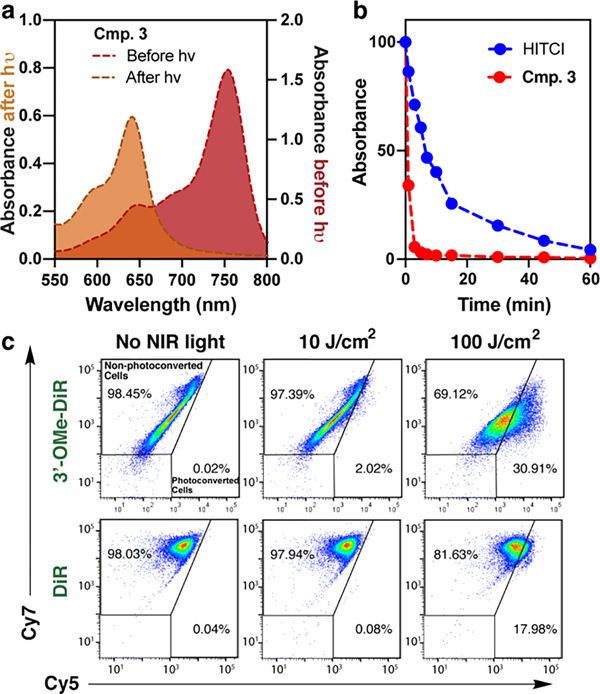
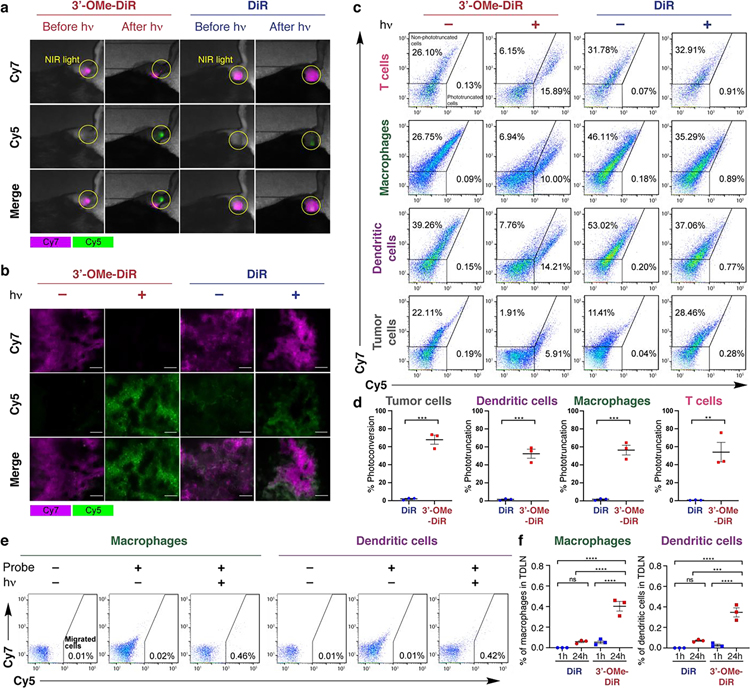
Photoconvertible tracking strategies assess the dynamic migration of cell populations. Here we develop phototruncation-assisted cell tracking (PACT) and apply it to evaluate the migration of immune cells into tumor-draining lymphatics. This method is enabled by a recently discovered cyanine photoconversion reaction that leads to the two-carbon truncation and consequent blue-shift of these commonly used probes. By examining substituent effects on the heptamethine cyanine chromophore, we find that introduction of a single methoxy group increases the yield of the phototruncation reaction in neutral buffer by almost 8-fold. When converted to a membrane-bound cell-tracking variant, this probe can be applied in a series of in vitro and in vivo experiments. These include quantitative, time-dependent measurements of the migration of immune cells from tumors to tumor-draining lymph nodes. Unlike previously reported cellular photoconversion approaches, this method does not require genetic engineering and uses near-infrared (NIR) wavelengths. Overall, PACT provides a straightforward approach to label cell populations with spatiotemporal control.
Figures
Similar articles
-
Phototruncation cell tracking with near-infrared photoimmunotherapy using heptamethine cyanine dye to visualise migratory dynamics of immune cells.EBioMedicine. 2024 Apr;102:105050. doi: 10.1016/j.ebiom.2024.105050. Epub 2024 Mar 14. EBioMedicine. 2024. PMID: 38490105 Free PMC article.
-
Harnessing Cyanine Reactivity for Optical Imaging and Drug Delivery.Acc Chem Res. 2018 Dec 18;51(12):3226-3235. doi: 10.1021/acs.accounts.8b00384. Epub 2018 Nov 12. Acc Chem Res. 2018. PMID: 30418020
-
Counterion influence on near-infrared-II heptamethine cyanine salts for photothermal therapy.Bioorg Chem. 2024 Apr;145:107206. doi: 10.1016/j.bioorg.2024.107206. Epub 2024 Feb 13. Bioorg Chem. 2024. PMID: 38367428
-
Research progress of near-infrared fluorescence probes based on indole heptamethine cyanine dyes in vivo and in vitro.BMC Chem. 2020 Mar 30;14(1):21. doi: 10.1186/s13065-020-00677-3. eCollection 2020 Dec. BMC Chem. 2020. PMID: 32259133 Free PMC article. Review.
-
Recent progress on near-infrared fluorescence heptamethine cyanine dye-based molecules and nanoparticles for tumor imaging and treatment.Wiley Interdiscip Rev Nanomed Nanobiotechnol. 2023 Sep-Oct;15(5):e1910. doi: 10.1002/wnan.1910. Epub 2023 Jun 12. Wiley Interdiscip Rev Nanomed Nanobiotechnol. 2023. PMID: 37305979 Review.
Cited by
-
Thermal Truncation of Heptamethine Cyanine Dyes.J Am Chem Soc. 2024 Jul 24;146(29):19768-19781. doi: 10.1021/jacs.4c02116. Epub 2024 Jul 12. J Am Chem Soc. 2024. PMID: 38995720 Free PMC article.
-
Mechanistic Insight into the Thermal "Blueing" of Cyanine Dyes.J Am Chem Soc. 2024 Jul 24;146(29):19756-19767. doi: 10.1021/jacs.4c02171. Epub 2024 Jul 11. J Am Chem Soc. 2024. PMID: 38989979 Free PMC article.
-
Synthesis of Near-Infrared-Absorbing Anionic Heptamethine Cyanine Dyes with Trifluoromethyl Groups.Molecules. 2023 Jun 8;28(12):4650. doi: 10.3390/molecules28124650. Molecules. 2023. PMID: 37375210 Free PMC article.
-
Styrylpyridinium Derivatives for Fluorescent Cell Imaging.Pharmaceuticals (Basel). 2023 Sep 4;16(9):1245. doi: 10.3390/ph16091245. Pharmaceuticals (Basel). 2023. PMID: 37765053 Free PMC article.
-
A stable and biocompatible shortwave infrared nanoribbon for dual-channel in vivo imaging.Nat Commun. 2025 Jan 2;16(1):4. doi: 10.1038/s41467-024-55445-x. Nat Commun. 2025. PMID: 39747028 Free PMC article.
References
-
- Luster AD; Alon R; von Andrian UH, Immune cell migration in inflammation: present and future therapeutic targets. Nat. Immunol. 2005, 6 (12), 1182–1190. - PubMed
-
- Marzo AL; Lake RA; Lo D; Sherman L; McWilliam A; Nelson D; Robinson BW; Scott B, Tumor antigens are constitutively presented in the draining lymph nodes. J. Immunol. 1999, 162 (10), 5838–5845. - PubMed
Publication types
MeSH terms
Substances
Grants and funding
LinkOut - more resources
Full Text Sources
Medical
Miscellaneous
