Antiactivators prevent self-sensing in Pseudomonas aeruginosa quorum sensing
- PMID: 35696568
- PMCID: PMC9231504
- DOI: 10.1073/pnas.2201242119
Antiactivators prevent self-sensing in Pseudomonas aeruginosa quorum sensing
Abstract
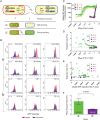
Quorum sensing is described as a widespread cell density-dependent signaling mechanism in bacteria. Groups of cells coordinate gene expression by secreting and responding to diffusible signal molecules. Theory, however, predicts that individual cells may short-circuit this mechanism by directly responding to the signals they produce irrespective of cell density. In this study, we characterize this self-sensing effect in the acyl-homoserine lactone quorum sensing system of Pseudomonas aeruginosa. We show that antiactivators, a set of proteins known to affect signal sensitivity, function to prevent self-sensing. Measuring quorum-sensing gene expression in individual cells at very low densities, we find that successive deletion of antiactivator genes qteE and qslA produces a bimodal response pattern, in which increasing proportions of constitutively induced cells coexist with uninduced cells. Comparing responses of signal-proficient and -deficient cells in cocultures, we find that signal-proficient cells show a much higher response in the antiactivator mutant background but not in the wild-type background. Our results experimentally demonstrate the antiactivator-dependent transition from group- to self-sensing in the quorum-sensing circuitry of P. aeruginosa. Taken together, these findings extend our understanding of the functional capacity of quorum sensing. They highlight the functional significance of antiactivators in the maintenance of group-level signaling and experimentally prove long-standing theoretical predictions.
Keywords: Pseudomonas aeruginosa; acyl-homoserine lactone; antiactivation; quorum sensing; self-sensing.
Conflict of interest statement
The authors declare no competing interest.
Figures


Similar articles
-
Positive Autoregulation of an Acyl-Homoserine Lactone Quorum-Sensing Circuit Synchronizes the Population Response.mBio. 2017 Jul 25;8(4):e01079-17. doi: 10.1128/mBio.01079-17. mBio. 2017. PMID: 28743819 Free PMC article.
-
The Pseudomonas aeruginosa Orphan Quorum Sensing Signal Receptor QscR Regulates Global Quorum Sensing Gene Expression by Activating a Single Linked Operon.mBio. 2018 Aug 28;9(4):e01274-18. doi: 10.1128/mBio.01274-18. mBio. 2018. PMID: 30154259 Free PMC article.
-
Quorum sensing regulates denitrification in Pseudomonas aeruginosa PAO1.J Bacteriol. 2007 Jul;189(13):4969-72. doi: 10.1128/JB.00289-07. Epub 2007 Apr 20. J Bacteriol. 2007. PMID: 17449629 Free PMC article.
-
An evolving perspective on the Pseudomonas aeruginosa orphan quorum sensing regulator QscR.Front Cell Infect Microbiol. 2014 Oct 28;4:152. doi: 10.3389/fcimb.2014.00152. eCollection 2014. Front Cell Infect Microbiol. 2014. PMID: 25389523 Free PMC article. Review.
-
The third quorum-sensing system of Pseudomonas aeruginosa: Pseudomonas quinolone signal and the enigmatic PqsE protein.J Med Microbiol. 2020 Jan;69(1):25-34. doi: 10.1099/jmm.0.001116. J Med Microbiol. 2020. PMID: 31794380 Review.
Cited by
-
1H-Pyrrole-2,5-dicarboxylic acid, a quorum sensing inhibitor from one endophytic fungus in Areca catechu L., acts as antibiotic accelerant against Pseudomonas aeruginosa.Front Cell Infect Microbiol. 2024 Jul 2;14:1413728. doi: 10.3389/fcimb.2024.1413728. eCollection 2024. Front Cell Infect Microbiol. 2024. PMID: 39015339 Free PMC article.
-
DegQ is an important policing link between quorum sensing and regulated adaptative traits in Bacillus subtilis.Microbiol Spectr. 2023 Sep 7;11(5):e0090823. doi: 10.1128/spectrum.00908-23. Online ahead of print. Microbiol Spectr. 2023. PMID: 37676037 Free PMC article.
-
RsaM: a unique dominant regulator of AHL quorum sensing in bacteria.Microbiology (Reading). 2023 Nov;169(11):001417. doi: 10.1099/mic.0.001417. Microbiology (Reading). 2023. PMID: 38010341 Free PMC article.
-
Control of bacterial quorum threshold for metabolic homeostasis and cooperativity.Microbiol Spectr. 2024 Jan 11;12(1):e0335323. doi: 10.1128/spectrum.03353-23. Epub 2023 Dec 12. Microbiol Spectr. 2024. PMID: 38084969 Free PMC article.
-
Parameters, architecture and emergent properties of the Pseudomonas aeruginosa LasI/LasR quorum-sensing circuit.J R Soc Interface. 2023 Mar;20(200):20220825. doi: 10.1098/rsif.2022.0825. Epub 2023 Mar 15. J R Soc Interface. 2023. PMID: 36919437 Free PMC article.
References
-
- Waters C. M., Bassler B. L., Quorum sensing: Cell-to-cell communication in bacteria. Annu. Rev. Cell Dev. Biol. 21, 319–346 (2005). - PubMed
-
- Asfahl K. L., Schuster M., Social interactions in bacterial cell-cell signaling. FEMS Microbiol. Rev. 41, 92–107 (2017). - PubMed
-
- Schuster M., Sexton D. J., Diggle S. P., Greenberg E. P., Acyl-homoserine lactone quorum sensing: From evolution to application. Annu. Rev. Microbiol. 67, 43–63 (2013). - PubMed
Publication types
MeSH terms
Substances
LinkOut - more resources
Full Text Sources
Other Literature Sources

