. 2022 Jun 21;119(25):e2203179119.
doi: 10.1073/pnas.2203179119. Epub 2022 Jun 13.

Transcriptional and functional motifs defining renal function revealed by single-nucleus RNA sequencing

Affiliations

Transcriptional and functional motifs defining renal function revealed by single-nucleus RNA sequencing

Jun Xu et al. Proc Natl Acad Sci U S A. .

Abstract

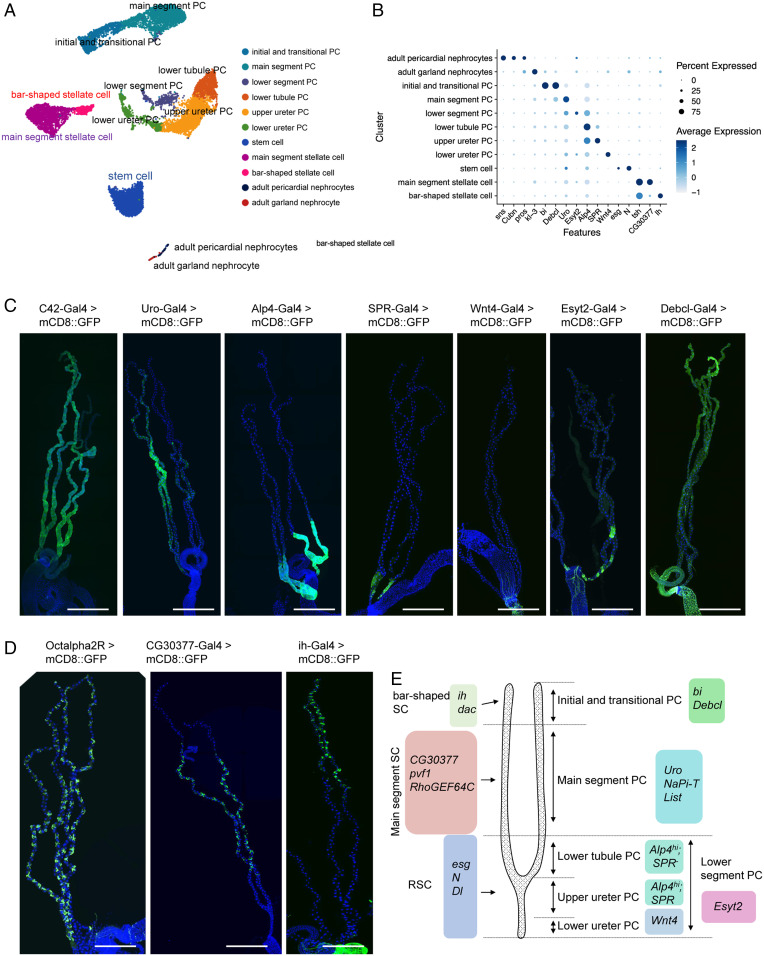
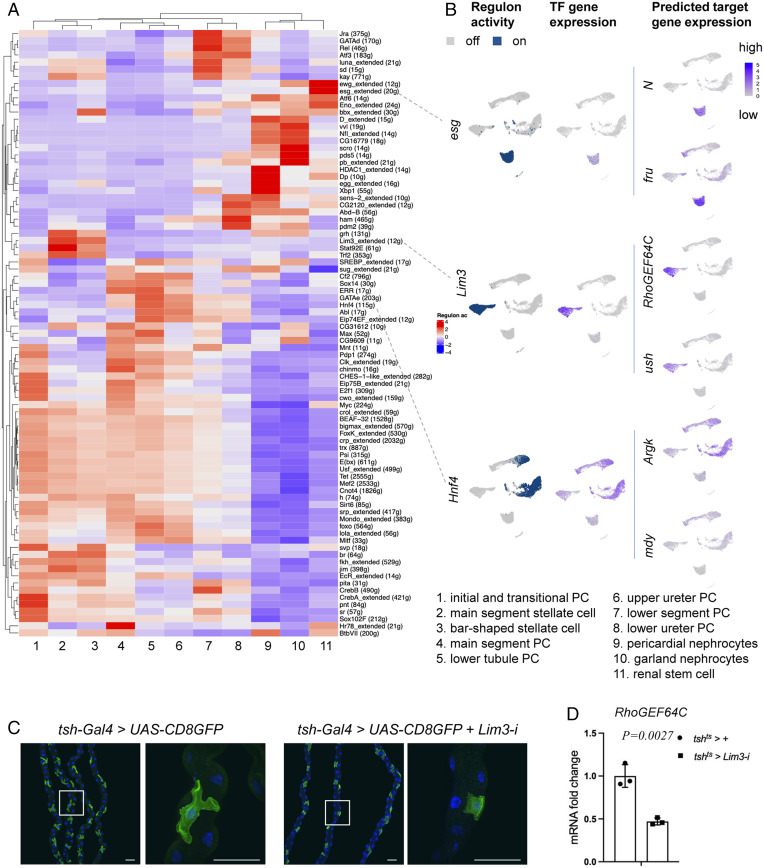
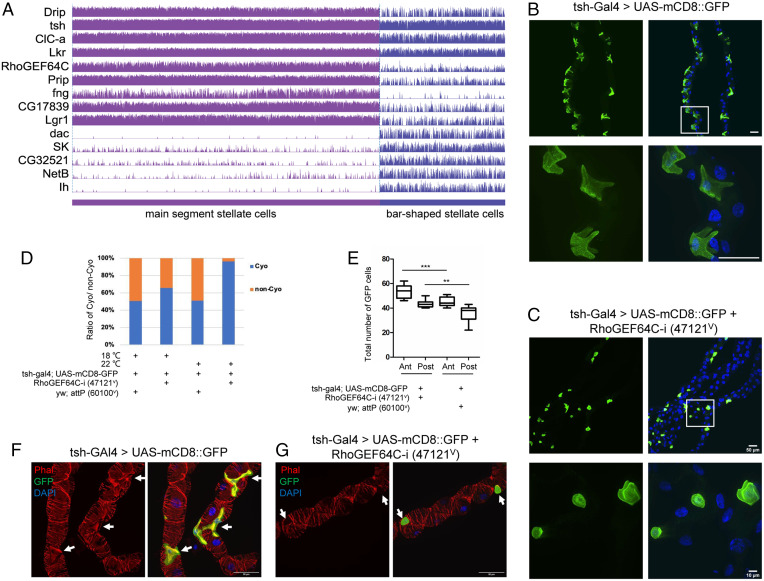
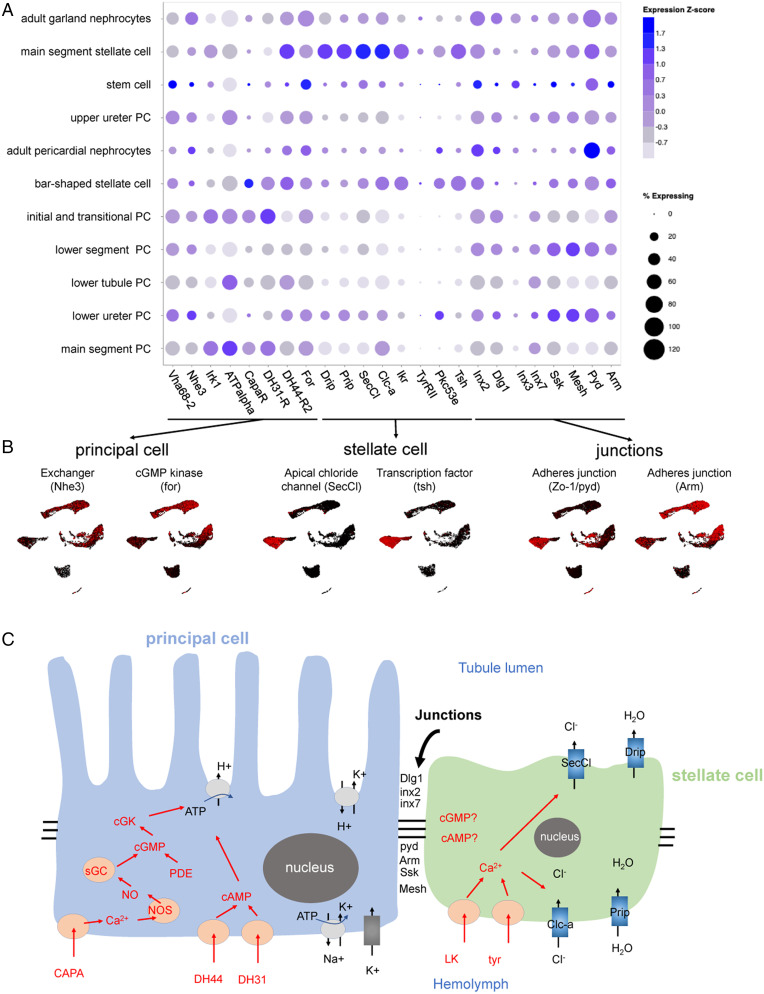
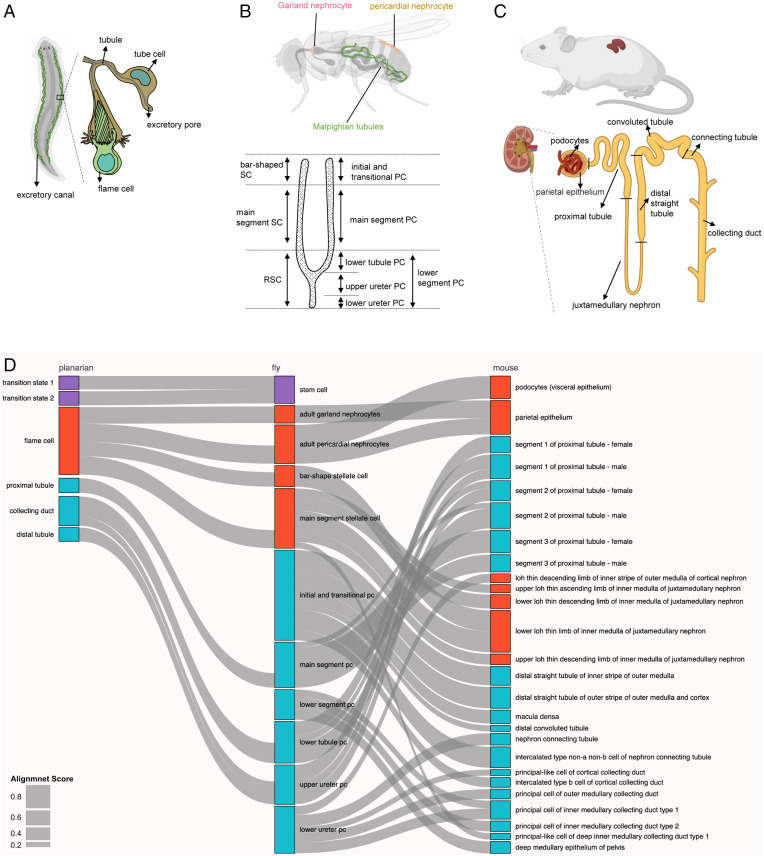
Recent advances in single-cell sequencing provide a unique opportunity to gain novel insights into the diversity, lineage, and functions of cell types constituting a tissue/organ. Here, we performed a single-nucleus study of the adult Drosophila renal system, consisting of Malpighian tubules and nephrocytes, which shares similarities with the mammalian kidney. We identified 11 distinct clusters representing renal stem cells, stellate cells, regionally specific principal cells, garland nephrocyte cells, and pericardial nephrocytes. Characterization of the transcription factors specific to each cluster identified fruitless (fru) as playing a role in stem cell regeneration and Hepatocyte nuclear factor 4 (Hnf4) in regulating glycogen and triglyceride metabolism. In addition, we identified a number of genes, including Rho guanine nucleotide exchange factor at 64C (RhoGEF64c), Frequenin 2 (Frq2), Prip, and CG1093 that are involved in regulating the unusual star shape of stellate cells. Importantly, the single-nucleus dataset allows visualization of the expression at the organ level of genes involved in ion transport and junctional permeability, providing a systems-level view of the organization and physiological roles of the tubules. Finally, a cross-species analysis allowed us to match the fly kidney cell types to mouse kidney cell types and planarian protonephridia, knowledge that will help the generation of kidney disease models. Altogether, our study provides a comprehensive resource for studying the fly kidney.

Keywords: Malpighian tubules; cross-species; kidney disease; nephrocytes; snRNA-seq.


Conflict of interest statement

The authors declare no competing interest.

Figures

Fig. 1.
Fig. 1.
snRNA-seq analysis and markers identification of the fly adult kidney. (A) A single UMAP of the “fly kidney” contains 11 distinct cell clusters that were annotated on the UMAP. Note, however, that nephrocytes and tubules are not physically associated in vivo. (B) Expression levels and percentage of cells expressing the marker genes in each cluster are shown as a dot plot. (C and D) GFP expression under the control of Gal4 lines specific for each of the principal cell (PC) and stellate cell (SC) clusters. Note that the Gal4 expression patterns of SPR, Wnt4, Esyt2, Debcl, Octalpha2R, CG30377, and ih have not been previously reported. (Scale bars, 500 μm.) (E) Malpighian tubule cell types are identified based on differentially expressed marker genes.
Fig. 2.
Fig. 2.
Cell-type–specific gene regulatory landscape of the fly kidney. (A) SCENIC results of the fly kidney. The heatmap shows the gene-expression level in each cluster. Low regulon activity is shown with blue color and high regulon activity is shown in red. See SI Appendix, Fig. S8 for an enlarged version of the heat map with gene names. (B) UMAP depiction of regulon activity (“on-blue,” “off-gray”) and TF gene expression (blue scale) of renal stem cells (esg), stellate cells (Lim3), and principal cells (Hnf4). Examples of target gene expression of the esg regulon (N and fru), Lim3 regulon (RhoGEF64C and u-shaped [ush]), and Hnf4 regulon (Argk and mdy) are shown in blue. (C) Stellate cell shape phenotype associated with RNAi knockdown of Lim3. DAPI (blue) staining for nuclei. (Scale bars, 50 μm.) (D) qPCR results show the RhoGEF64C mRNA fold change of tshts > + and tshts > Lim3-i in the Malpighian tubules for 8 d.
Fig. 3.
Fig. 3.
RhoGEF64c maintains stellate cell shape. (A) Gene-expression levels of selected markers specifically expressed in stellate cells. (B) Cell shape visualized using tsh-Gal4 driving mCD8-GFP. DAPI (blue) is used to stain nuclei. White box indicates the zoom-in region. (Scale bars, 50 μm.) (C) Knockdown using VDRC line 47121v of RhoGEF64c affects stellate cell shapes. (Scale bars, 50 μm and 10 μm.) (D) Survival of RhoGEF64c knockdown (47121v) and control (60100v) animals. Statistics of CyO or non-CyO flies from the adult progenies RhoGEF64c knockdown and control raised at 18 °C and 22 °C. (E) Statistics of cell number of stellate cells (GFP+) of in RhoGEF64c knockdown and control flies. “Ant” means anterior Malpighian tubules and “post” means posterior Malpighian tubules. Data are presented as means ± SEM. **P < 0.01, ***P < 0.001. (F and G) Knockdown of RhoGEF64c results in loss of cytoarchitectural organization. Cell cytoarchitecture is visualized by Phalloidin (Phal; F-actin) staining. Arrows indicate SCs. (Scale bars, 50 μm.)
Fig. 4.
Fig. 4.
Mapping function to cell types and regions in the tubule. (A and B) t-Distributed stochastic neighbor embedding (tSNE) and UMAP distribution of genes involved in principal cell, stellate cell, and junctions. (C) Overview of the two-cell model of insect tubule fluid secretion and its control. Adapted from ref. (84).
Fig. 5.
Fig. 5.
Cross-species analysis of fly, planarian, and mouse kidneys using SAMap. (AC) The cartoons show the structure of the kidneys of three species. The planaria excretory canal contains tubule cells and flame cells. The fly kidney contains Malpighian tubules and two types of nephrocytes. The mouse kidney unit contains collecting duct, connecting tubule, convoluted tubule, distal straight tubule, juxtamedullary nephron, proximal tubule, podocytes, and parietal epithelium. (D) Sankey plot summarizing the cell-type mappings. Edges with alignment scores < 0.1 were omitted. Nonstem cell types are arranged along the proximal-distal axis. Magenta: stem cell types; red: ultrafiltration cell types; blue: resorption cell types.

Similar articles

Cited by

References

    1. Nielsen S., Kwon T. H., Fenton R. A., Praetorious J., “Anatomy of the kidney” in Brenner & Rector’s the Kidney, Taal M. W., et al., Eds. (Elsevier/Saunders, ed. 9, 2012), pp. 31–93.
    1. Denholm B., Skaer H., Bringing together components of the fly renal system. Curr. Opin. Genet. Dev. 19, 526–532 (2009). - PMC - PubMed
    1. McMahon A. P., Development of the mammalian kidney. Curr. Top. Dev. Biol. 117, 31–64 (2016). - PMC - PubMed
    1. Miller J., et al. , Drosophila melanogaster as an emerging translational model of human nephrolithiasis. J. Urol. 190, 1648–1656 (2013). - PMC - PubMed
    1. Helmstädter M., Huber T. B., Hermle T., Using the Drosophila nephrocyte to model podocyte function and disease. Front Pediatr. 5, 262 (2017). - PMC - PubMed

Publication types

MeSH terms