. 2022 Jun 21;119(25):e2119281119.
doi: 10.1073/pnas.2119281119. Epub 2022 Jun 13.

Revealing the recent demographic history of Europe via haplotype sharing in the UK Biobank

Affiliations

Revealing the recent demographic history of Europe via haplotype sharing in the UK Biobank

Edmund Gilbert et al. Proc Natl Acad Sci U S A. .

Abstract

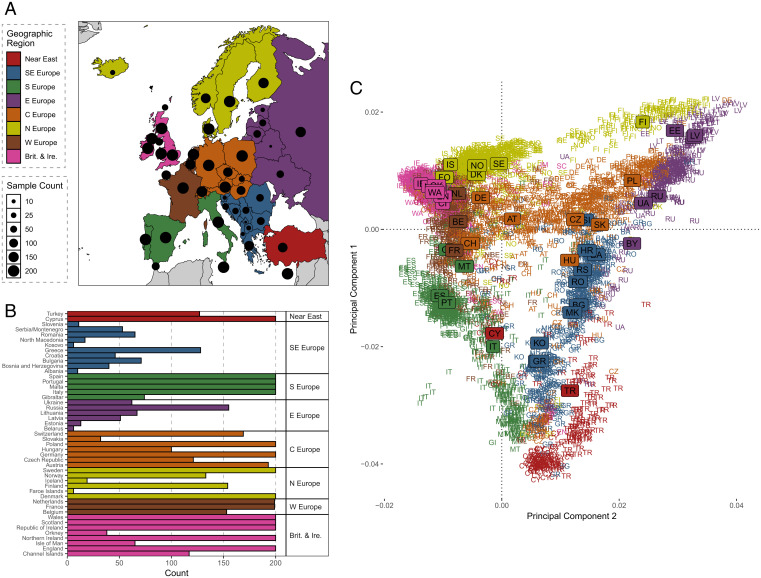
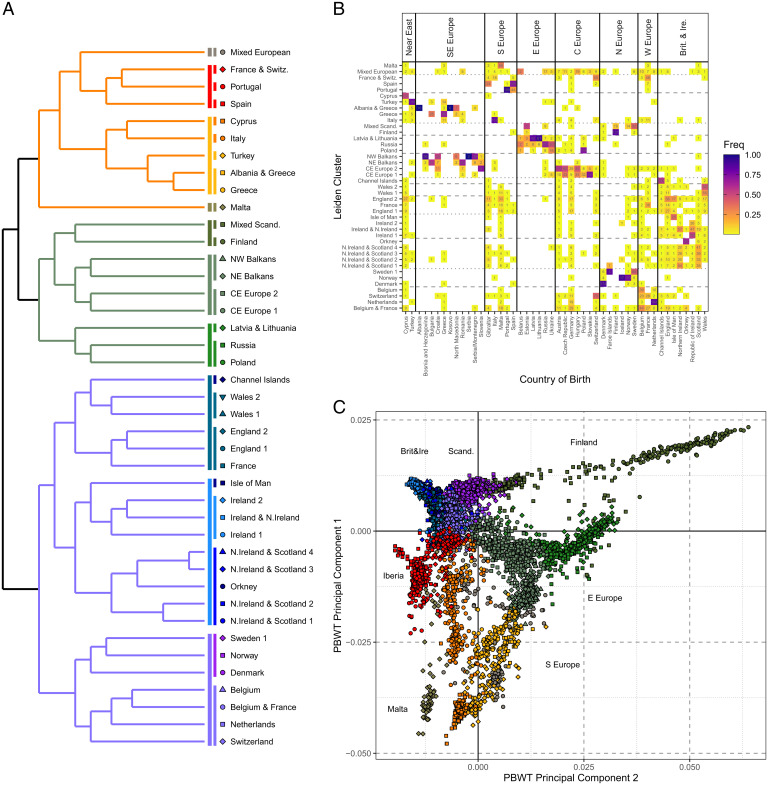
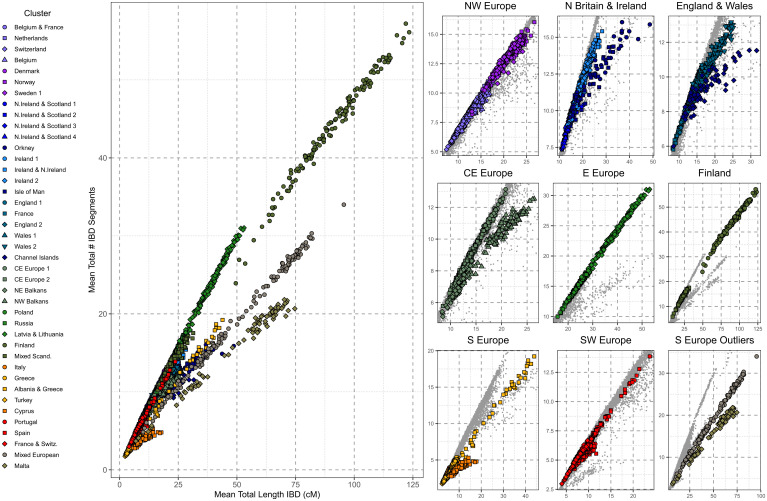
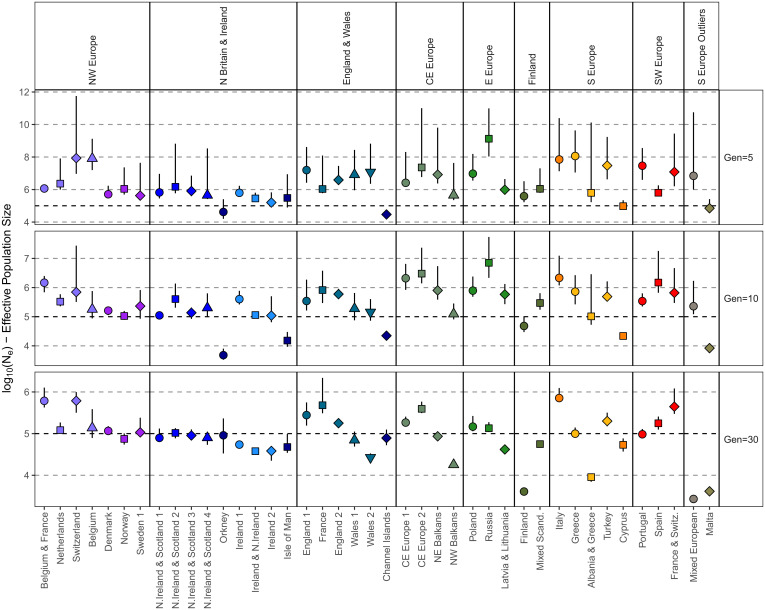
Haplotype-based analyses have recently been leveraged to interrogate the fine-scale structure in specific geographic regions, notably in Europe, although an equivalent haplotype-based understanding across the whole of Europe with these tools is lacking. Furthermore, study of identity-by-descent (IBD) sharing in a large sample of haplotypes across Europe would allow a direct comparison between different demographic histories of different regions. The UK Biobank (UKBB) is a population-scale dataset of genotype and phenotype data collected from the United Kingdom, with established sampling of worldwide ancestries. The exact content of these non-UK ancestries is largely uncharacterized, where study could highlight valuable intracontinental ancestry references with deep phenotyping within the UKBB. In this context, we sought to investigate the sample of European ancestry captured in the UKBB. We studied the haplotypes of 5,500 UKBB individuals with a European birthplace; investigated the population structure and demographic history in Europe, showing in parallel the variety of footprints of demographic history in different genetic regions around Europe; and expand knowledge of the genetic landscape of the east and southeast of Europe. Providing an updated map of European genetics, we leverage IBD-segment sharing to explore the extent of population isolation and size across the continent. In addition to building and expanding upon previous knowledge in Europe, our results show the UKBB as a source of diverse ancestries beyond Britain. These worldwide ancestries sampled in the UKBB may complement and inform researchers interested in specific communities or regions not limited to Britain.

Keywords: demographic history; haplotypes; identity by descent; population genetics.


Conflict of interest statement

The authors declare no competing interest.

Figures

Fig. 1.
Fig. 1.
A sample of European structure in the UKBB. (A) The number of individuals included from each European country analyzed. Countries are grouped by geographic region; these regions are chosen as a means of group representation and do not necessarily imply historical links. Sample sizes from each region are also shown. Abbreviations are as follows: SE Europe (southeastern Europe), S Europe (southern Europe), E Europe (eastern Europe), C Europe (central Europe), N Europe (northern Europe), W Europe (western Europe), Brit. & Ire. (Britain and Ireland). (B) The sample counts for each European region. (C) The first two PCs calculated by PLINK of 5,500 European individuals. Individual genotypes are shown by letters that encode the alpha-2 ISO 3166 international standard codes and are color coded according to geographic region. The median PC for each country/region of birth is shown as a label. Plots were generated using the ggplot2 package (65) in the R statistical computing language (59).
Fig. 2.
Fig. 2.
Leiden clustering of 5,500 Europeans from the UKBB. (A) The dendrogram of Leiden clusters, grouping them according to their hierarchical relationships. The three main branches are color coded, with additional subdivisions shown as vertical lines. Each of the 41 cluster labels are shown alongside their associated color and shape coding. (B) The membership of each of the 41 Leiden clusters. Along the x axis shows country/region of birth, and along the y axis cluster membership. The heat map shows the proportion of individuals from each country of birth in each cluster (Freq), and the absolute number. (C) The first two PCs of the pbwt paint chunkcounts coancestry matrix. Each point represents the phased genotype of an individual, color and shape coded according to Leiden cluster membership, using the convention shown in A. Additional labels are shown to show the broad European region that individuals were born from. Plots were generated using the ggplot2 package (65) in the R statistical computing language (59).
Fig. 3.
Fig. 3.
Patterns of within-cluster IBD sharing in the UKBB. (Left) The individual mean total length of IBD segments shared with another individual from the same Leiden cluster versus the mean number of IBD segments shared with individuals placed in the same cluster. Individual cluster membership is indicated by symbol/color designation. (Right) The values of the panel on the Left, showing groups of Leiden clusters separately to highlight subtle regional differences in Europe. Symbol/color designation is the same as the panel on the Left. Plots were generated using the ggplot2 package (65) in the R statistical computing language (59).
Fig. 4.
Fig. 4.
Historical population sizes of different European regions. For each group of related Leiden clusters, the point log10 Ne estimated by IBDNe is shown for 5, 15, and 30 generations ago. Clusters are indicated by symbol/color designation, and error bars show the lower and upper 95% confidence intervals obtained with bootstrapping. Plots were generated using the ggplot2 package (65) in the R statistical computing language (59).
Fig. 5.
Fig. 5.
Measures of inbreeding differentiate European genetic histories. (A) The per-Leiden cluster; the mean total length of autosomal ROH was >1.5 Mb. (B) The average total length of ROH was >1.5 Mb versus the average number of ROH for each Leiden cluster, differentiating the burden of long/short ROH in each cluster. Error bars show 95% confidence intervals. (C) The mean FROH and FSNP values for each Leiden clusters with 95% confidence intervals in error bars. Mean FROH is an estimate of the total inbreeding relative to an unknown base generation. Mean FSNP is an estimate of inbreeding in the current generation, with FSNP = 0 indicating random breeding, FSNP <0 indicating inbreeding avoidance, and FSNP >0 indicating inbreeding. Thus, 1) points along the x-axis show excess homozygosity not explained by ROH (caused for example by admixture or excess allele frequency drift compared to coanalyzed samples), 2) points along the y axis indicate that homozygosity is caused by historical small population size rather than consanguinity, and 3) points along the solid diagonal line indicate that all excess population homozygosity can be accounted for by ROH.

Similar articles

Cited by

References

    1. Lawson D. J., Hellenthal G., Myers S., Falush D., Inference of population structure using dense haplotype data. PLoS Genet. 8, e1002453 (2012). - PMC - PubMed
    1. Leslie S., et al. ; Wellcome Trust Case Control Consortium 2; International Multiple Sclerosis Genetics Consortium, The fine-scale genetic structure of the British population. Nature 519, 309–314 (2015). - PMC - PubMed
    1. Bycroft C., et al. , Patterns of genetic differentiation and the footprints of historical migrations in the Iberian Peninsula. Nat. Commun. 10, 551 (2019). - PMC - PubMed
    1. Raveane A., et al. , Population structure of modern-day Italians reveals patterns of ancient and archaic ancestries in Southern Europe. Sci. Adv. 5, eaaw3492 (2019). - PMC - PubMed
    1. Genome of the Netherlands Consortium, Whole-genome sequence variation, population structure and demographic history of the Dutch population. Nat. Genet. 46, 818–825 (2014). - PubMed

Publication types

LinkOut - more resources