. 2022 Jun 21;119(25):e2121778119.
doi: 10.1073/pnas.2121778119. Epub 2022 Jun 13.

Host protease activity classifies pneumonia etiology

Affiliations

Host protease activity classifies pneumonia etiology

Melodi Anahtar et al. Proc Natl Acad Sci U S A. .

Abstract

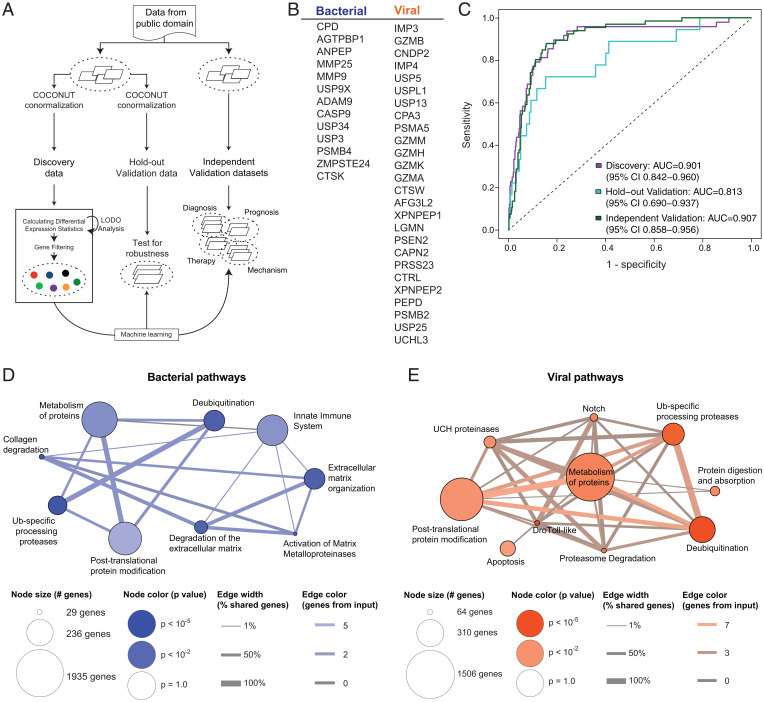
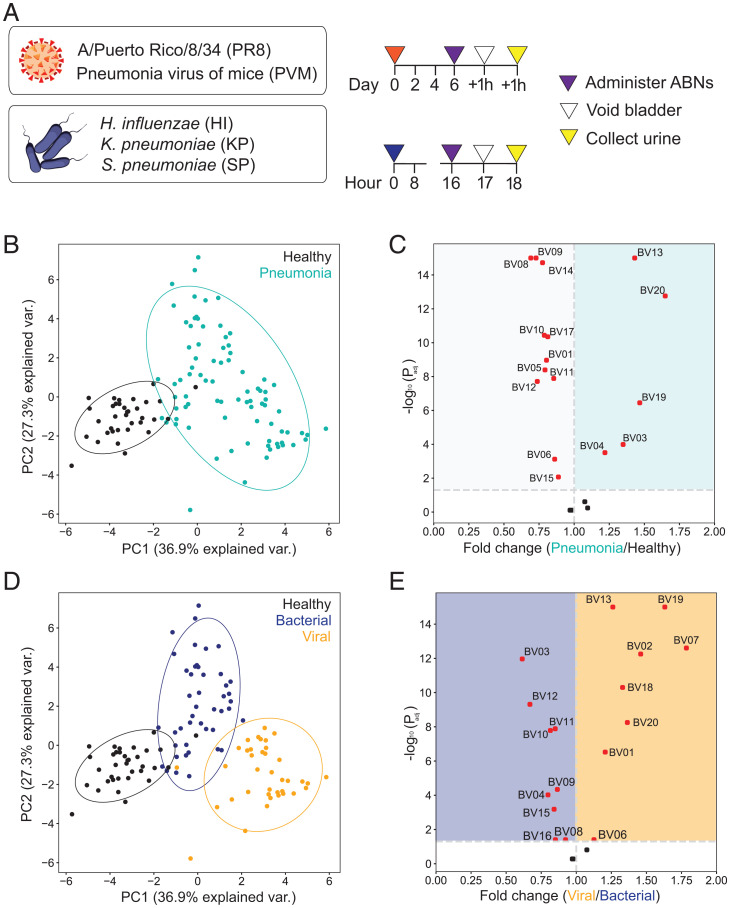
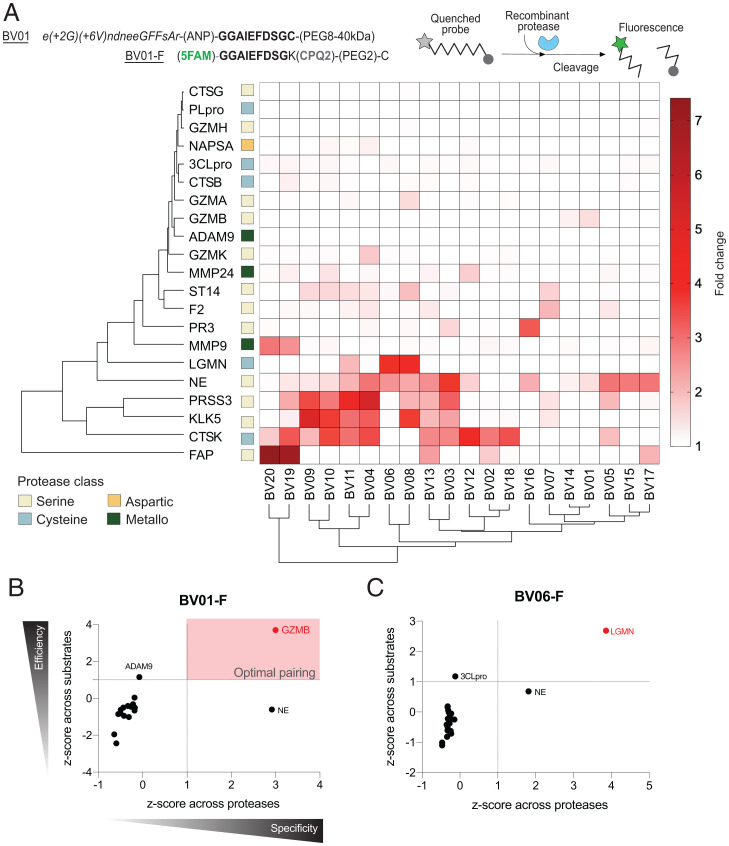
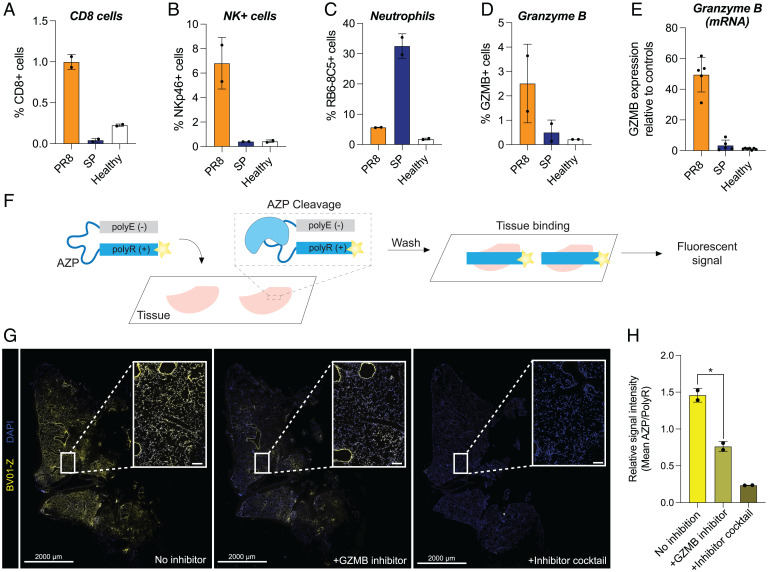
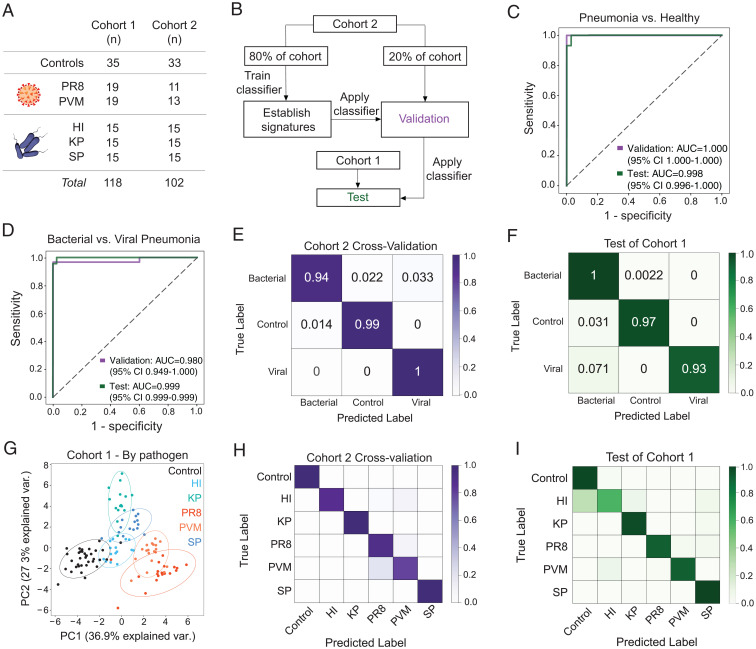
Community-acquired pneumonia (CAP) has been brought to the forefront of global health priorities due to the COVID-19 pandemic. However, classification of viral versus bacterial pneumonia etiology remains a significant clinical challenge. To this end, we have engineered a panel of activity-based nanosensors that detect the dysregulated activity of pulmonary host proteases implicated in the response to pneumonia-causing pathogens and produce a urinary readout of disease. The nanosensor targets were selected based on a human protease transcriptomic signature for pneumonia etiology generated from 33 unique publicly available study cohorts. Five mouse models of bacterial or viral CAP were developed to assess the ability of the nanosensors to produce etiology-specific urinary signatures. Machine learning algorithms were used to train diagnostic classifiers that could distinguish infected mice from healthy controls and differentiate those with bacterial versus viral pneumonia with high accuracy. This proof-of-concept diagnostic approach demonstrates a way to distinguish pneumonia etiology based solely on the host proteolytic response to infection.

Keywords: bacterial infections; diagnostics; nanoparticles; pneumonia; viral infections.


Conflict of interest statement

Competing interest statement: S.N.B. reports compensation for cofounding, consulting, and/or board membership in Glympse Bio, Satellite Bio, CEND Therapeutics, Xilio Therapeutics, Catalio Capital, Intergalactic Therapeutics, Port Therapeutics, Vertex Pharmaceuticals, Danaher, and Moderna and receives sponsored research funding from Johnson & Johnson, Revitope, and Owlstone Medical.

Figures

Fig. 1.
Fig. 1.
Schematic of how ABNs harness host-derived proteases to enable the diagnosis of pneumonia. 1) A multiplexed panel of ABNs with varying protease substrate linkers and corresponding mass-encoded reporters are administered to mice that have been infected with either bacterial or viral pneumonia. 2) Proteases are present in the lung cleave the ABNs at engineered substrate linkers, which release the reporters from the ABN scaffold (gray) into the circulation. 3) These reporters are filtered by the kidney and concentrated in the urine. 4) The reporters are then collected, and their concentrations are measured via mass spectrometry. 5) These concentrations are input into machine learning algorithms to train diagnostic classifiers. 6) This algorithm enables the diagnosis of pneumonia and, in the case of infection, specifies whether the etiology is bacterial or viral.
Fig. 2.
Fig. 2.
Generation of a bacterial versus viral infection protease signature using transcriptional metanalysis. (A) Publicly available transcriptional datasets from human patients with bacterial and viral respiratory infections were normalized using MANATEE, a computational framework for metanalysis of gene expression data. (B) MANATEE yielded a 39-gene signature of proteases that are differentially upregulated in bacterial versus viral infections. (C) A classifier was trained on human data from 16 published cohorts and validated on 17 independent published cohorts (SI Appendix, Tables S1 and S2). In total, 70% of samples (n = 495 nonhealthy samples) were used as discovery, and the other 30% were used in hold-out validation (n = 183 nonhealthy samples). ROC curves represent the distinguishing power of the classifier, where an AUC of 0.5 indicates the classifier performs as well as chance, and an AUC of 1 indicates perfect classification. (D and E) Biological pathways underlying the different gene sets were queried using a pathway analysis program (ConsensusPathDB). The pathways are represented by nodes, with the size indicating the number of total genes associated with that pathway and the color indicating the significance of the inputted gene set in terms of its association with the pathway. Signature genes that are shared between different pathways are depicted as edges, with the color indicating the number of shared input genes.
Fig. 3.
Fig. 3.
Nanosensors distinguish pneumonia and its etiology in mice. (A) ABNs were administered into five mouse models of pneumonia. Urine from each mouse was collected 2 h after administration to characterize in vivo ABN activity. (B and D) Unsupervised PCA of normalized urinary reporter concentrations in pneumonia (n = 83 mice) and healthy controls (n = 35 mice). Data from pneumonia mice are labeled according to either infection (B) or etiology (D) (bacterial pneumonia, n = 45; viral pneumonia, n = 38). (C and E) The relative fold change between disease states was calculated using mean-scaled reporter concentrations. Dotted vertical line represents no fold change between disease states. Each point represents one reporter, with significantly differential reporters in red (above the dotted horizontal line at Padj = 0.05). Significance was calculated using two-tailed t test with Holm-Sidak correction.
Fig. 4.
Fig. 4.
In vitro screening of fluorescent substrates reveals possible nanosensor targets. (A) The peptide sequence of each ABN was incorporated into a quenched fluorescent substrate. These fluorogenic probes were then incubated with recombinant proteases to evaluate cleavage profiles. Hierarchical clustering was performed based on the fold change in fluorescence after 10 min (average of two replicates). A fold change of 1 indicates no cleavage (white squares in the heat map); increased cleavage corresponds to higher color intensity. (B and C) Standardization was performed to assess protease-substrate pairings from the in vitro screening data. Z-scores of the average fold change values for each pairing across the proteases (x axis) and substrates (y axis) were compared using sSvE plots to characterize protease-substrate pairs with highly specific and efficient cleavage.
Fig. 5.
Fig. 5.
GZMB is elevated in viral pneumonia and contributes to nanosensor signal. (AD) Percentage of detected cells positive for various cell markers via immunofluorescent staining performed on fresh-frozen sections from mice infected with either PR8 or SP (n = 2 consecutive sections per group, mean ± SD). Counts were obtained using QuPath, and stain-positive cells were identified via manually set thresholds. Counts for positive/total cells per section in each panel are (A) CD8 (PR8: 884/83153, 747/80149; SP: 49/86308, 34/127753; healthy: 252/117485, 289/122812); (B) NKp46 (PR8: 4256/80149, 6895/83153; SP: 345/86308, 505/127753; healthy: 593/117485, 421/122812); (C) RB6-8C5 (PR8: 5021/90127, 5549/97327; SP: 38217/128902, 51305/145035; healthy: 2641/130332, 2032/128009); and (D) GZMB (PR8: 1127/82380, 3432/94145; SP: 168/119890, 767/89157; healthy: 335/156523, 291/135411). (E) Relative expression of GZMB in lung tissue from healthy control mice and those with PR8 or SP via qRT-PCR. (F) The original BV01 substrate was incorporated into the AZP BV01-Z, consisting of the substrate sequence linking a fluorescently labeled polyR domain and a polyE domain. The AZP is applied to fresh-frozen tissue and is cleaved by active tissue-resident enzymes, after which the liberated polyR domain electrostatically binds to the tissue. (G) The GZMB responsive AZP BV01-Z (yellow) was applied to PR8-infected tissue with and without a GZMB-specific inhibitor or a broad-spectrum mixture of protease inhibitors. Sections were costained with a free polyR binding control (not shown) and counterstained with DAPI (blue). Staining shows one section of the slide, with white squares marking the location of the inset images. Scale bars for full sections: 2,000 μm; scale bars for zoomed regions: 100 μm. (H) Quantification of relative BV01-Z intensity in sections stained with or without inhibitors (n = 2 consecutive sections, mean ± SD; one-way ANOVA with multiple comparisons and Brown-Forsythe and Welch’s correction, *P = 0.0278).
Fig. 6.
Fig. 6.
The nanosensor panel diagnoses pneumonia and classifies pneumonia etiology with high accuracy. (A) Mice from two independent cohorts were infected with various pneumonia-causing pathogens or given a mock dose of phosphate buffer saline for healthy controls. (B) Flowchart of the training, validation, and testing method used to create and test SVM classifiers for pneumonia. Cohort 2 was split into two groups: one to train the classifier and another to validate its performance. The classifier was then applied to an independent group of infected and healthy mice, cohort 1. The classification performance of the classifier on this independent cohort is labeled as the test condition. The validation and test performance of binary classifiers trained using this framework is represented with ROC curves (see C and D). Distinguishing power of classifiers trained on a multiclass prediction problem were visualized with a confusion matrix (see E, F, H, and I). (C and D) Performance of binary classifiers to differentiate mice infected with pneumonia from healthy controls (C) and bacterial from viral pneumonia (D). (E and F) Confusion matrices can visualize the performance of a multiclass SVM algorithm to distinguish among all three states of interest. The (E) cross-validation and (F) test performance of the multiclass classifier are shown here. Each value represents the frequency at which each true label was classified with the predicted label (e.g., the top left box represents the mice with bacterial pneumonia, the true label, that were classified as having bacterial pneumonia, the predicted label). The diagonal represents the true positive classifications. (G) PCA was performed on mean normalized urinary ABN signals from healthy controls (black) and mice with pneumonia (colored symbols) in cohort 1. (H and I) Confusion matrices showing the accuracy of an SVM classifier in pathogen identification. All performance metrics are averages over 10 independent train-test trials. Train, validation, and test n can be found in Materials and Methods.

Similar articles

Cited by

References

    1. Ferreira-Coimbra J., Sarda C., Rello J., Burden of community-acquired pneumonia and unmet clinical needs. Adv. Ther. 37, 1302–1318 (2020). - PMC - PubMed
    1. Jain S., et al. ; CDC EPIC Study Team, Community-acquired pneumonia requiring hospitalization among U.S. adults. N. Engl. J. Med. 373, 415–427 (2015). - PMC - PubMed
    1. Holter J. C., et al. , Etiology of community-acquired pneumonia and diagnostic yields of microbiological methods: A 3-year prospective study in Norway. BMC Infect. Dis. 15, 64 (2015). - PMC - PubMed
    1. Metlay J. P., et al. , Diagnosis and treatment of adults with community-acquired pneumonia. An official clinical practice guideline of the American Thoracic Society and Infectious Diseases Society of America. Am. J. Respir. Crit. Care Med. 200, e45–e67 (2019). - PMC - PubMed
    1. Jones B. E., et al. , Summary for clinicians. Ann. Am. Thorac. Soc. 17, 133–138 (2020). - PubMed

Publication types

Substances

LinkOut - more resources