. 2022 Jun 21;119(25):e2202327119.
doi: 10.1073/pnas.2202327119. Epub 2022 Jun 13.

Radioresistant cells initiate lymphocyte-dependent lung inflammation and IFNγ-dependent mortality in STING gain-of-function mice

Affiliations

Radioresistant cells initiate lymphocyte-dependent lung inflammation and IFNγ-dependent mortality in STING gain-of-function mice

Kevin MingJie Gao et al. Proc Natl Acad Sci U S A. .

Abstract

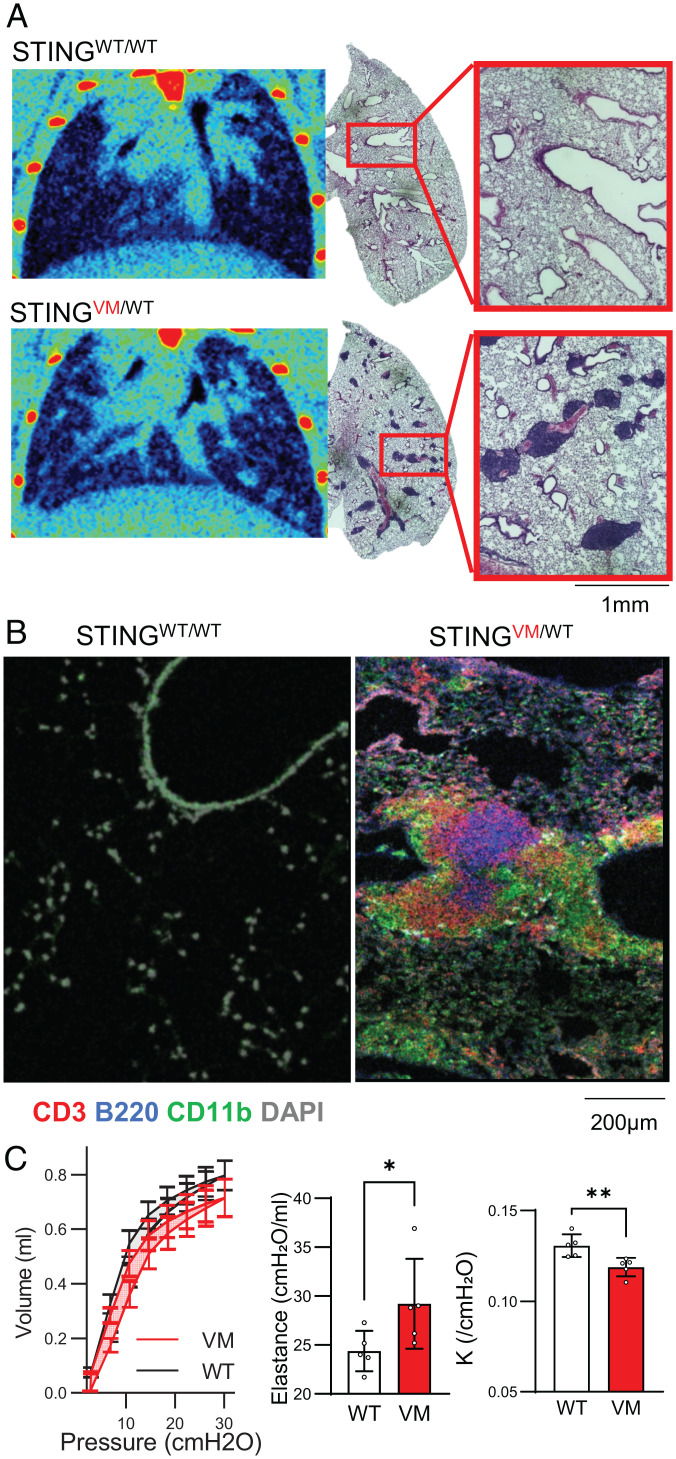
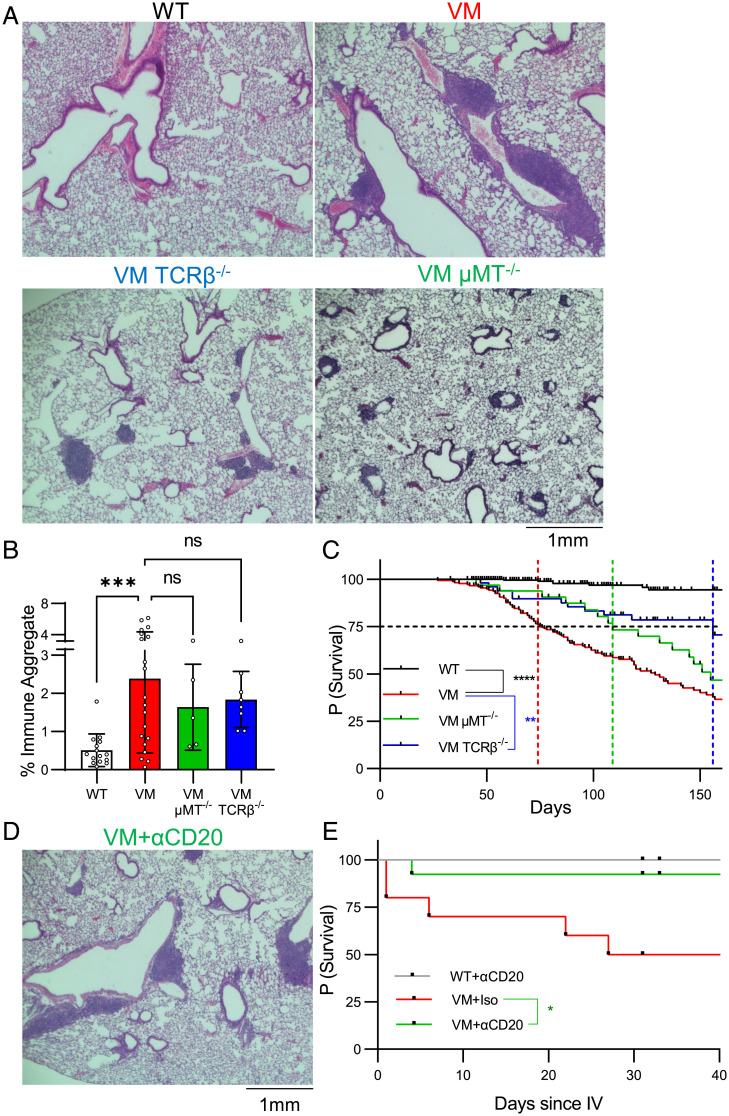
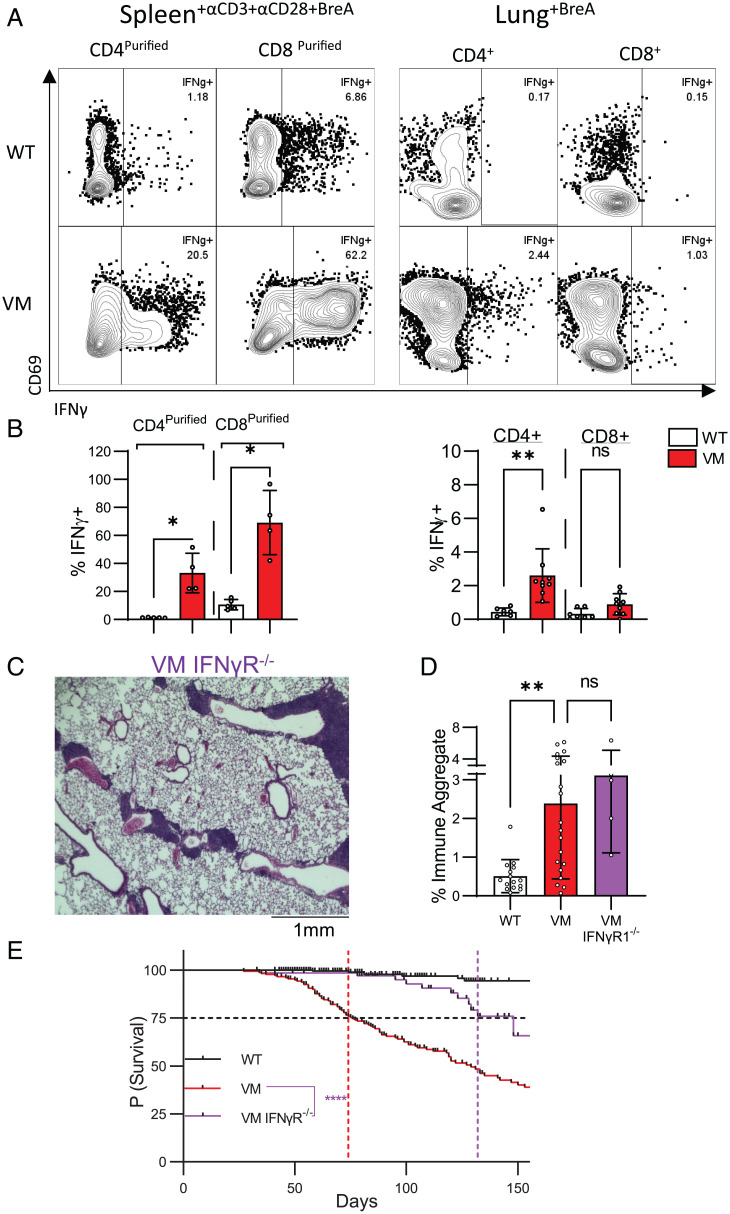
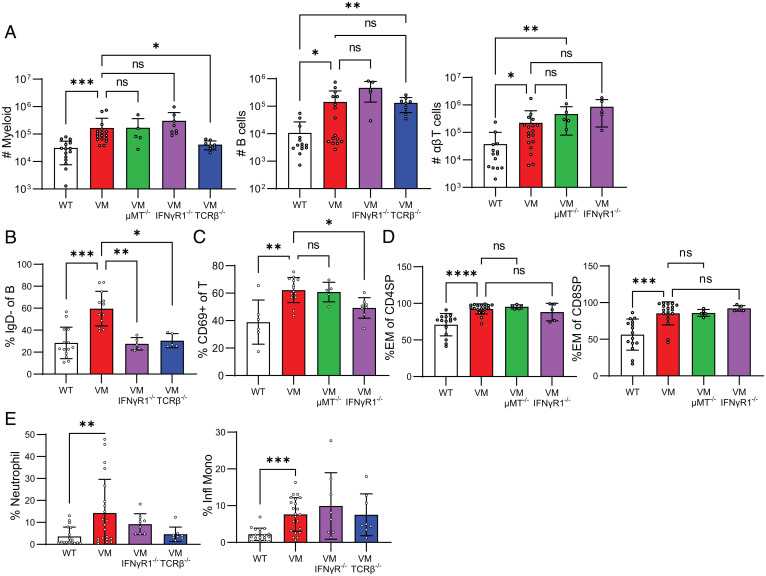
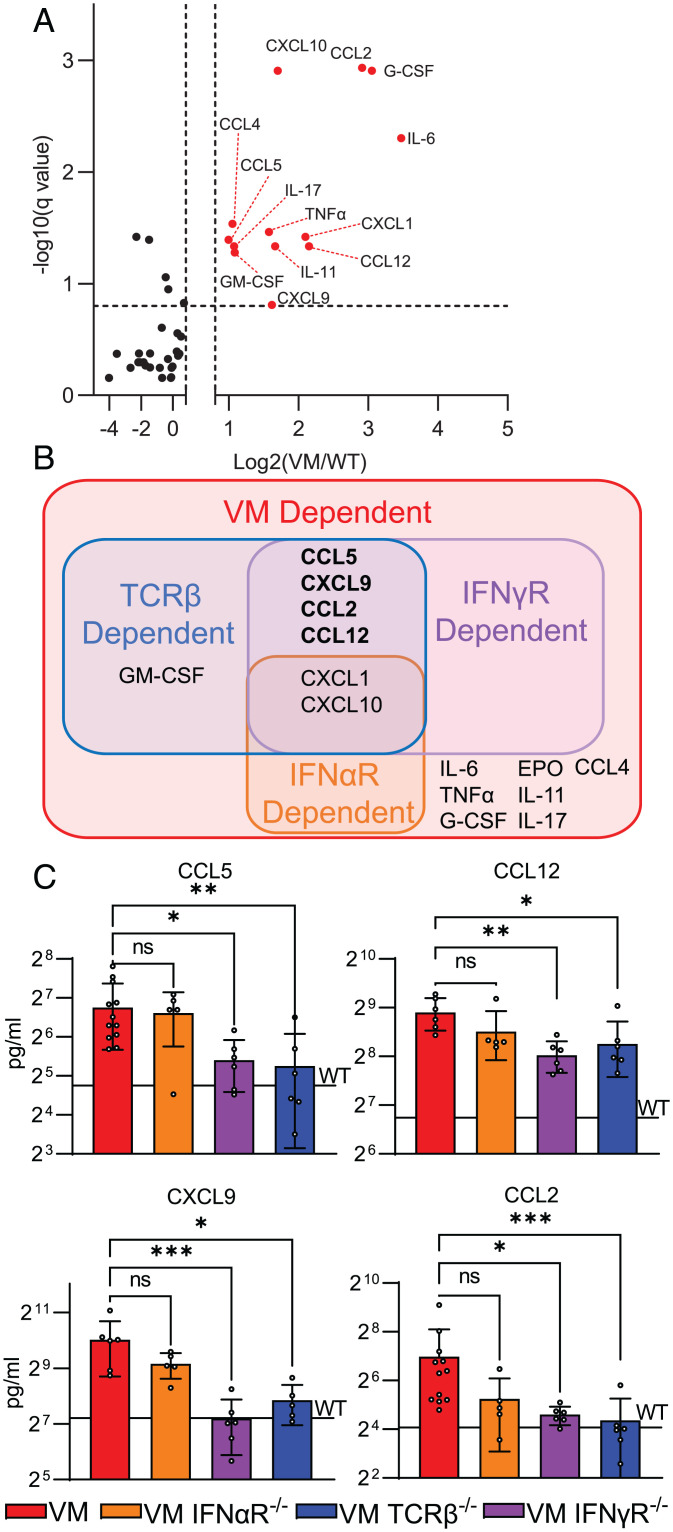
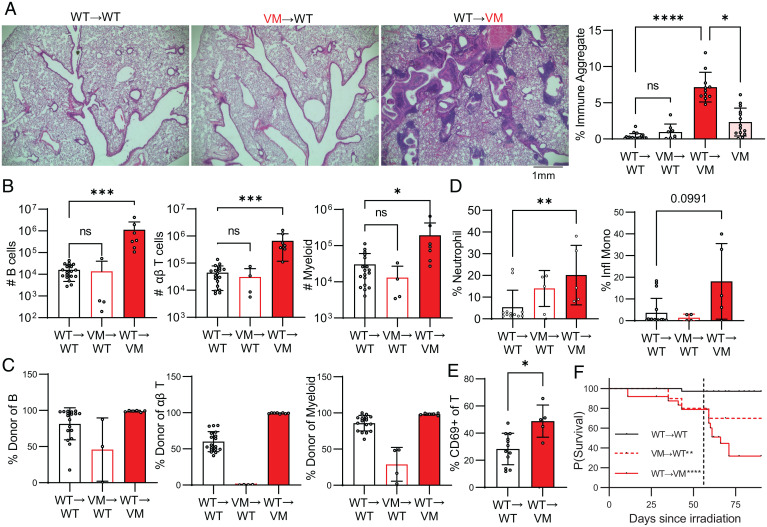
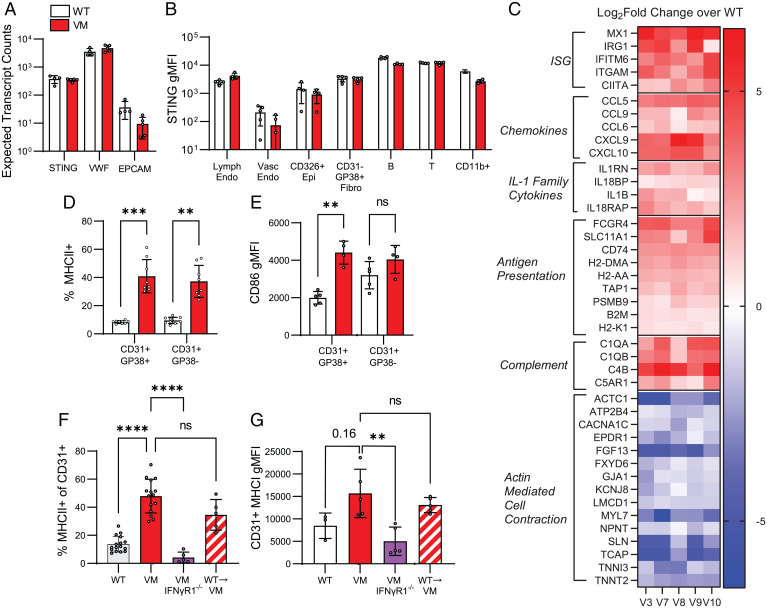
Pediatric patients with constitutively active mutations in the cytosolic double-stranded-DNA-sensing adaptor STING develop an autoinflammatory syndrome known as STING-associated vasculopathy with onset in infancy (SAVI). SAVI patients have elevated interferon-stimulated gene expression and suffer from interstitial lung disease (ILD) with lymphocyte predominate bronchus-associated lymphoid tissue (BALT). Mice harboring SAVI mutations (STING V154M [VM]) that recapitulate human disease also develop lymphocyte-rich BALT. Ablation of either T or B lymphocytes prolongs the survival of SAVI mice, but lung immune aggregates persist, indicating that T cells and B cells can independently be recruited as BALT. VM T cells produced IFNγ, and IFNγR deficiency prolonged the survival of SAVI mice; however, T-cell-dependent recruitment of infiltrating myeloid cells to the lung was IFNγ independent. Lethally irradiated VM recipients fully reconstituted with wild type bone-marrow-derived cells still developed ILD, pointing to a critical role for VM-expressing radioresistant parenchymal and/or stromal cells in the recruitment and activation of pathogenic lymphocytes. We identified lung endothelial cells as radioresistant cells that express STING. Transcriptional analysis of VM endothelial cells revealed up-regulation of chemokines, proinflammatory cytokines, and genes associated with antigen presentation. Together, our data show that VM-expressing radioresistant cells play a key role in the initiation of lung disease in VM mice and provide insights for the treatment of SAVI patients, with implications for ILD associated with other connective tissue disorders.

Keywords: SAVI; STING; endothelial cells; interferon gamma; interstitial lung disease.


Conflict of interest statement

Competing interest statement: The authors declare a competing interest. K.A.F. serves as a scientific advisory board member to Janssen, Moderna, Related Sciences, Generation Bio, and NodThera Inc as well as a consultant for Casma Therapeutics, Jnana Therapeutics, Elicio Therapeutics, and OMass Therapeutics.

Figures

Fig. 1.
Fig. 1.
VM mice develop ILD with BALT. (A) Four- to 5-mo-old littermate- and sex-matched WT and VM mice were assessed by micro-CT coronal cross-sections of lung field from representative WT and VM mice and H&E histology from the same individual mice. (B) IF imaging of 5-mo-old WT and VM lung stained for CD3 (red), B220 (blue), CD11b (green), and DAPI (gray). (C) Ventilography measurements from WT (n = 5) and VM (n = 5) mice showing pressure-volume loop, elastance, and K (curvature of the upper portion of pressure-volume loop deflation limb). Nonparametric Mann–Whitney U tests were used to determine statistical significance (*P < 0.05, **P < 0.01).
Fig. 2.
Fig. 2.
B and T cells independently contribute to BALT formation and survival of VM mice. (A) Three- to 4-mo-old age- and sex-matched WT (n = 14), VM (n = 20), VM μMT KO (n = 5), and VM TCRβ KO (n = 8) mice were assessed by representative 4× field H&E histology from sectioned lungs. (B) Quantification of immune aggregates from scanned mouse lung H&E sections using a pixel classifier approach in QuPath. The percentage of immune aggregates is calculated as the fraction of pixels detected as immune aggregates over the total area of lung tissue assessed. (C) Kaplan–Meier survival analysis showing probability of survival over time for WT (n = 296), VM (n = 173), VM TCRβ KO (n = 51), and VM μMT KO (n = 32) mice. A black dotted line that intersects the y axis at 75% survival is shown. Colored lines intersecting the x axis are shown that represent the lifespan at which 75% of mice from each line were predicted to survive. (C) Six-wk-old WT and VM mice were treated with either a B cell depleting CD20 mAb (WT, n = 8; VM, n = 13) or an isotype-matched control mAb (VM, n = 9). Representative H&E histology from a VM mouse treated with CD20 mAb is shown. (D) Survival data for 6 wk following treatment as shown here by Kaplan–Meier survival curves. Nonparametric Mann–Whitney U tests were for pairwise comparisons, and a nonparametric Kruskal–Wallis test was used for one-way ANOVA to determine statistical significance (***P < 0.001). Statistical significance for survival was determined using a log-rank test (*P < 0.05, **P < 0.01, ****P < 0.0001).
Fig. 3.
Fig. 3.
VM SAVI T cells produce IFNγ, and IFNγR contributes to VM SAVI mortality. Three- to 4-mo-old age- and sex-matched WT and VM mice were assessed via IFNγ intracellular staining of magnetic bead purified CD4+ and CD8+ splenocytes stimulated with CD3 and CD28 mAb antibody overnight (WT, n = 3 to 4; VM, n = 4), and unstimulated lung suspensions (WT n = 4, VM n = 5), both treated with Brefeldin A for 4 h before assessment. Representative flow plots (A) and summary bar graphs are shown (B). (C and D) Three- to 4-mo-old age- and sex-matched WT (n = 14), VM (n = 20), and VM IFNγRKO (n = 5) were assessed by representative 4× field H&E histology from sectioned lungs (C). (D) Quantification of immune aggregates from scanned mouse lung H&E sections. (E) Kaplan–Meier survival analysis showing the probability of survival over time for WT (n = 296), VM (n = 173), and VM IFNγR KO (n = 69) mice. A black dotted line that intersects the y axis at 75% survival is shown. Colored lines intersecting the x axis are shown that represent the lifespan at which 75% of mice from each line were predicted to survive. Nonparametric Mann–Whitney U tests were for pairwise comparisons, and a nonparametric Kruskal–Wallis test was used for one-way ANOVA to determine statistical significance (nsP > 0.05, *P < 0.05, **P < 0.01). Statistical significance for survival was determined using a log-rank test (****P < 0.0001).
Fig. 4.
Fig. 4.
VM T cells promote lung lymphocyte activation and myeloid recruitment. Three- to 4-mo-old age- and sex-matched WT (n = 15), VM (n = 17), VM TCRβKO (n = 8), VM μMT KO (n = 5), and VM IFNγRKO (n = 8) mice were assessed for total numbers of lung EV (CD45 IV), B cells (CD19+B220+MHCII+), T cells (CD3+TCRβ+), and myeloid cells (CD11b+CD11c, CD11b+CD11c+, and CD11bCD11c+ populations) isolated from the left lung lobe and detected by flow cytometry (A). (B) Percentage of IgD B cells out of lung EV B cells (CD45 IV, CD19+B220+MHCII+). (C) Percentage of CD69+ of lung EV αβ T cells (CD45 IV CD3+TCRβ+). (D) Percentage of effector subset (CD44+CD62L) lung CD4+ and CD8+ αβ T cells assessed by flow cytometry. (E) Percentage of lung EV myeloid cells (CD45 IV CD11b+ and/or CD11c+) was assessed by flow cytometry for neutrophils (CD11b+Ly6G+) and inflammatory monocytes (CD11b+Ly6Chi). Nonparametric Mann–Whitney U tests were used for pairwise comparisons, and a nonparametric Kruskal–Wallis test was used for one-way ANOVA to determine statistical significance (nsP > 0.05, *P < 0.05, **P < 0.01, ***P < 0.001, ****P < 0.0001).
Fig. 5.
Fig. 5.
T cells and IFNγ up-regulate proinflammatory cytokines in SAVI disease. Sera from 3- to 4-mo-old age- and sex-matched WT (n = 3 to 7), VM (n = 6 to 12), IFNAR KO (n = 6), VM IFNAR KO (n = 5), IFNγR KO (n = 5), VM IFNγR KO (n = 6), TCRβ KO (n = 5), and VM TCRβ KO (n = 6) mice were assessed by a multiplex Luminex ELISA for cytokine levels. (A) Volcano plot showing multiple comparisons testing of 41 analytes between WT and VM sera; analytes highlighted in red and labeled are >1.75× elevated in VM with an adjusted P value of <0.15. (B) Venn diagram showing the overlap of sera analytes up-regulated in VM, VM IFNαR KO, VM IFNγR KO, and VM TCRβ KO compared to WT controls. (C) Sera analytes down-regulated in VM IFNγR KO and VM TCRβ KO compared to VM. For C, the black line labeled “WT” represents the average level of the cytokine detected in the sera of WT control samples. Multiple -comparison testing was performed as nonparametric multiple-Mann–Whitney U testing with a false discovery rate of 25%. Nonparametric Kruskal–Wallis test was used for one-way ANOVA to determine statistical significance (nsP > 0.05, *P < 0.05, **P < 0.01, ***P < 0.001).
Fig. 6.
Fig. 6.
SAVI-expressing CD45+ cells are not required for VM BALT pathology. WT and VM mice were lethally irradiated at 6 wk of age and then reconstituted with donor BM to generate WT→WT (n = 18), VM→WT (n = 4 to 11), and WT→VM (n = 7 to 11) chimeric mice and assessed 9 wk later. (A) Representative H&E histology of lungs from WT→WT, VM→WT, and WT→VM chimera lungs, and the quantification of percent immune aggregates is as described above. (B) Total numbers of lung EV (CD45 IV-) B cells (CD19+B220+MHCII+), T cells (CD3+TCRβ+), and myeloid cells (CD11b+ and/or CD11c+) cells assessed by flow cytometry. (C) Percentage of engrafted EV B, αβ T, and myeloid cells in the lung that were derived from donor cells as determined by flow cytometry. (D) Percentage of donor lung EV myeloid cells (CD45 IV CD11b+ and/or CD11c+) that were neutrophils (CD11b+Ly6G+) and inflammatory monocytes (CD11b+Ly6Chi). (E) Percent CD69+ of donor lung EV αβ T cells (CD45 IV CD3+TCRβ+). (F) Kaplan–Meier survival curves for WT→WT (n = 38), VM→WT (n = 10), and WT→VM (n = 25). A black dotted line that intersects the x axis at 56 d is shown, indicating the time that engraftment of donor BM was expected to have been completed. Nonparametric Mann–Whitney U tests were used for pairwise comparisons, and a nonparametric Kruskal–Wallis test was used for one-way ANOVA to determine statistical significance (nsP > 0.05, *P < 0.05, **P < 0.01, ***P < 0.001, ****P < 0.0001). Statistical significance for survival was determined using a log-rank test (**P < 0.01, ****P < 0.0001).
Fig. 7.
Fig. 7.
SAVI lung endothelial cells express STING and show the gene signature indicating activation and elevated immune function. (A) Expected transcript counts for STING, VWF (Endothelial marker gene), and EPCAM (epithelial marker gene) from bulk RNAseq of sorted lung endothelial cells (CD31+CD45CD326CD140aTer119) from WT (n = 4) and VM (n = 5) mice. (B) Intracellular staining for STING was performed on perfused and elastase digested lungs from WT (n = 5), VM (n = 4), and STING KO (n = 1). We report STING geometric mean fluorescence intensity (gMFI) of WT and VM lung in specific populations above the baseline STING gMFI measured in the same population identified in a STING KO control sample. The populations we show are lymphatic endothelia (CD45CD326CD31+CD38+), vascular endothelia (CD45CD326CD31+CD38), epithelia (CD45CD31CD326+), fibroblasts (CD45CD31CD326GP38+), B cells (CD45+B220+MHCII+CD3CD11b), T cells (CD45+CD3+B220CD11b), and myeloid cells (CD45+CD11b+CD3B220). (C) Heatmap of selected differentially expressed genes from bulk RNAseq of sorted VM (n = 5) lung endothelia compared to WT (n = 4) controls, expressed as the log2 fold change of gene expression of VM samples compared to the average WT value. Genes are grouped by functional or ontological classification and by whether they are up- (shown as red) or down- (shown as blue) regulated. Percentage of MHCII expression (D) and gMFI (E) for surface CD86 was measured for lymphatic endothelia and vascular endothelia in elastase digested WT and VM lungs. (F) Percentage of MHCII expression was measured for CD31+ lung endothelia in WT (n = 16), VM (n = 15), VM IFNγR KO (n = 5), and WT→VM chimeric mice (n = 5). (G) Surface MHCI (H2/kb) gMFI for CD31+ endothelial cells from WT (n = 3), VM (n = 5), VM IFNγR KO (n = 5), and WT→VM chimeric mice (n = 5). Nonparametric Mann–Whitney U tests were used for pairwise comparisons, and a nonparametric Kruskal–Wallis test was used for one-way ANOVA to determine statistical significance (nsP > 0.05, **P < 0.01, ***P < 0.001, ****P < 0.0001).

Similar articles

Cited by

References

    1. Vacchi C., et al. ., Therapeutic options for the treatment of interstitial lung disease related to connective tissue diseases. A narrative review. J. Clin. Med. 9, 407 (2020). - PMC - PubMed
    1. Duchemann B., et al. ., Prevalence and incidence of interstitial lung diseases in a multi-ethnic county of Greater Paris. Eur. Respir. J. 50, 1602419 (2017). - PubMed
    1. Martinez F. J., et al. ., Idiopathic pulmonary fibrosis. Nat. Rev. Dis. Primers 3, 17074 (2017). - PubMed
    1. Yoo H., et al. ., Connective tissue disease-related interstitial lung disease (CTD-ILD) and interstitial lung abnormality (ILA): Evolving concept of CT findings, pathology and management. Eur. J. Radiol. Open 8, 100311 (2020). - PMC - PubMed
    1. Kim H., Sanchez G. A. M., Goldbach-Mansky R., Insights from Mendelian interferonopathies: Comparison of CANDLE, SAVI with AGS, monogenic lupus. J. Mol. Med. (Berl.) 94, 1111–1127 (2016). - PMC - PubMed

Publication types

MeSH terms