. 2022 Jul 1;209(1):157-170.
doi: 10.4049/jimmunol.2200192. Epub 2022 Jun 13.

Spinal Cord Injury Impairs Lung Immunity in Mice

Affiliations

Spinal Cord Injury Impairs Lung Immunity in Mice

Katherine A Mifflin et al. J Immunol. .

Abstract

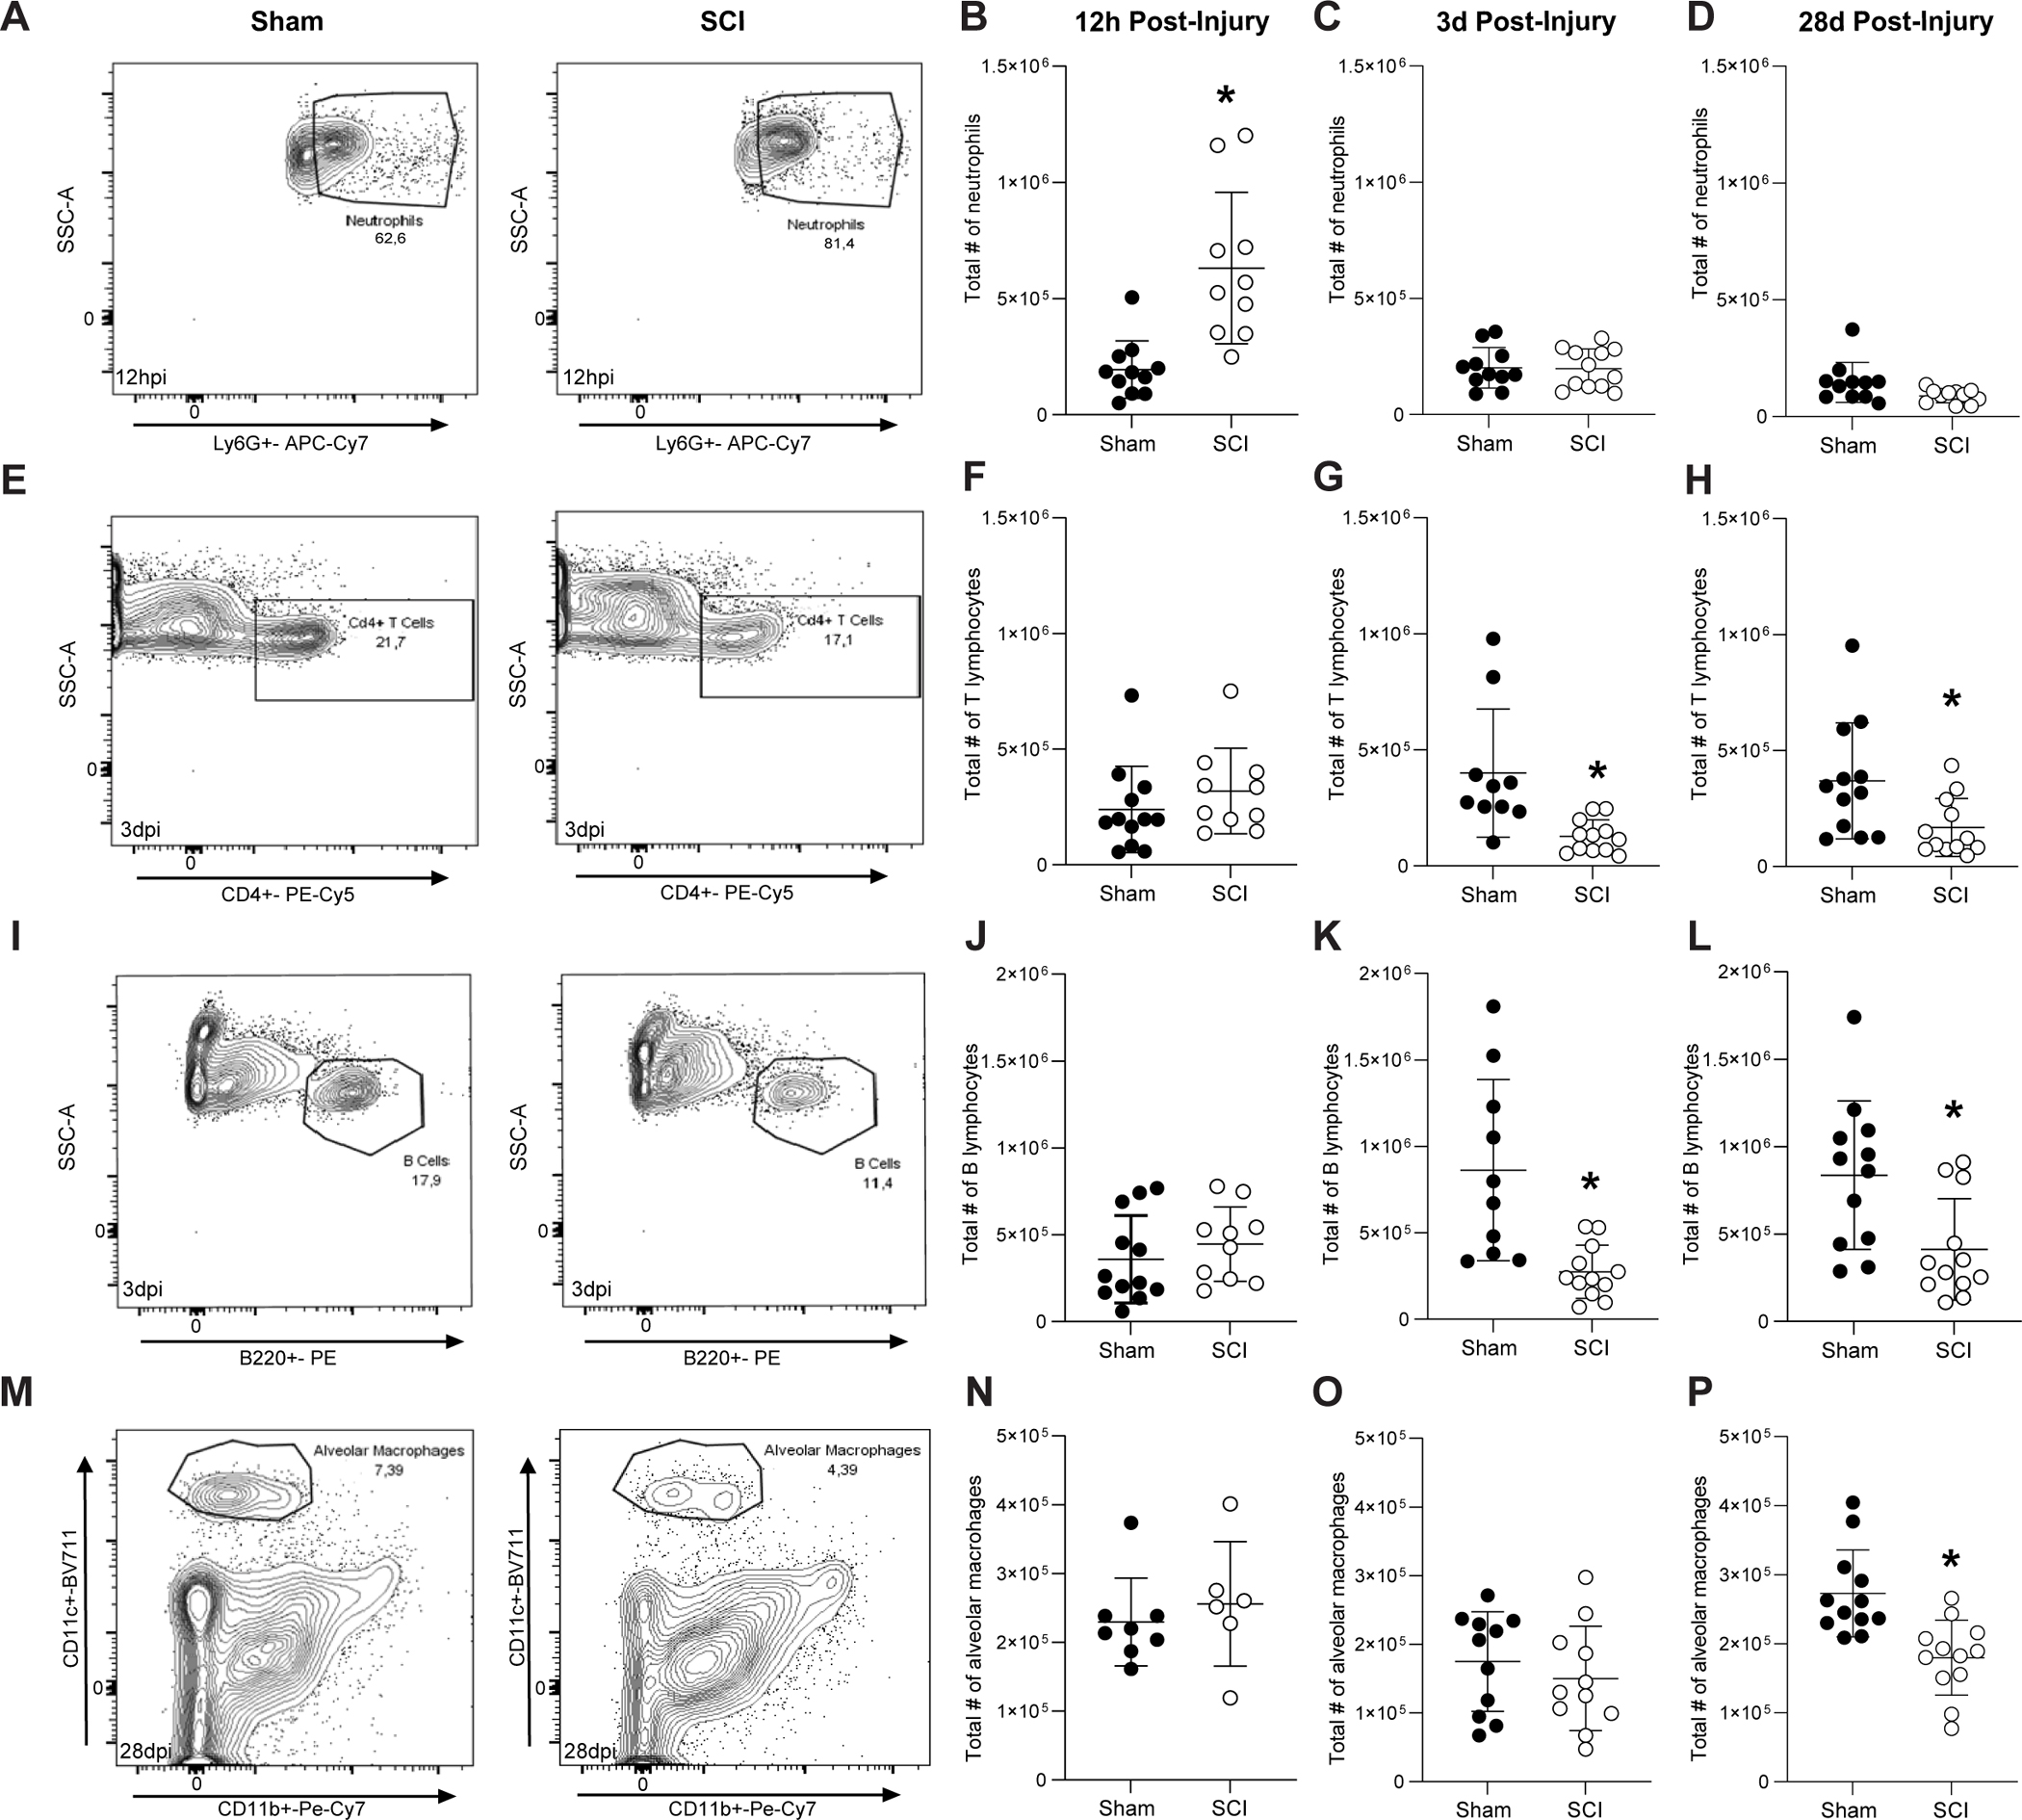
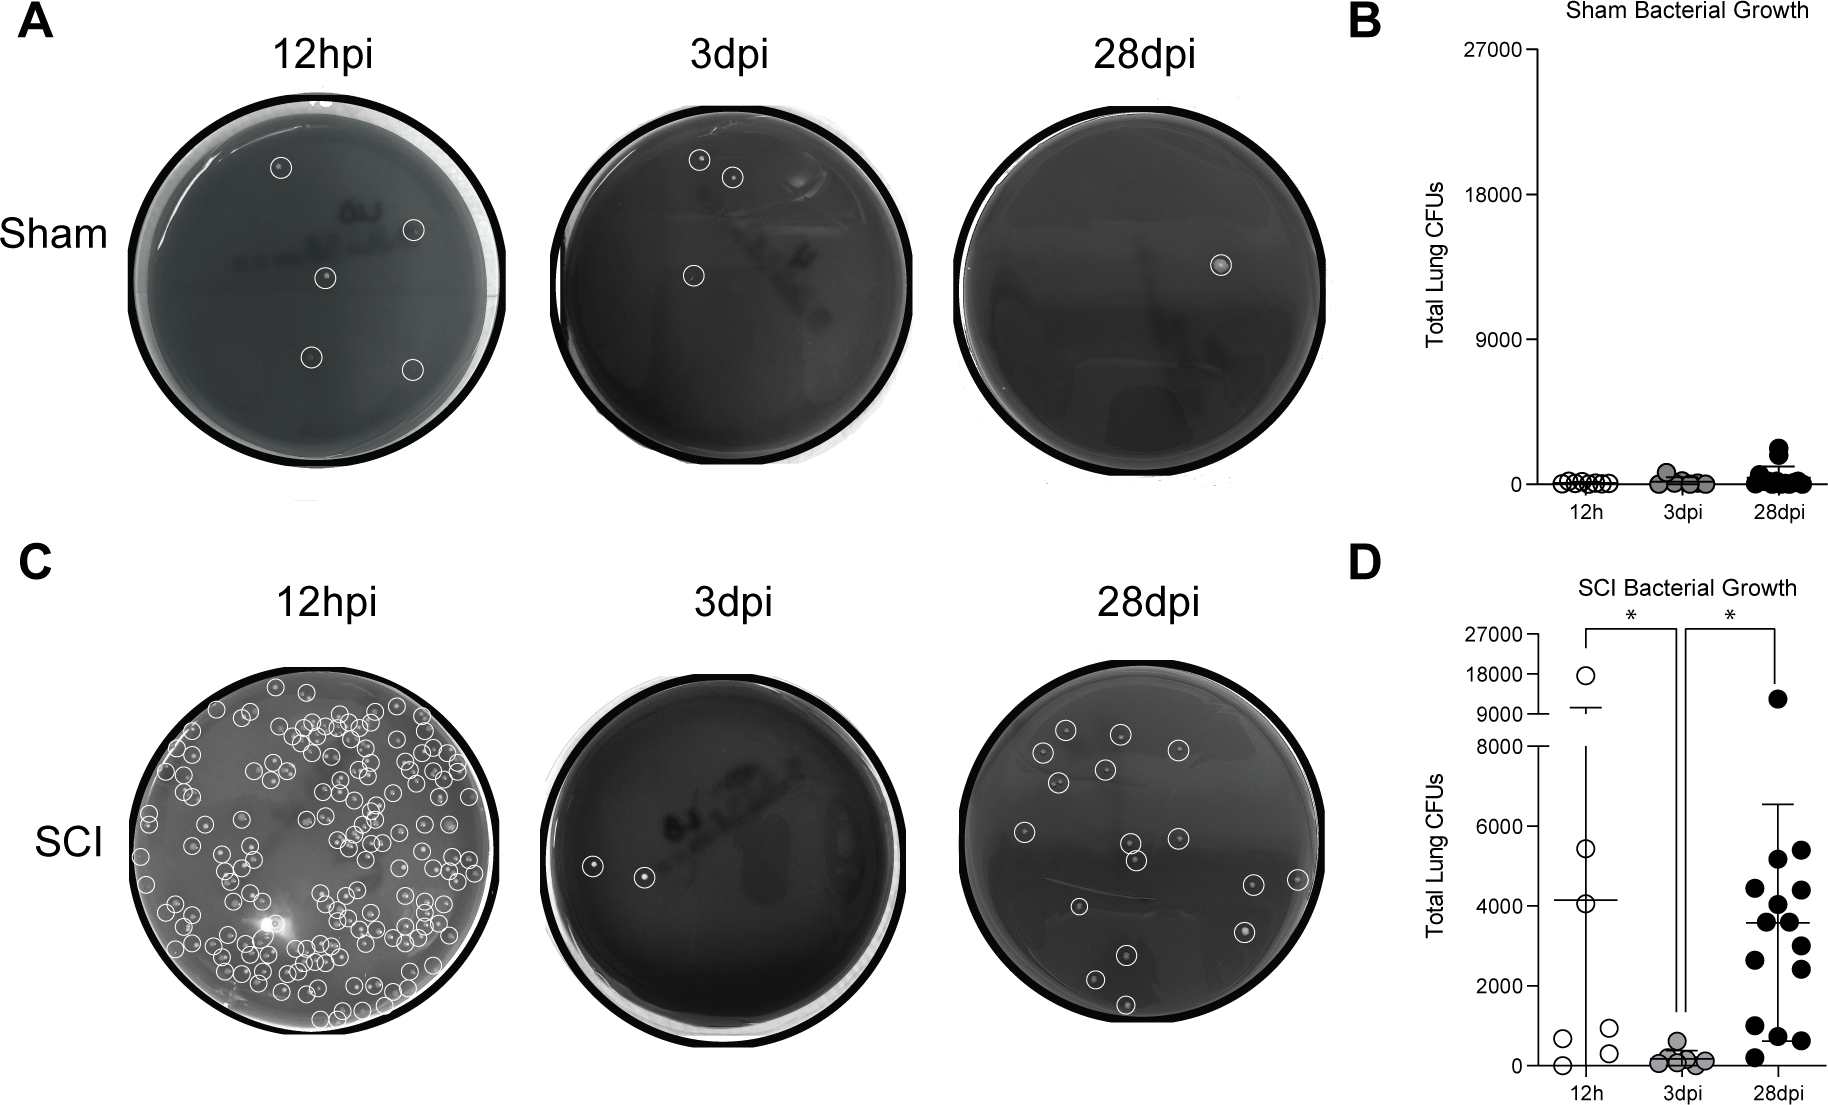
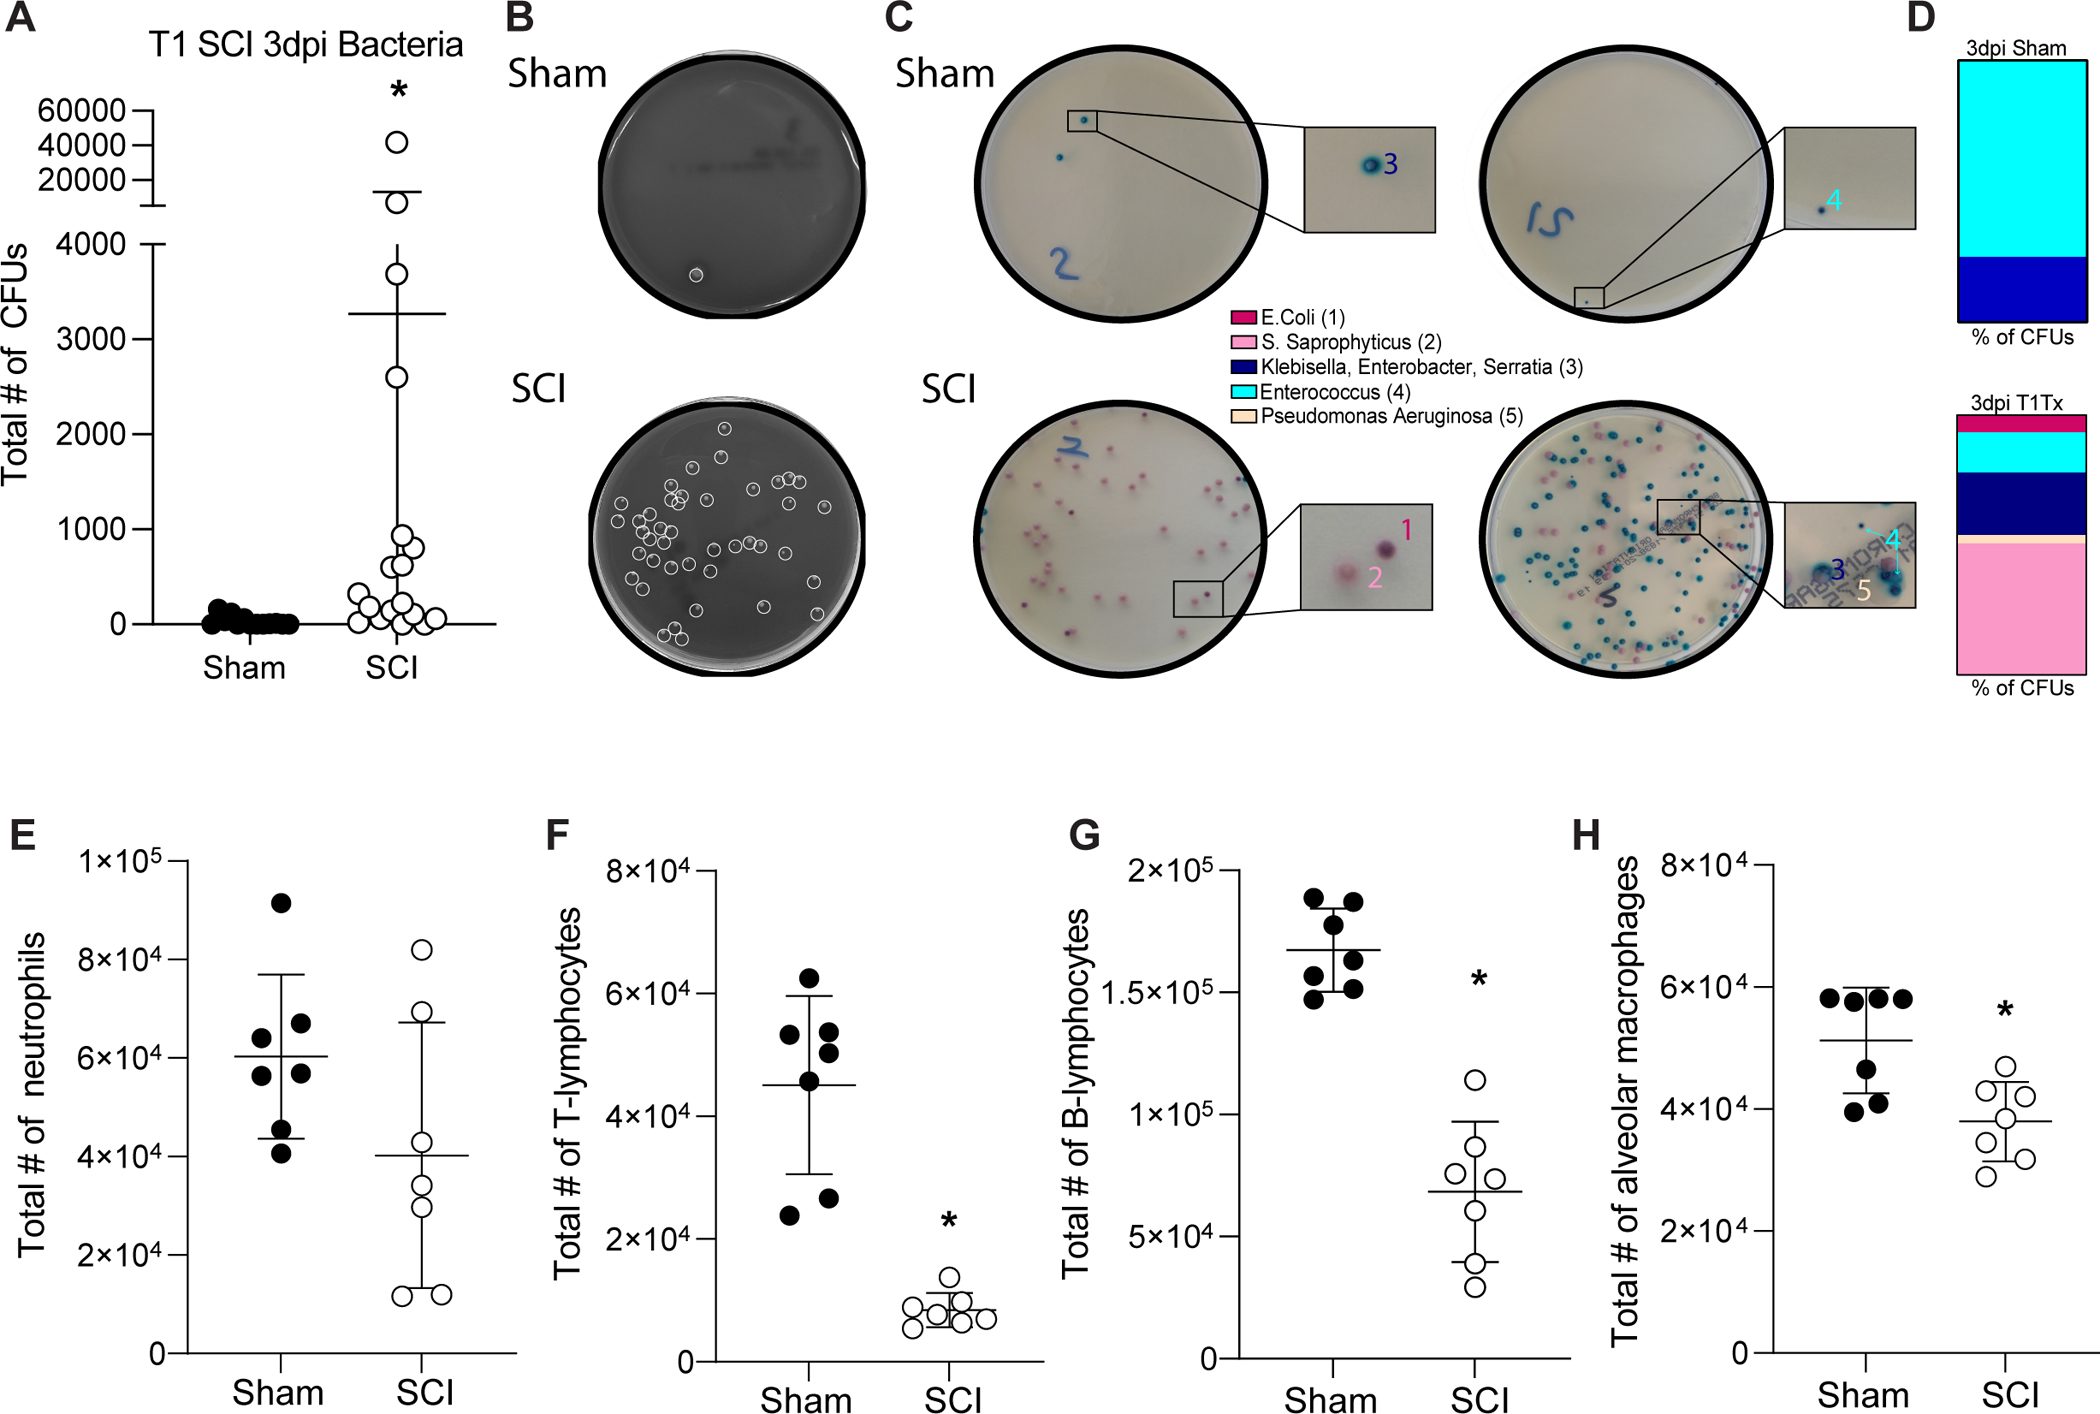
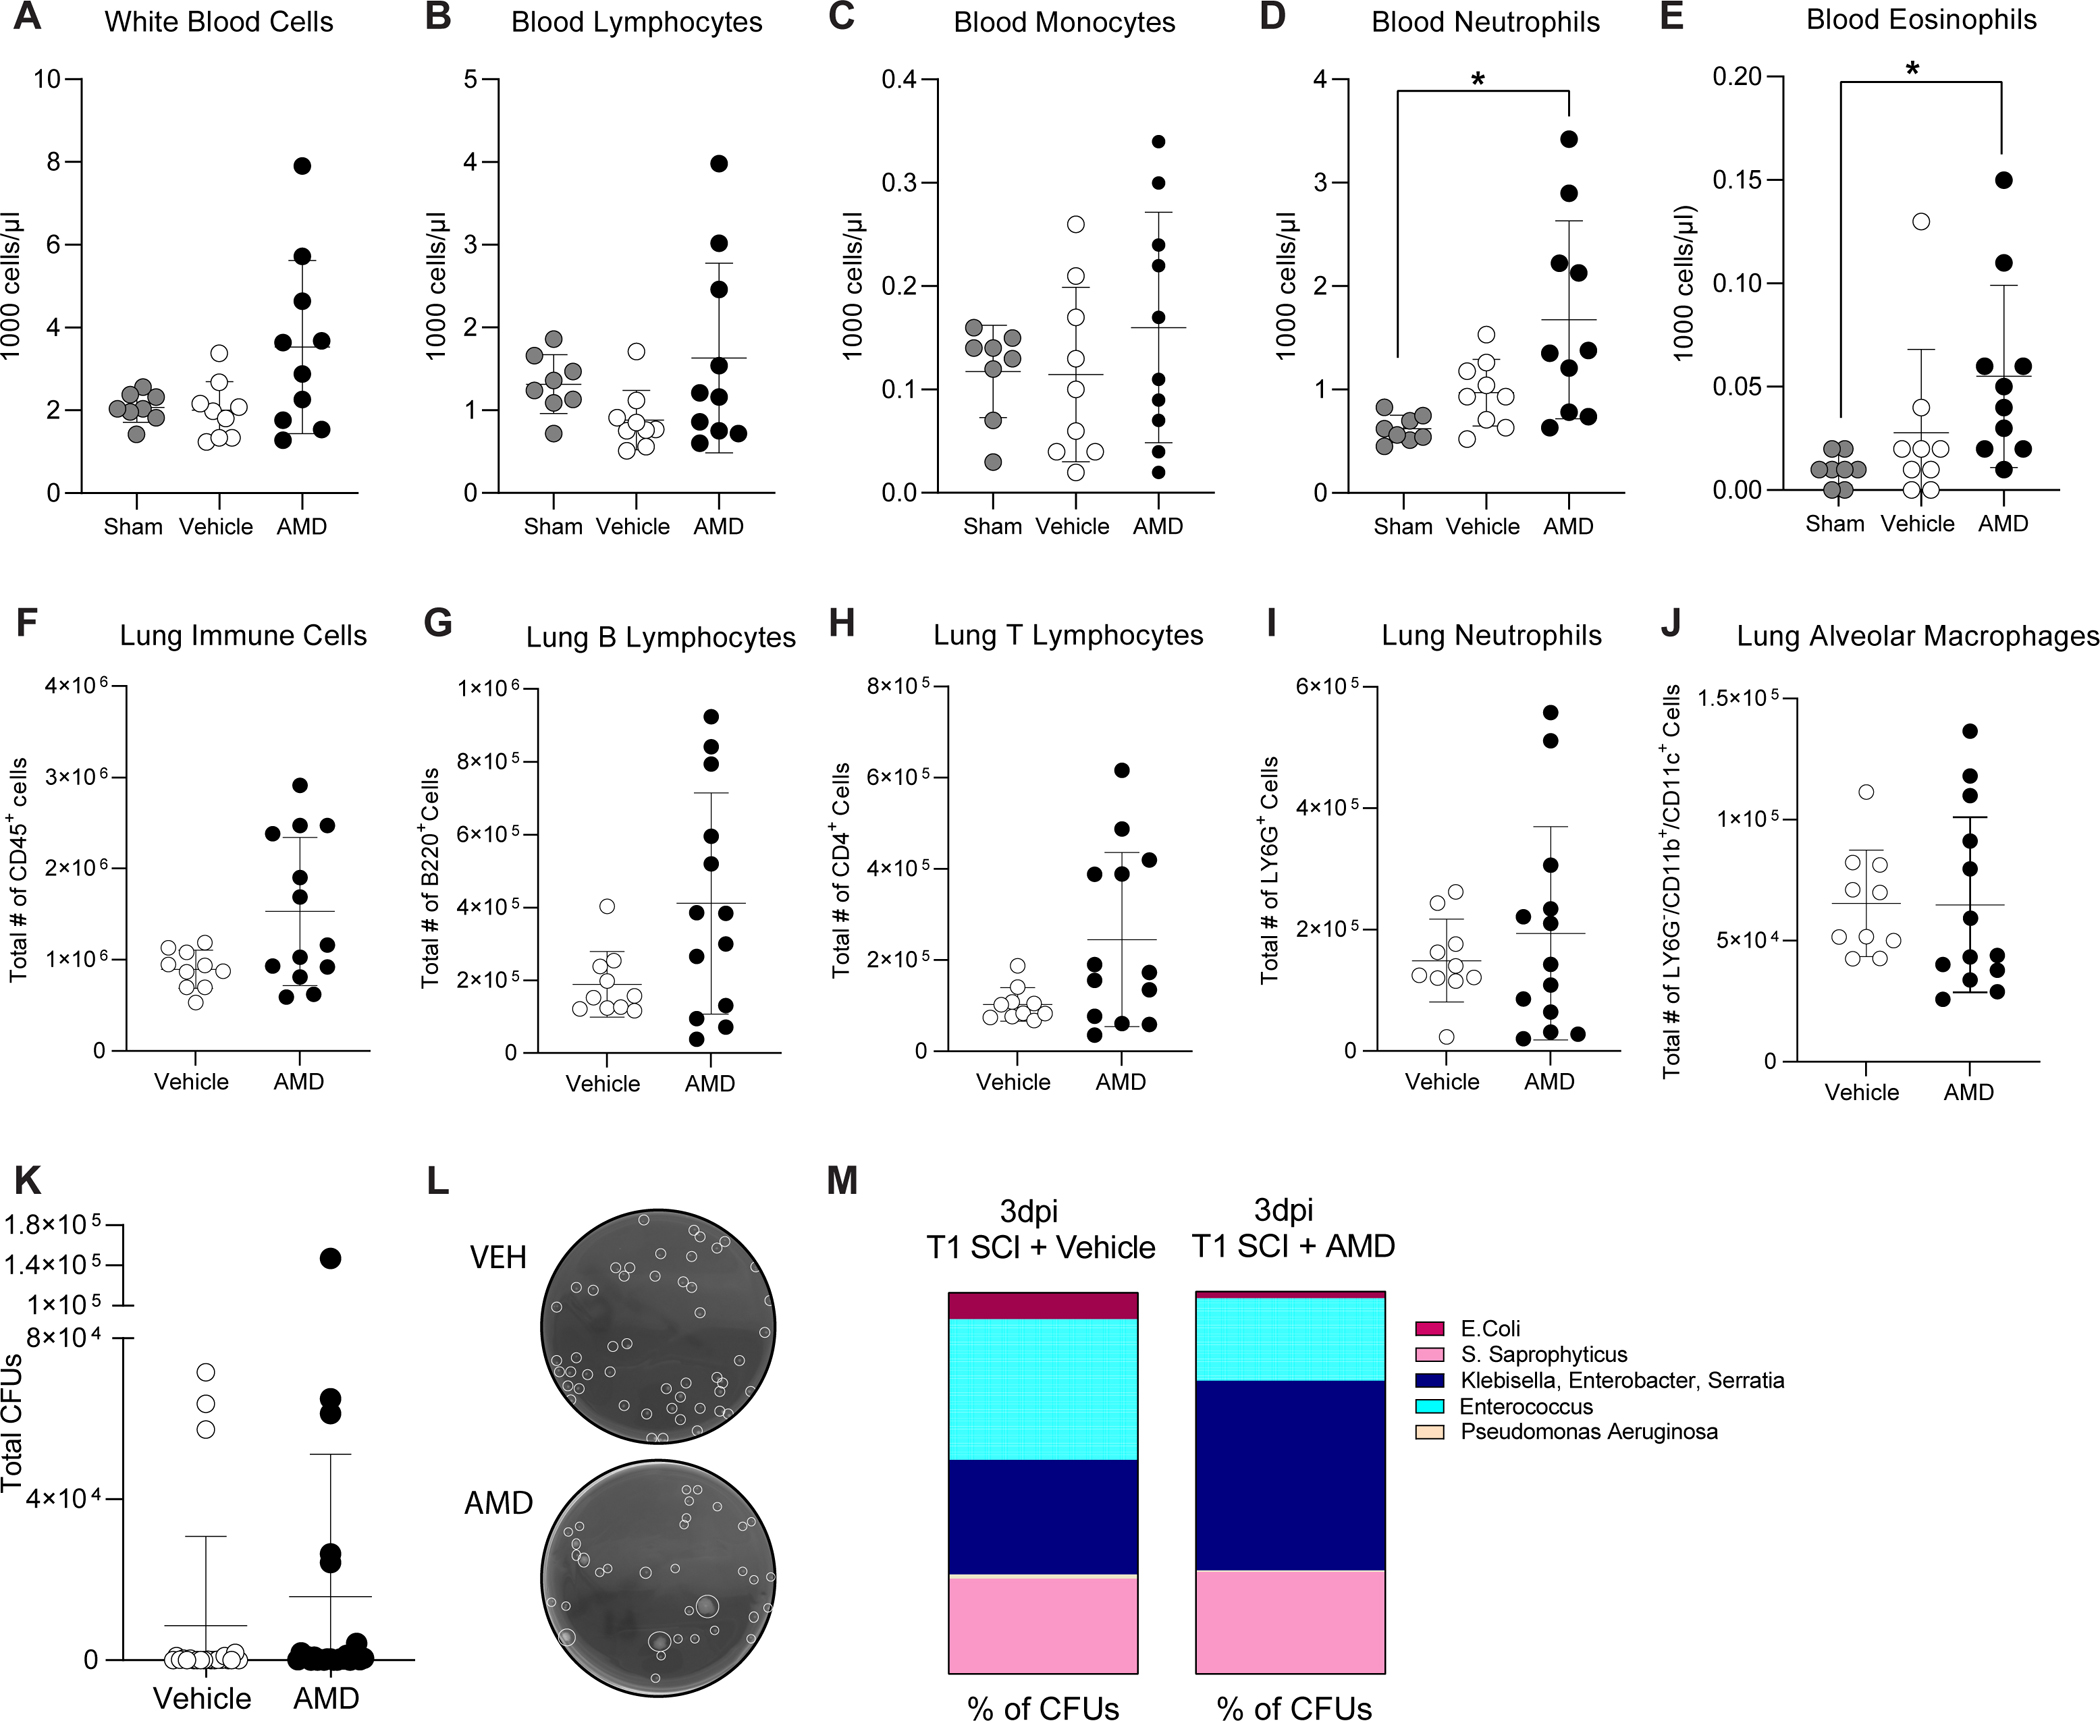
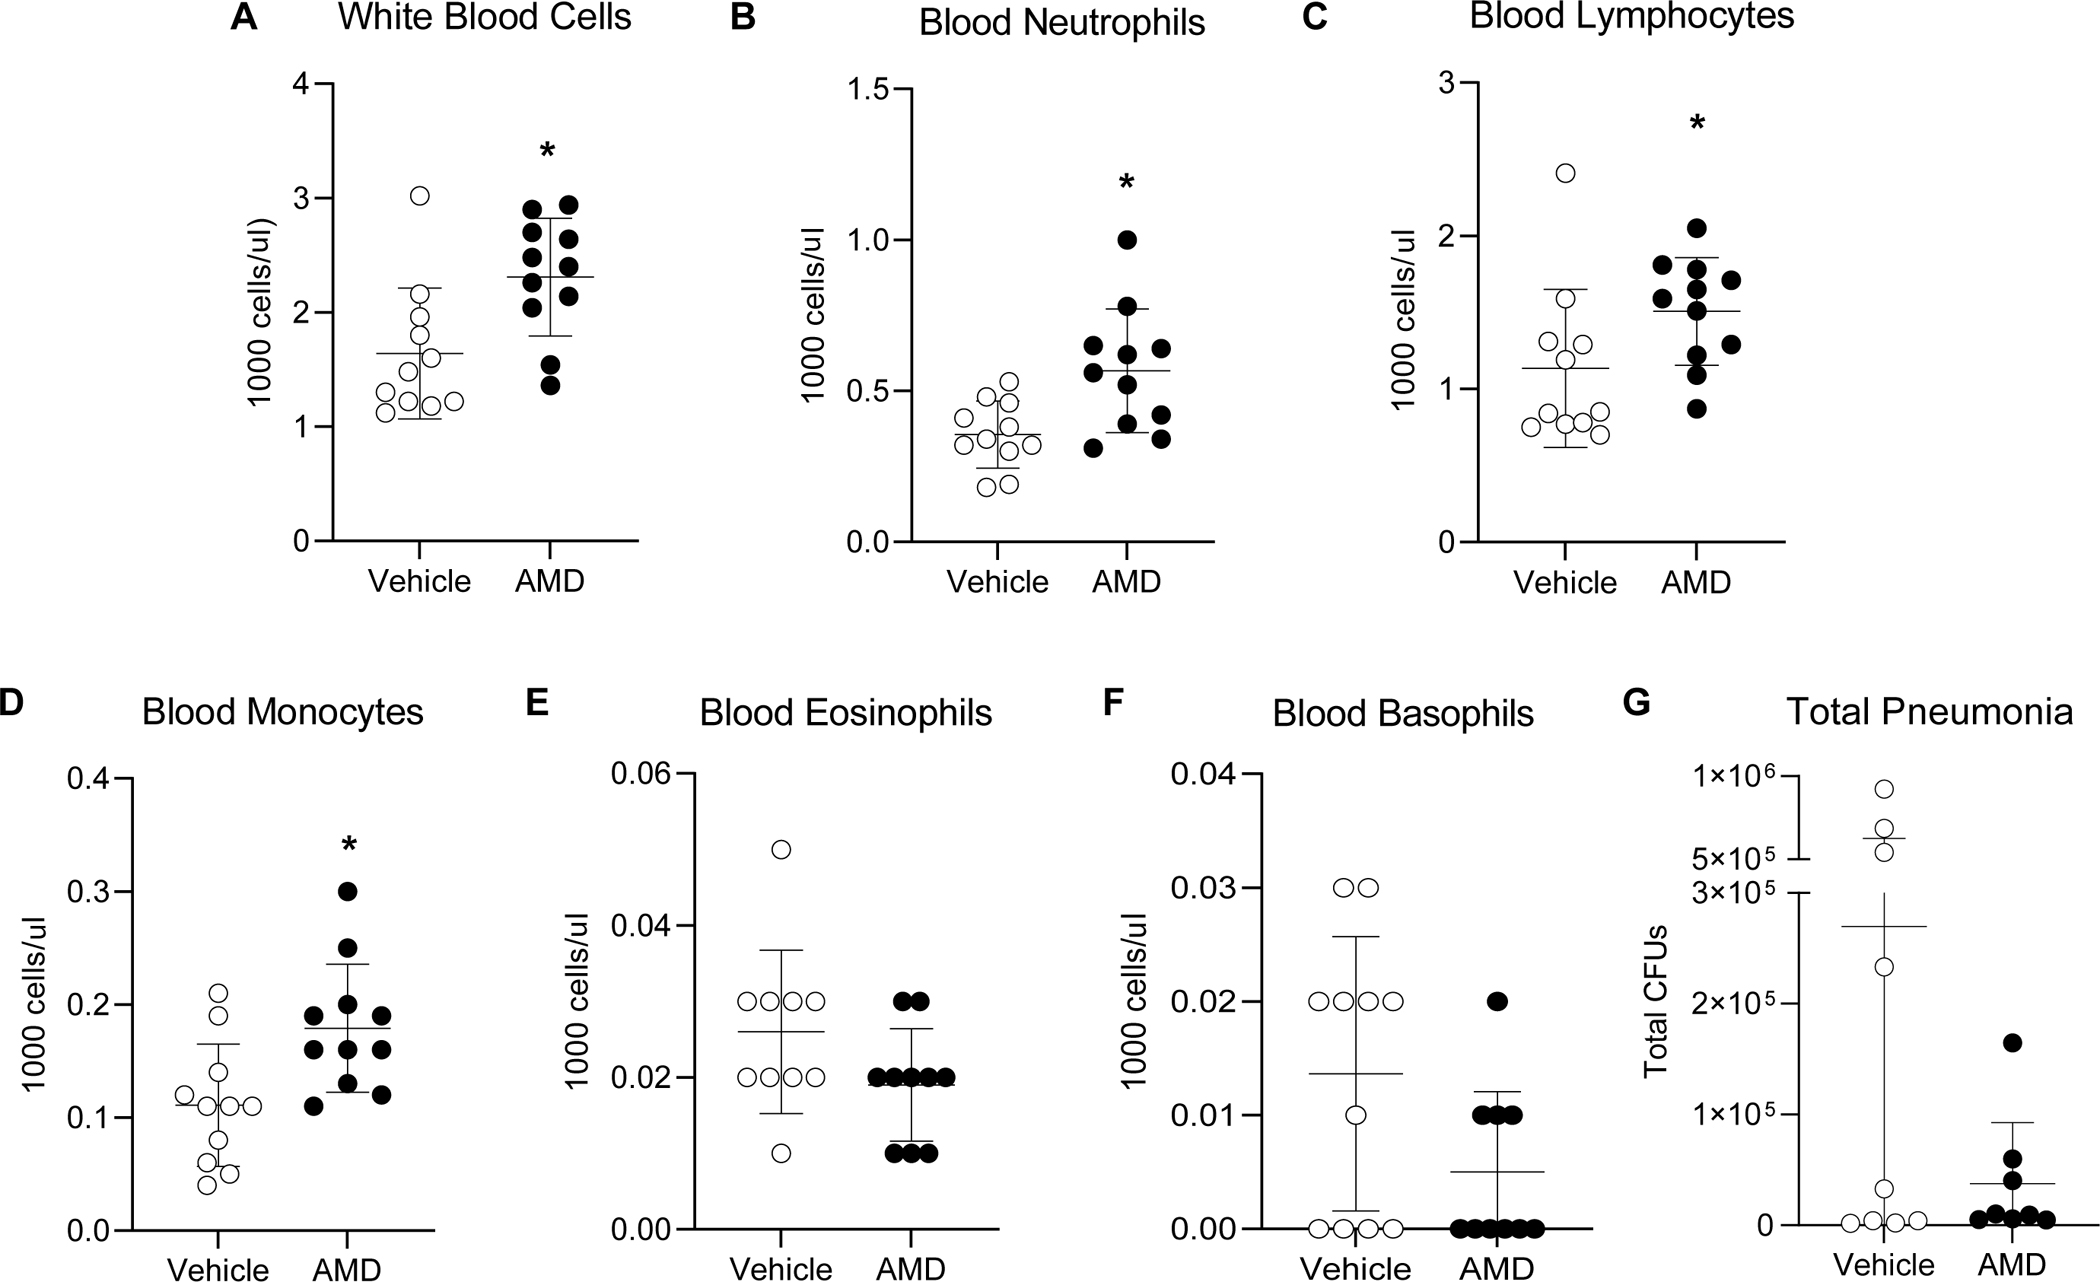
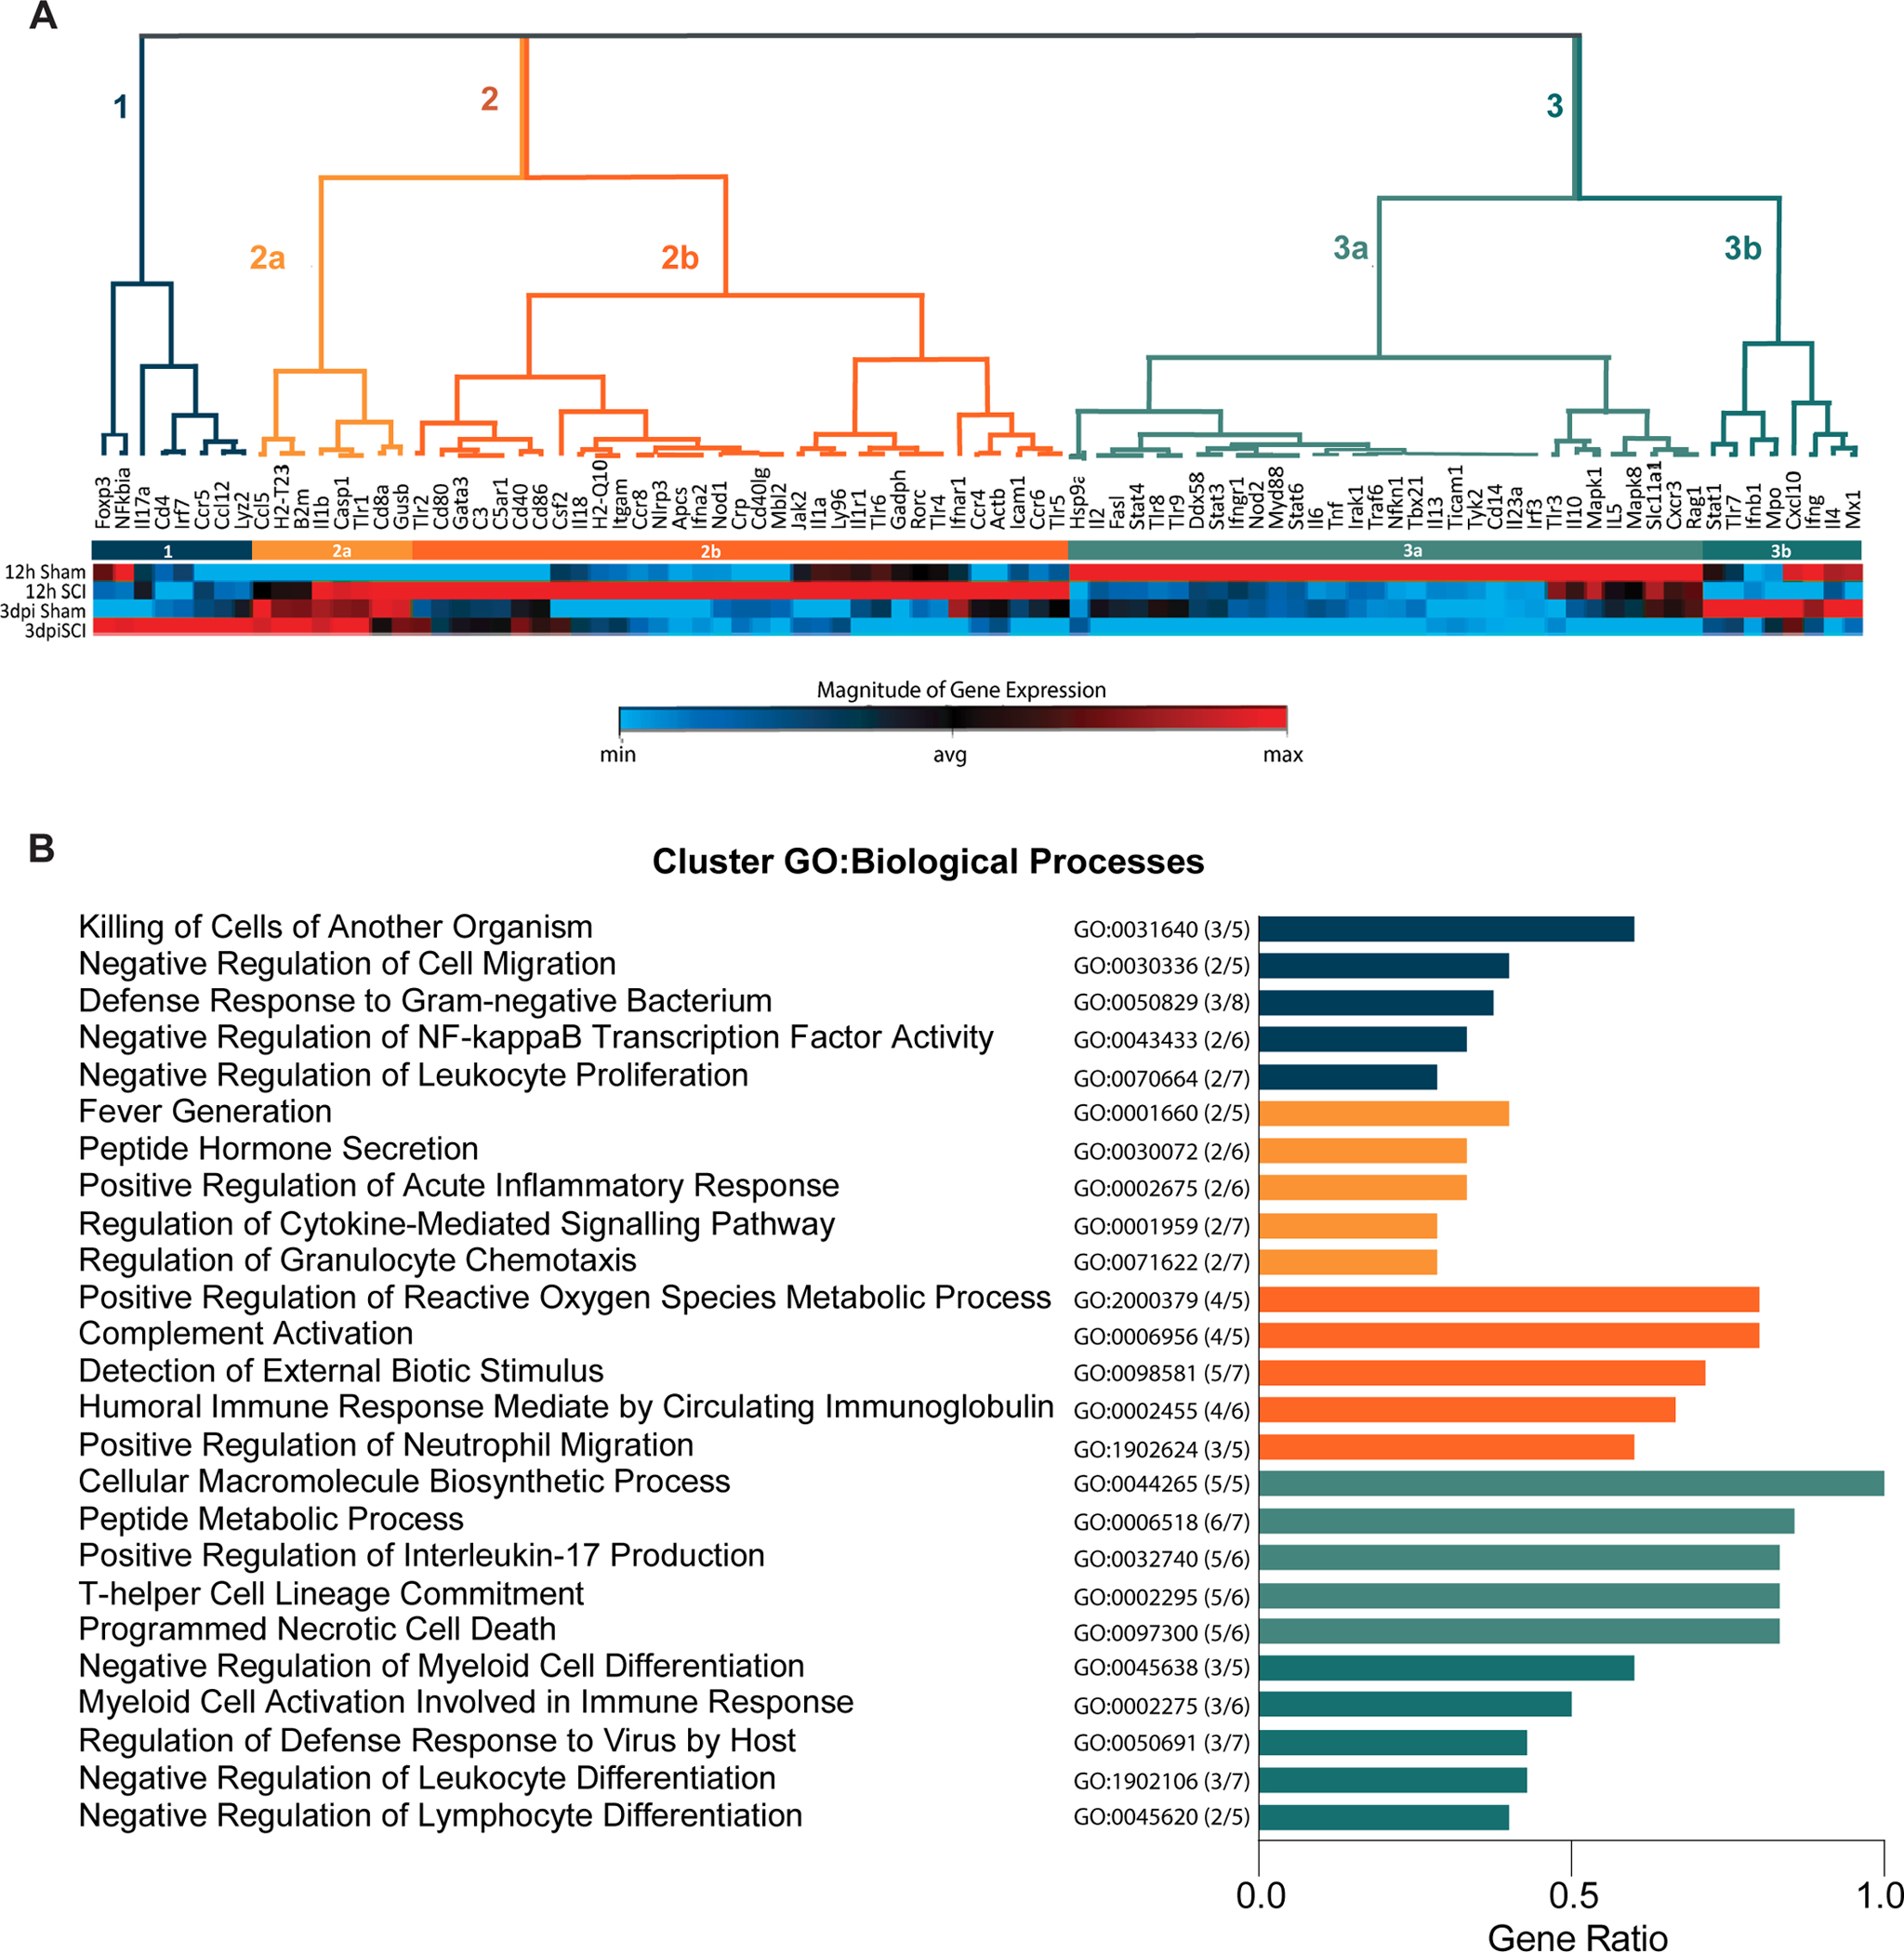
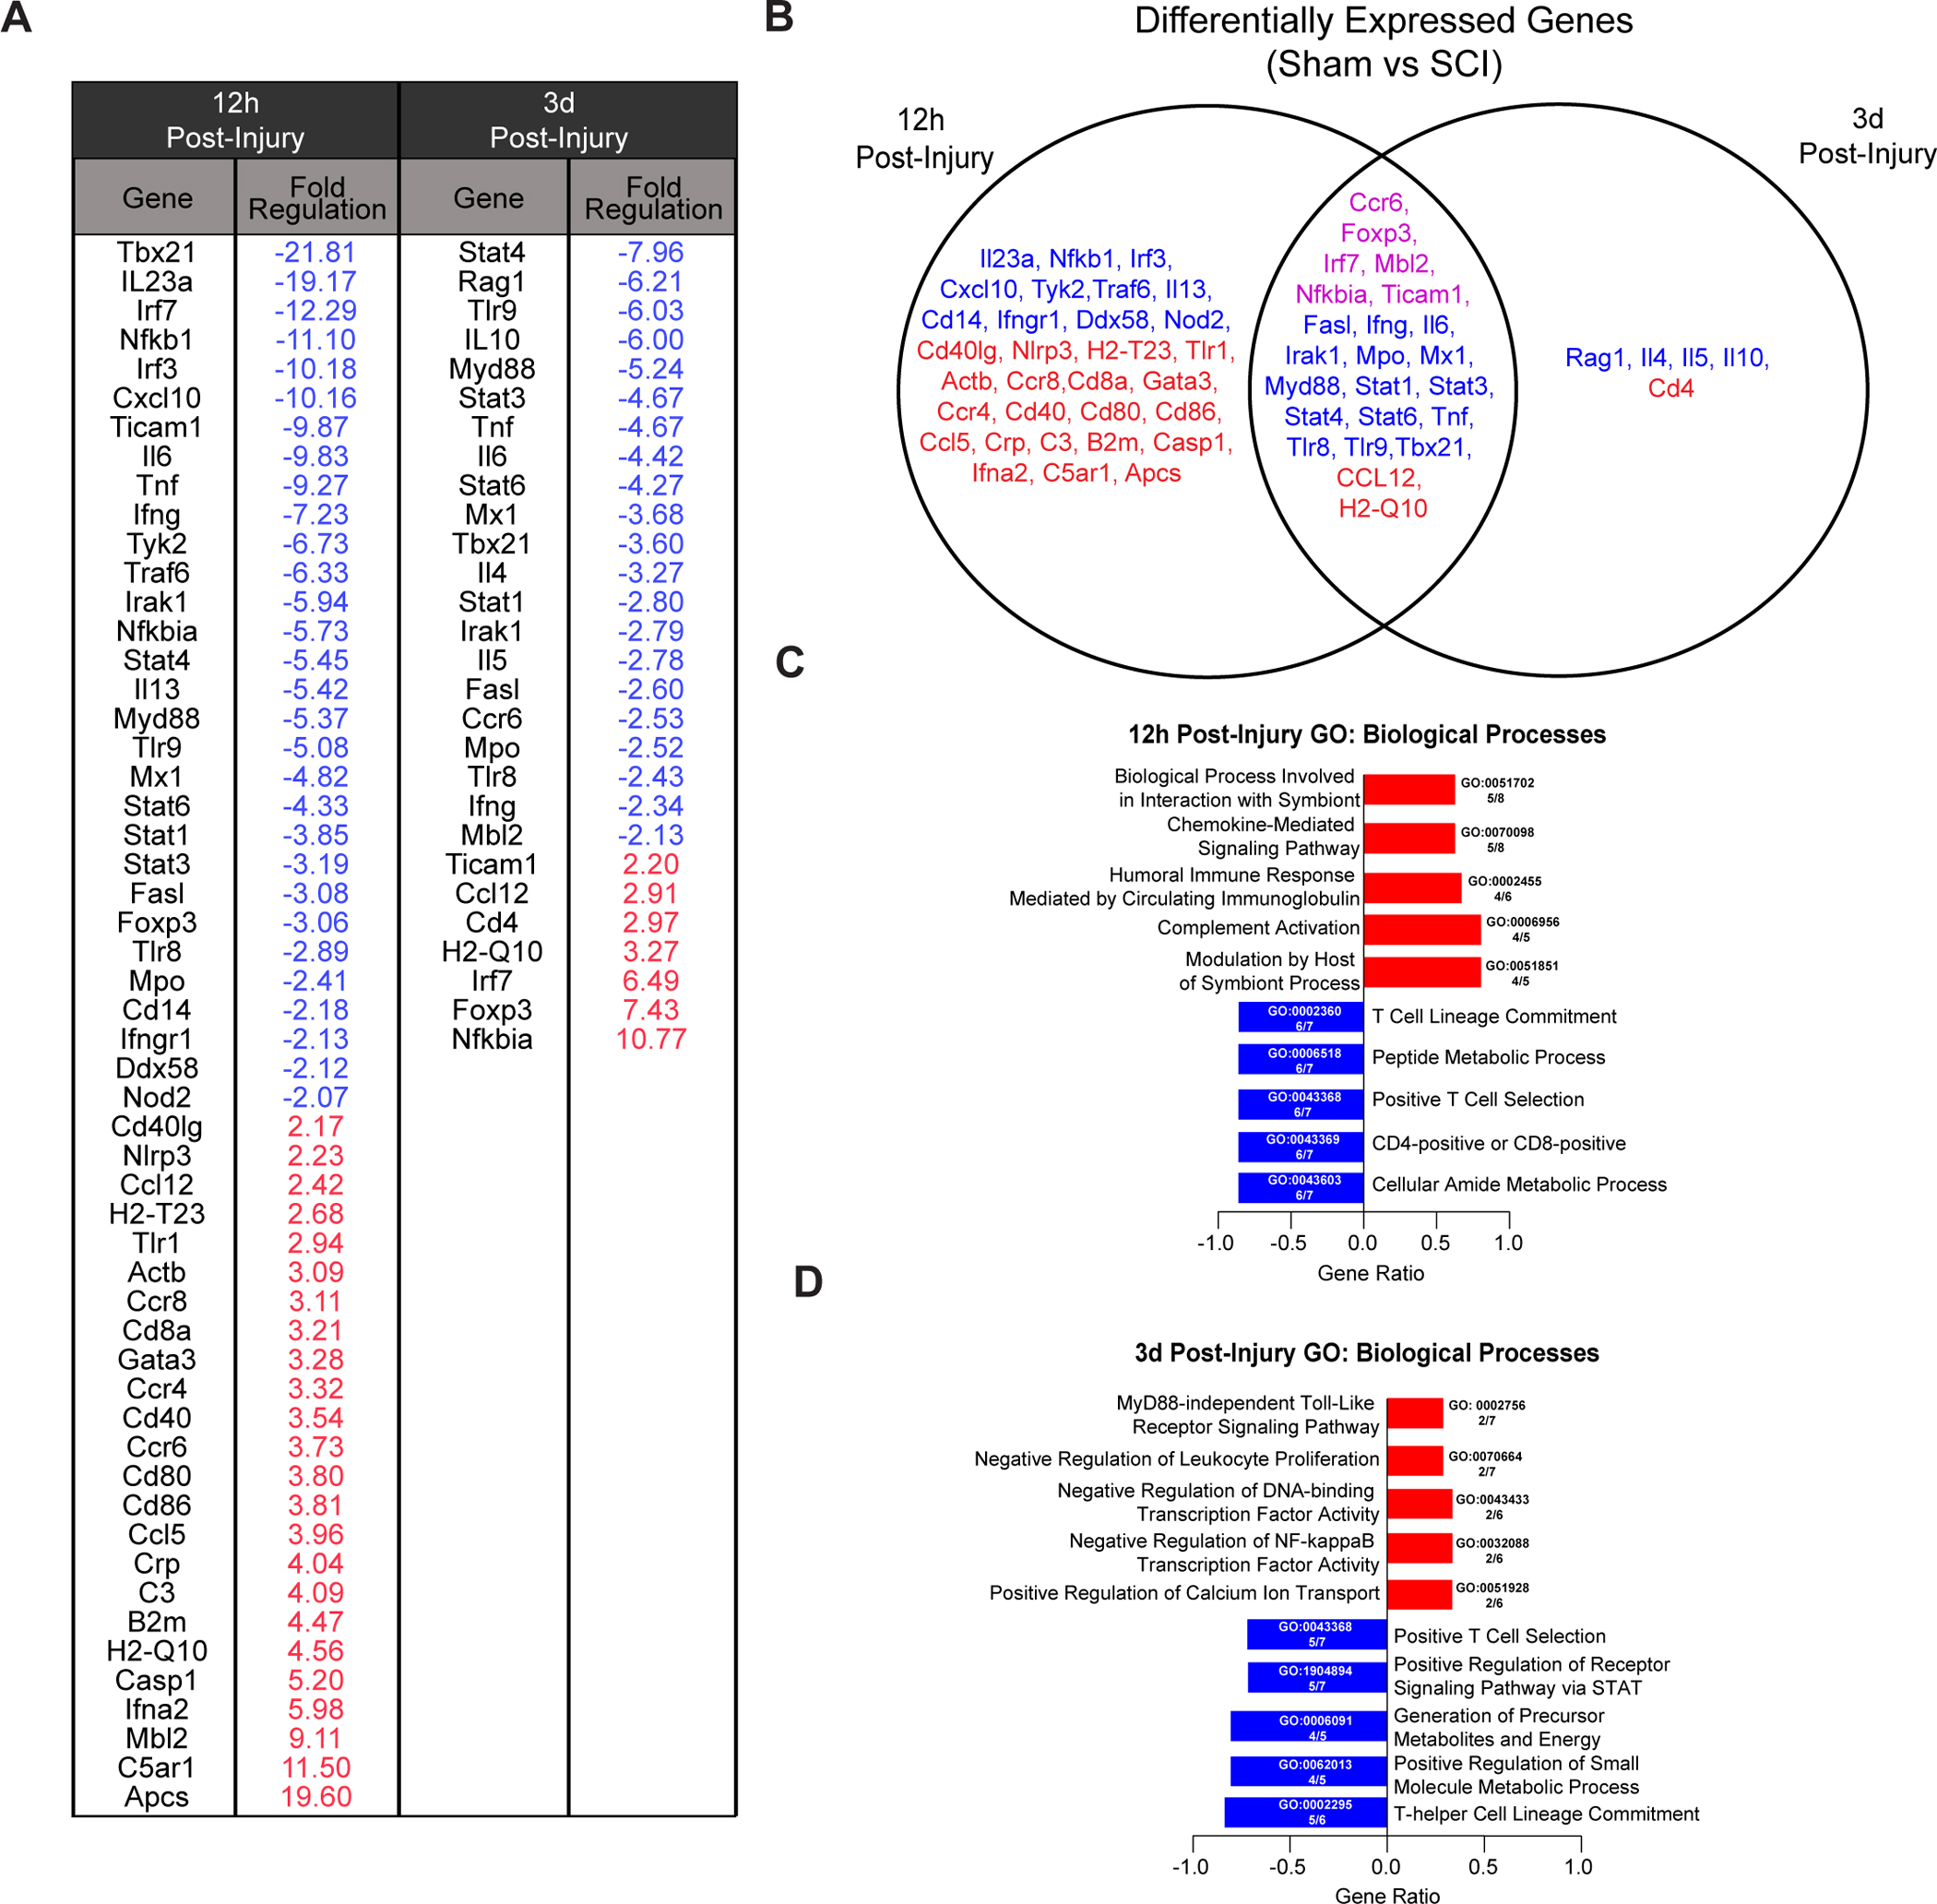
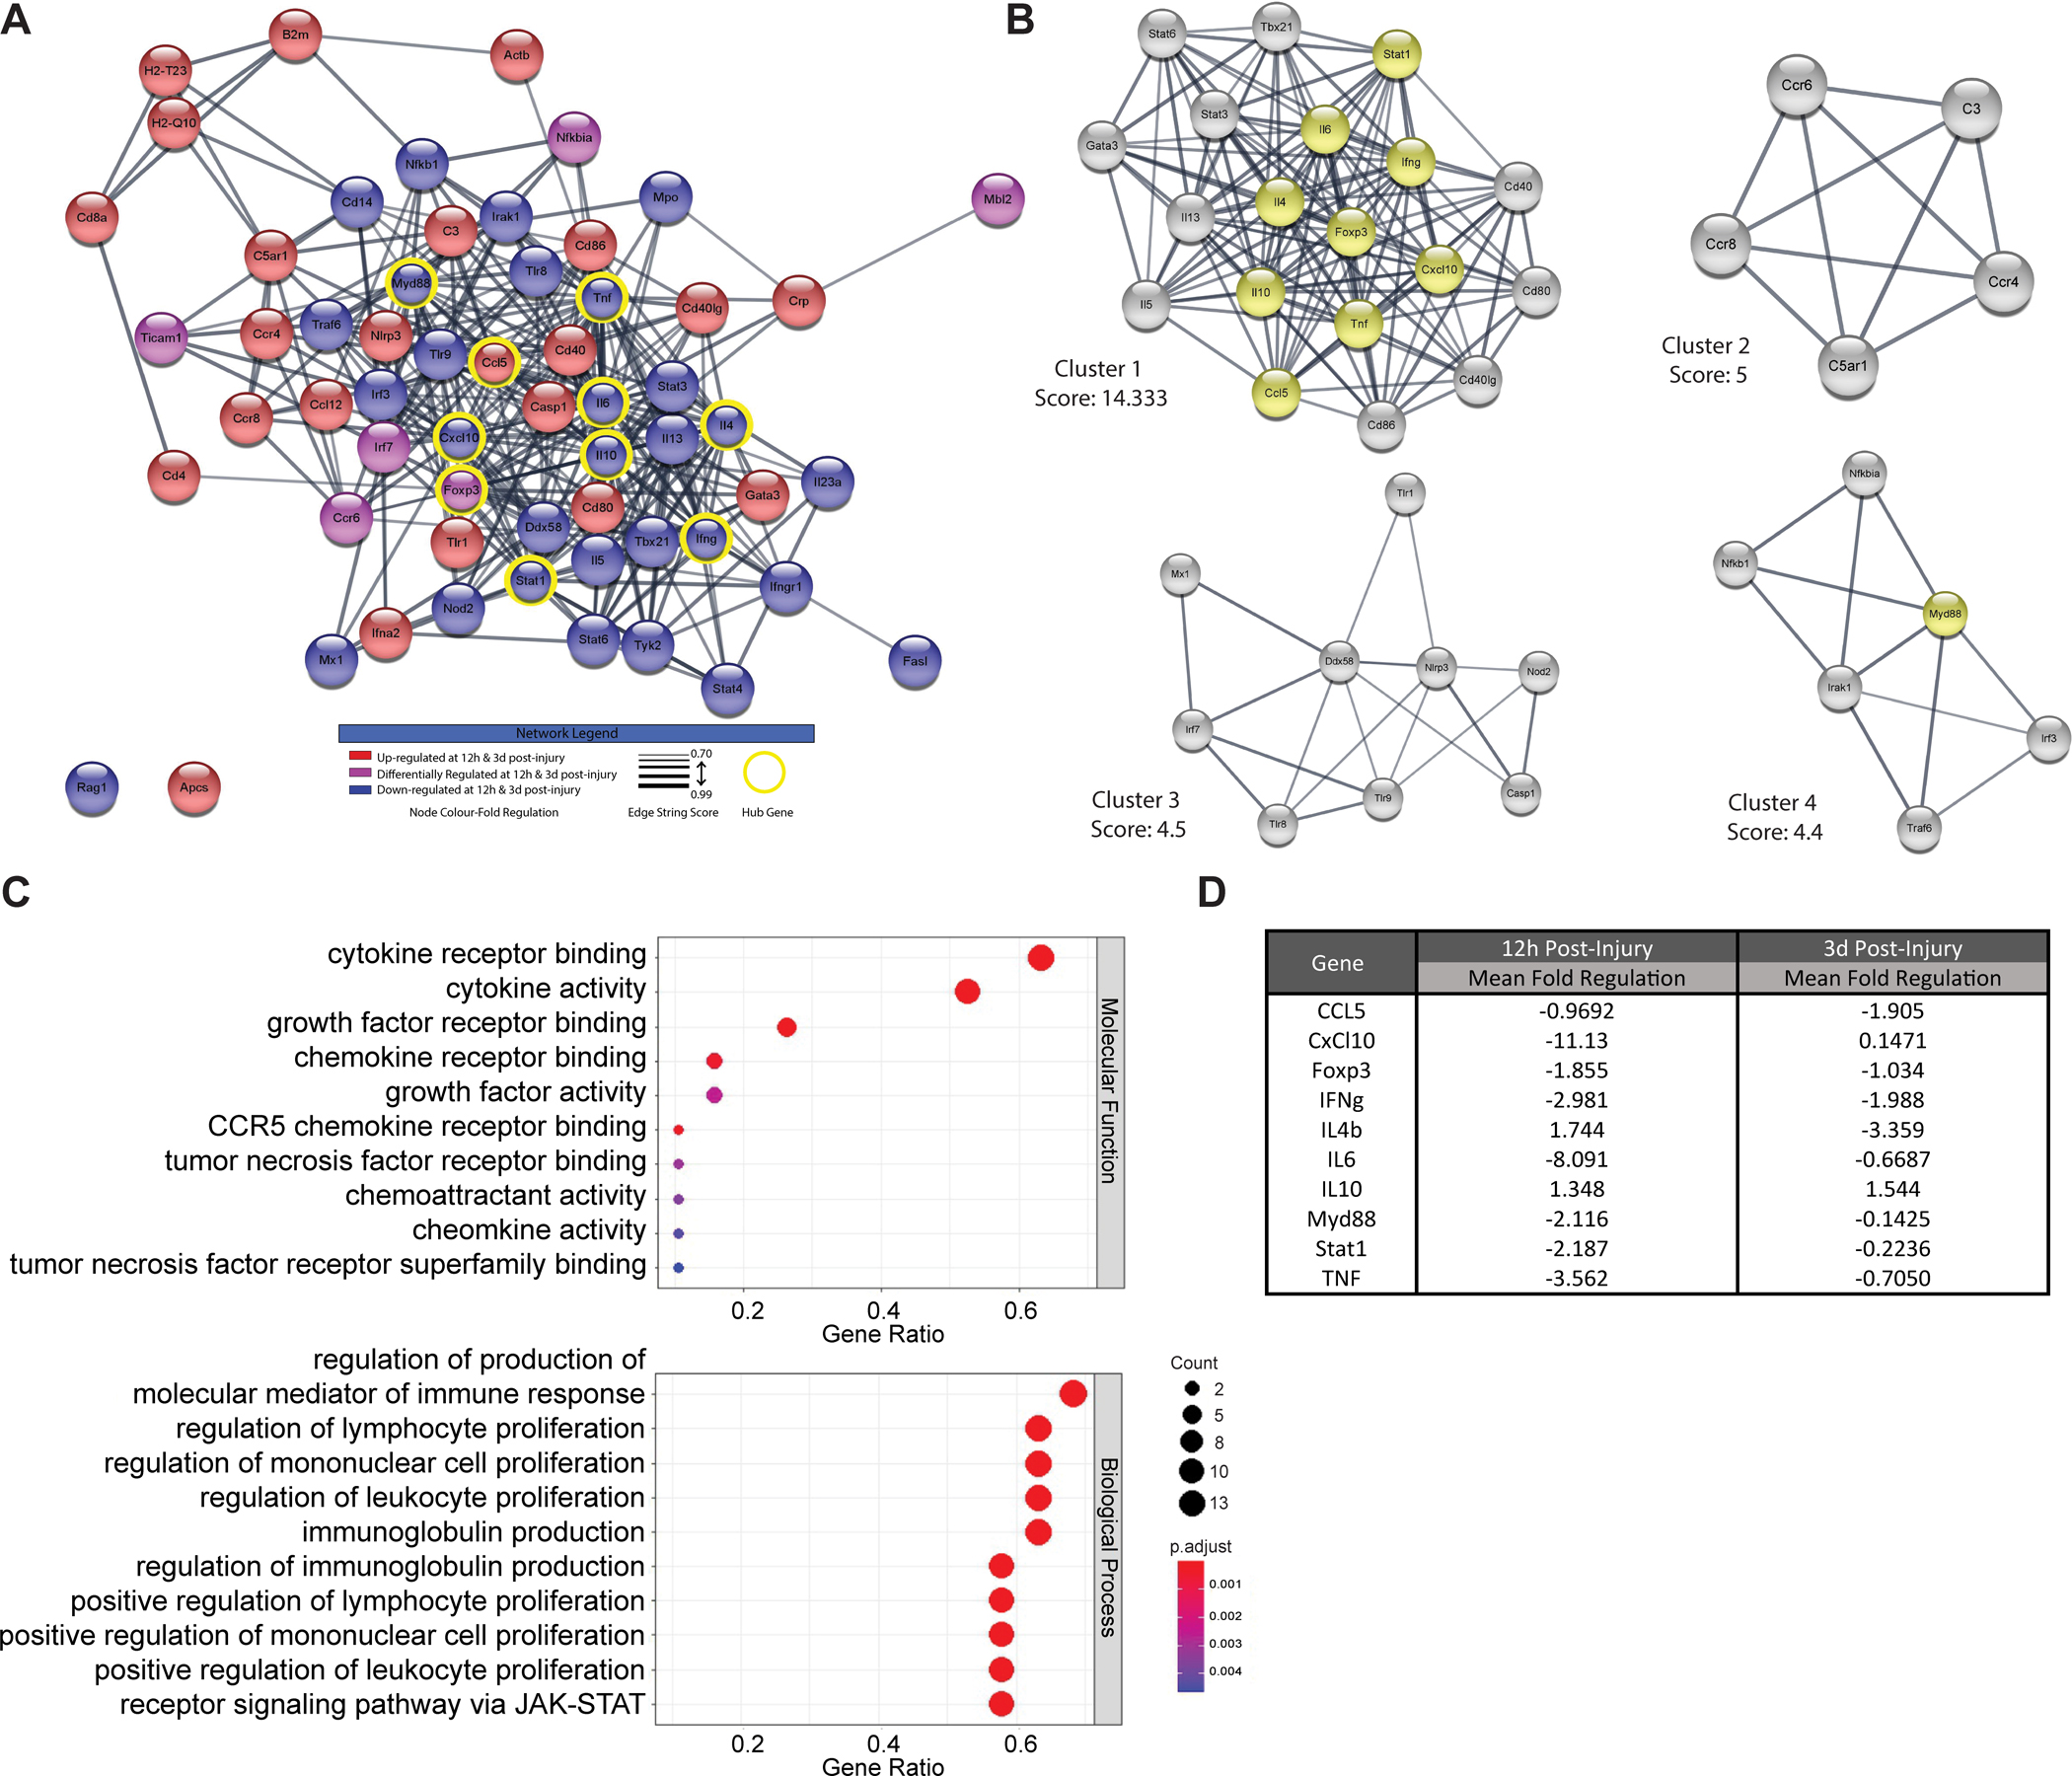
Pulmonary infection is a leading cause of morbidity and mortality after spinal cord injury (SCI). Although SCI causes atrophy and dysfunction in primary and secondary lymphoid tissues with a corresponding decrease in the number and function of circulating leukocytes, it is unknown whether this SCI-dependent systemic immune suppression also affects the unique tissue-specific antimicrobial defense mechanisms that protect the lung. In this study, we tested the hypothesis that SCI directly impairs pulmonary immunity and subsequently increases the risk for developing pneumonia. Using mouse models of severe high-level SCI, we find that recruitment of circulating leukocytes and transcriptional control of immune signaling in the lung is impaired after SCI, creating an environment that is permissive for infection. Specifically, we saw a sustained loss of pulmonary leukocytes, a loss of alveolar macrophages at chronic time points postinjury, and a decrease in immune modulatory genes, especially cytokines, needed to eliminate pulmonary infections. Importantly, this injury-dependent impairment of pulmonary antimicrobial defense is only partially overcome by boosting the recruitment of immune cells to the lung with the drug AMD3100, a Food and Drug Administration-approved drug that mobilizes leukocytes and hematopoietic stem cells from bone marrow. Collectively, these data indicate that the immune-suppressive effects of SCI extend to the lung, a unique site of mucosal immunity. Furthermore, preventing lung infection after SCI will likely require novel strategies, beyond the use of orthodox antibiotics, to reverse or block tissue-specific cellular and molecular determinants of pulmonary immune surveillance.


Conflict of interest statement

Conflict of Interest Statement: The authors declare no competing financial interests.

Figures

Figure 1.
Figure 1.. SCI causes acute pulmonary neutrophilia with delayed and persistent lymphopenia and a reduction in alveolar macrophages
(A) Representative flow cytometry plots for Ly6G+ neutrophils from the 12h timepoint for sham and SCI mice. (B) At 12h post-injury, neutrophil numbers were increased in SCI mice, but this increase was gone by 3d (C) and 28d (D) post-injury. (E) Representative flow cytometry plots for CD4+ T-lymphocytes from the 3d timepoint for sham and SCI mice. (F) There was no change in CD4+ T-lymphocyte number at 12h, but there was decrease in total cell number at both 3d (G) and 28d (H) post-injury. (I) Representative flow cytometry plots for B220+ B-lymphocytes from the 3d timepoint for sham and SCI mice. A similar pattern of results was seen over time with total B220+ B-lymphocyte number with no difference in total cells at 12h (J), followed by a decrease in total cell number at 3d (K) and 28d (L) post-injury in SCI mice. (M) Representative flow cytometry plots for alveolar macrophages from the 28d post-injury timepoint for sham and SCI mice. No difference in alveolar macrophage total cell number was seen at either 12h (N) or 3d post-injury (O) between groups. A significant reduction in alveolar macrophage number was seen at 28d (P) post-injury in SCI mice. For 12h data experiments, n=8–12 mice/group combined from three replicate experiments, for 3d experiments, n=12 mice/group combined from three replicate experiments, and for 28d experiments n=12 mice/group combined from three replicate experiments. Statistical outliers detected using the ROUT method, were removed from analysis (n=1 Sham mouse in 1B; n=1 each Sham and SCI in 1D; n=1 Sham in 1G, and n=1 Sham in 1K) prior to Mann Whitney U analysis, *p<0.05. Bars represent mean ± SD.
Figure 2.
Figure 2.. Spontaneous bacterial infection develops in the lung after SCI.
(A) Lung homogenates plated on blood agar plates from 12h (1:10 dilution), 3d (1:10 dilution), and 28d (1:200 dilution) post- injury (hpi/dpi), from sham injured mice and cultured for 24h. White circles highlight areas of bacterial growth. (B) No change in spontaneous bacterial growth from Sham mice lungs at any timepoint. (C) Representative blood agar plates from 12hpi, 3dpi, and 28dpi T3Tx SCI mice. White circles highlight areas of bacterial growth. (C) There was a significant increase in spontaneous bacterial growth at both 12hpi and 3dpi compared to 3dpi in SCI mice lungs. n=7 12h & 3dpi T3Tx and 3dpi sham mice combined from two replicate experiments, n=12–14 28dpi sham mice, n=12–14 28dpi SCI mice combined from three replicate experiments. Kruskal-Wallis test U analysis with Dunn’s multiple comparisons test, *p<0.05. Bars represent mean ± SD.
Figure 3.
Figure 3.. Spontaneous lung bacterial infections and leukopenia persist after T1 SCI.
(A) Lung homogenates (1:200 dilution) plated on blood agar plates from 3d post-injury (dpi) sham-injured or T1 transection SCI mice and cultured for 24h. Spontaneous bacterial growth from SCI mice lungs increased at 3dpi. (B) Representative blood agar plates from sham-injured or T1 SCI mice. (C) Example CHROMagar™ plates from 3dpi SCI mice chosen to demonstrate the different bacteria identified in sham mice (top row) and T1 SCI mice (bottom row) (D) Bar graphs showing the percentage of each bacteria type in cultured lung homogenate for sham and T1 SCI mice at 3dpi. Flow cytometry analysis on T1 sham and T1 SCI lungs at 3dpi show the development of immune suppression in the lung. While no change in neutrophils (E) was seen, a significant loss of T-cells (F), B-cells (G), and alveolar macrophages (H) occurred. n=18 T1Tx, n=13 T1 Sham mice for bacterial assays from three replicate experiments, n=7/group for flow cytometry analysis from one experiment. Mann Whitney U analysis, *p<0.05. Bars represent mean ± SD.
Figure 4.
Figure 4.. Treatment with AMD3100 increases circulating leukocytes and boosts pulmonary immune responses after SCI but without affecting spontaneous bacterial infections in the lung.
(A-E) Quantification of 3dpi lung flow cytometry data of mice with T1Tx SCI and treated daily with either AMD3100 (AMD) or saline (Vehicle). Overall treatment with AMD3100 boosted levels total levels of white blood cells (WBC; A) lymphocytes (LY; B) and monocytes (MO; C) were boosted and levels of neutrophils (NE; D) and eosinophils (EO) were significantly elevated (E) with treatment. AMD3100 also boosted total immune cells (F), B lymphocytes (G) and T lymphocytes (H), but neutrophils and alveolar macrophages were unchanged (I,J). Treatment with AMD3100 did not alter total CFUs in the lung after injury, as seen in the quantification (K) and in the representative blood agar plates (1:200 dilution) (L). AMD3100 treatment also did not alter the type of bacteria seen on CHROMAgar™ plates (M). n=10 vehicle and n= 13 AMD3100 mice for flow analysis pooled from three replicate experiments, n=23 vehicle and n=27 AMD3100 mice for bacterial analysis combine from four replicate experiments, and n=8 sham, n=9 vehicle mice and n=10 AMD3100 mice for blood count analysis from one experiment. Kruskal-Wallis test with Dunn’s multiple comparisons test (A-E) or Mann-Whitney U analysis (F-K), *p<0.05, Bars represent mean ± SD.
Figure 5.
Figure 5.. AMD3100 treatment improves pulmonary immune surveillance and reduces bacterial colonization in SCI mice with induced pneumonia.
(A-E) Quantification of 3dpi whole blood automated cell count data of mice with T3 transection SCI and induced pneumonia who were treated daily with either AMD3100 (AMD) or saline (Vehicle). Overall treatment with AMD3100 significantly increased total white blood cells counts (A), neutrophils (B), lymphocytes (C), and monocyte numbers (D). Blood eosinophil (E) and basophil (F) counts were not changed with treatment. (G) Quantification of 4d post- injury (and 24h after pneumonia inoculation) injury induced pneumonia bacterial growth (pneumonia specific counts) in the lungs of mice with T3 SCI and treated with either AMD) or Vehicle. While there was no significant difference between treatment groups there was a strong trend towards a reduction in total CFU counts in AMD3100 treated mice as 4 out of 9 of mice (44.4%) in the vehicle treated group had a high bacterial compared to 1 out of 8 of mice (12.5%) in the AMD treatment group. n=11 vehicle and n=11 AMD3100 mice from one experiment. Statistical outliers detected using the ROUT method were removed for analysis (n=1 mouse in AMD group in 5E; n=1 mouse each in AMD and Veh in 5F, and n=2 mice in AMD group in 5G). Mann-Whitney U analysis (A-G), * p>0.05, Bars represent mean ± SD.
Figure 6.
Figure 6.. SCI impairs the coordinated expression of genes controlling immune resistance to pathogens and tissue resilience in the lung.
(A) Heat map of gene expression patterns after hierarchical clustering analysis of lung homogenates at 12h, and 3d post- injury. Red and blue represent high and low gene expression, respectively. (B) Top gene ontology (GO) biological process terms associated with PCR array clusters, colour coded to match the diagram in A. Count indicates the number of DEGs represented in the associated GO Term. n = 4/group pooled for PCR array analysis from one experiment.
Figure 7.
Figure 7.. SCI disrupts molecular pathways regulating immune resistance and tissue resilience in a time-dependent fashion.
(A) Table of genes differentially expressed (genes ≥ 2-fold regulation) in SCI lungs relative to Sham lungs at each timepoint. (B) Venn diagram showing the number and names of differentially expressed genes (fold change ≥ 2) shared between each timepoint. Blue text indicates downregulated genes in SCI lungs, while red indicates upregulation when compared to corresponding shams at 12h an 3d post-injury. Purple text indicates genes that were up- and down-regulated in SCI lungs at different timepoints. (C) Top gene ontology (GO) biological process terms associated with differentially expressed genes in SCI lungs relative to Sham at each timepoint. Count indicates the number of DEGs represented in the associated GO Term. n = 4/group pooled for PCR array analysis from one experiment.
Figure 8.
Figure 8.. Protein-Protein Interaction and Hub Gene Analysis of Differentially Expressed Genes identifies disrupted cytokine pathways after SCI.
(A) Differentially expressed genes (DEGs; fold regulation ≥2) from both 12h and 3d post-injury were inputted into the STRING network database and used to create a Protein-Protein Interaction (PPI) network from and then visualized with Cytoscape. A total of 59 nodes and 329 edges were identified in the network. Genes up-regulated at both timepoints are in red and those down-regulated at both timepoints are in blue. Gene who are up- or down-regulated differently at the two timepoints are in purple. The top 10 network hub genes (outlined in yellow) were identified using CytoHubba in Cytoscape. (B) Densely interconnected sub-regions in the PPI network were identified using the MCODE algorithm. Four major clusters were found. All identified hub genes were represented in the clusters, with the majority of the hub genes (9/10, identified as those in yellow) being found in Cluster 1, the most interconnected cluster. (C) As a result, the genes represented in Cluster 1 were analysed for their related GO:Terms using the enrichGo function in the clusterProfiler package in R. The top 10 Molecular Function and Biological Process GO:Terms were identified. The top ten terms were determined by selecting those with the smallest adjusted p-value after correction for multiple comparison with the Benjamini-Hochberg Procedure. The gene ratio represents the number of DEGs in the terms compared to the total number of genes and the count is the number of DEGs genes found in the respective GO:Term. D) RT-PCR Analysis results of 10 identified hub genes at each timepoint in individual (n=4/group from one experiment) to validate PCR array results.

Similar articles

Cited by

References

    1. DeVivo MJ, Black KJ, and Stover SL. 1993. Causes of death during the first 12 years after spinal cord injury. Arch. Phys. Med. Rehabil. 74: 248–54. - PubMed
    1. Strauss DJ, DeVivo MJ, Paculdo DR, and Shavelle RM. 2006. Trends in Life Expectancy After Spinal Cord Injury. Arch. Phys. Med. Rehabil. 87: 1079–1085. - PubMed
    1. Failli V, Kopp MA, Gericke C, Martus P, Klingbeil S, Brommer B, Laginha I, Chen Y, DeVivo MJ, Dirnagl U, and Schwab JM. 2012. Functional neurological recovery after spinal cord injury is impaired in patients with infections. Brain 135: 3238–3250. - PubMed
    1. Kopp MA, Watzlawick R, Martus P, Failli V, Finkenstaedt FW, Chen Y, DeVivo MJ, Dirnagl U, and Schwab JM. 2017. Long-term functional outcome in patients with acquired infections after acute spinal cord injury. Neurology 88: 892–900. - PMC - PubMed
    1. Savic G, DeVivo MJ, Frankel HL, Jamous MA, Soni BM, and Charlifue S. 2017. Long-term survival after traumatic spinal cord injury: a 70-year British study. Spinal Cord 55: 651–658. - PubMed

Publication types