. 2022 Jun 13;13(6):548.
doi: 10.1038/s41419-022-04997-1.

Hsp90 induces Acsl4-dependent glioma ferroptosis via dephosphorylating Ser637 at Drp1

Affiliations

Hsp90 induces Acsl4-dependent glioma ferroptosis via dephosphorylating Ser637 at Drp1

Zong Miao et al. Cell Death Dis. .

Abstract

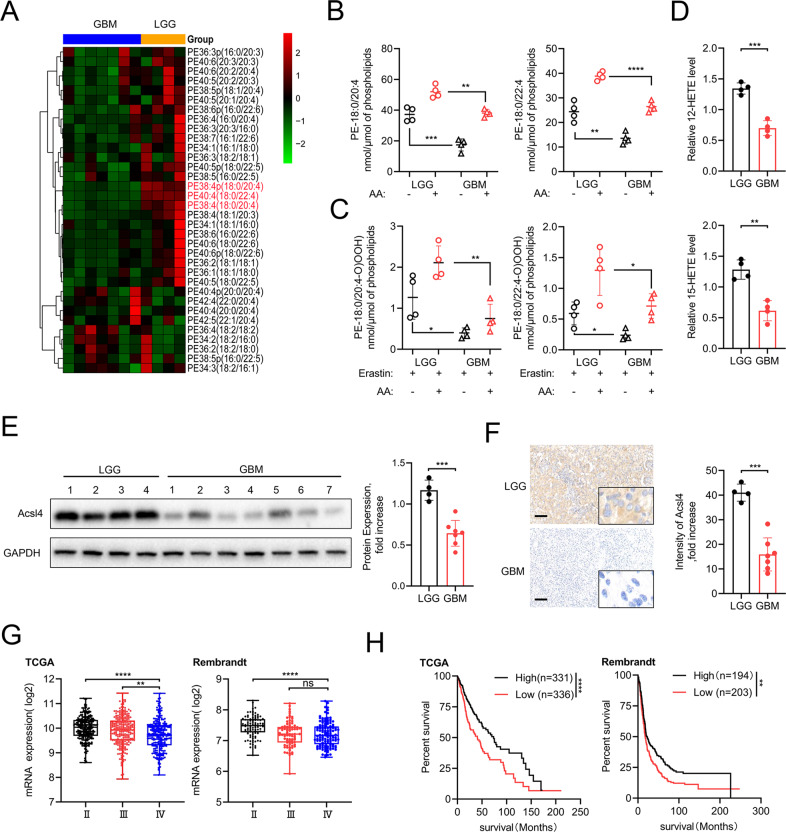
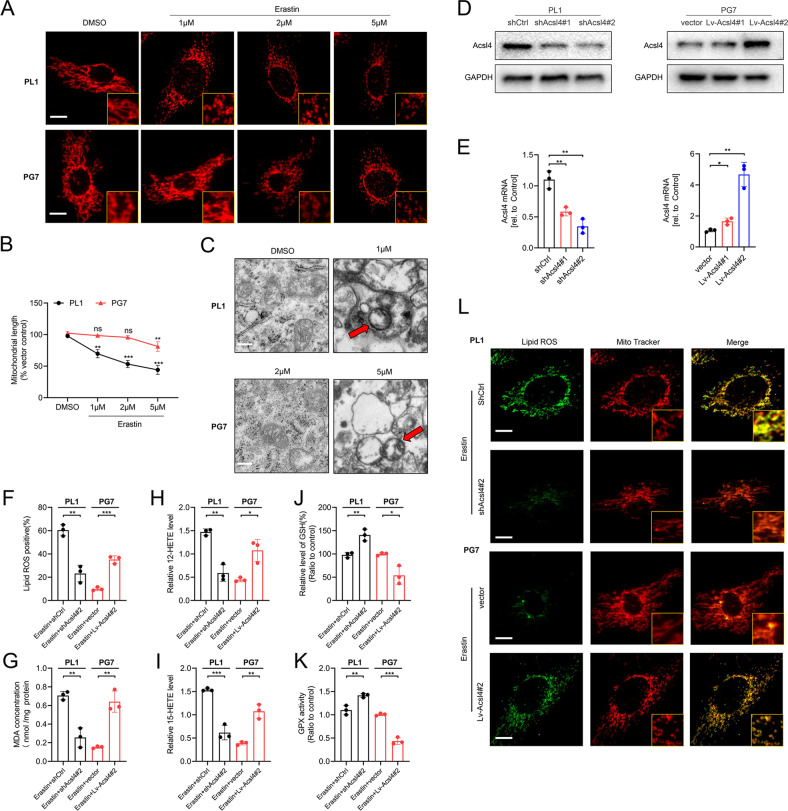
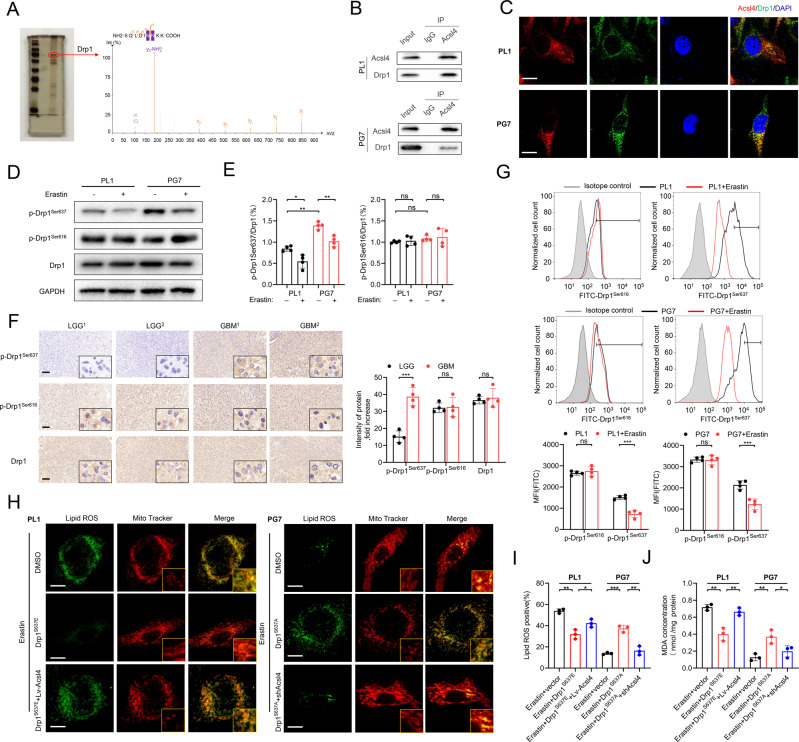
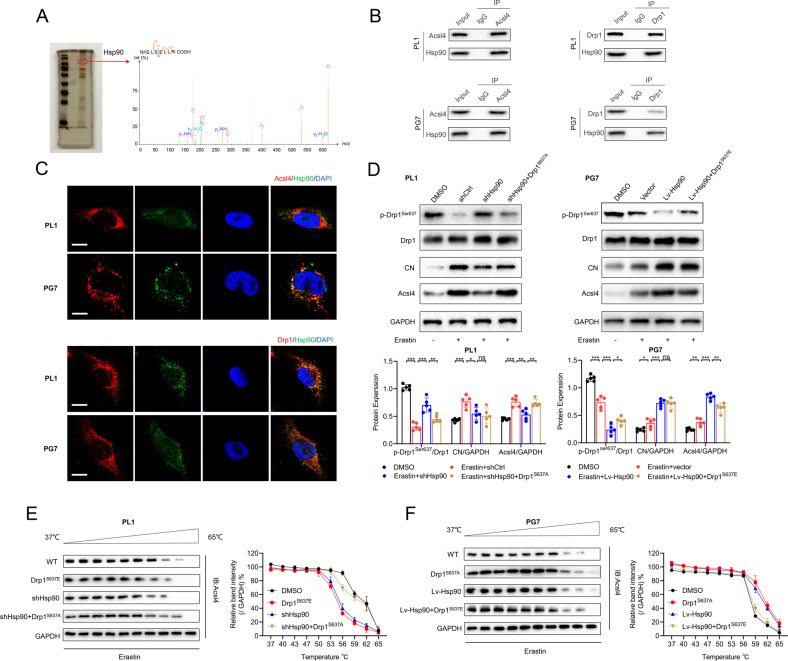
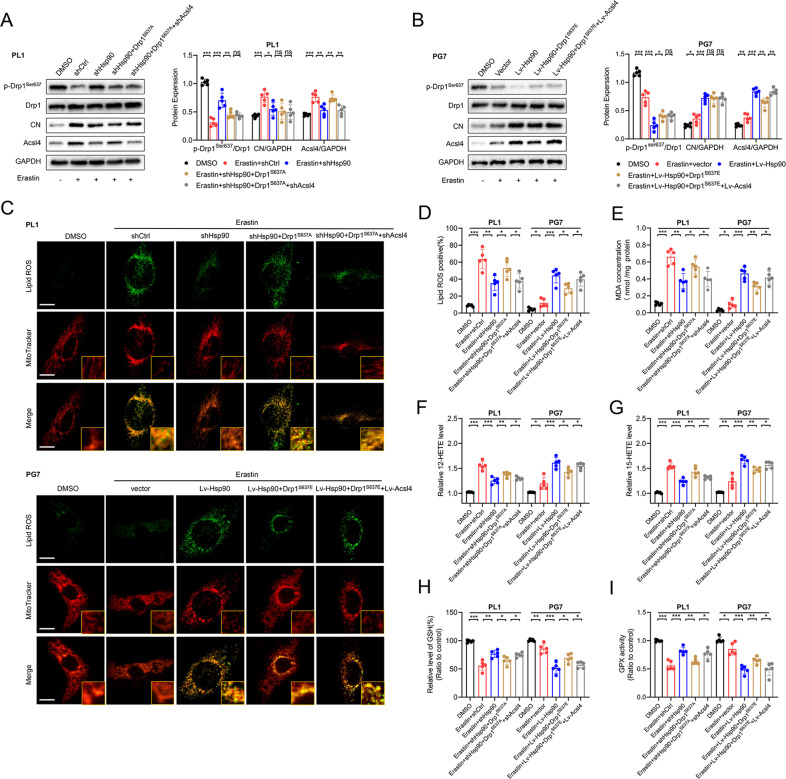
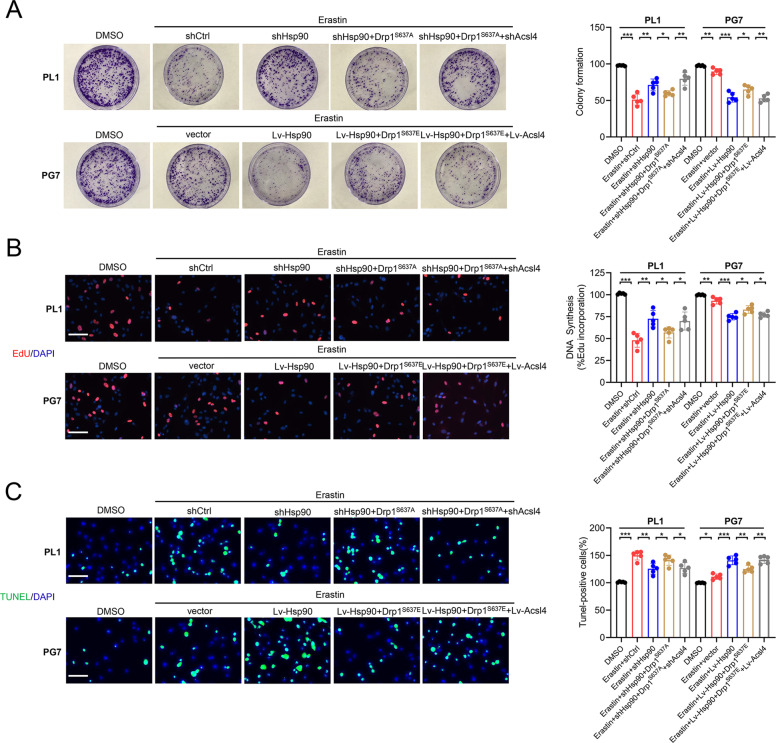
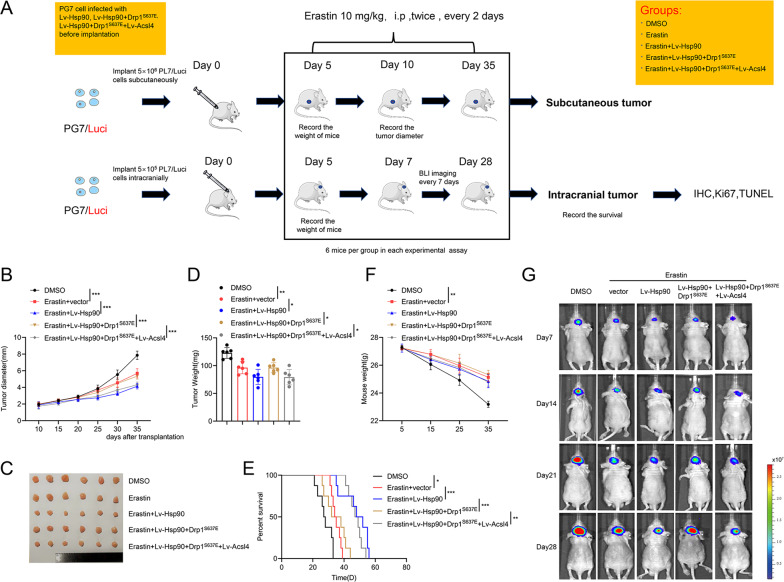
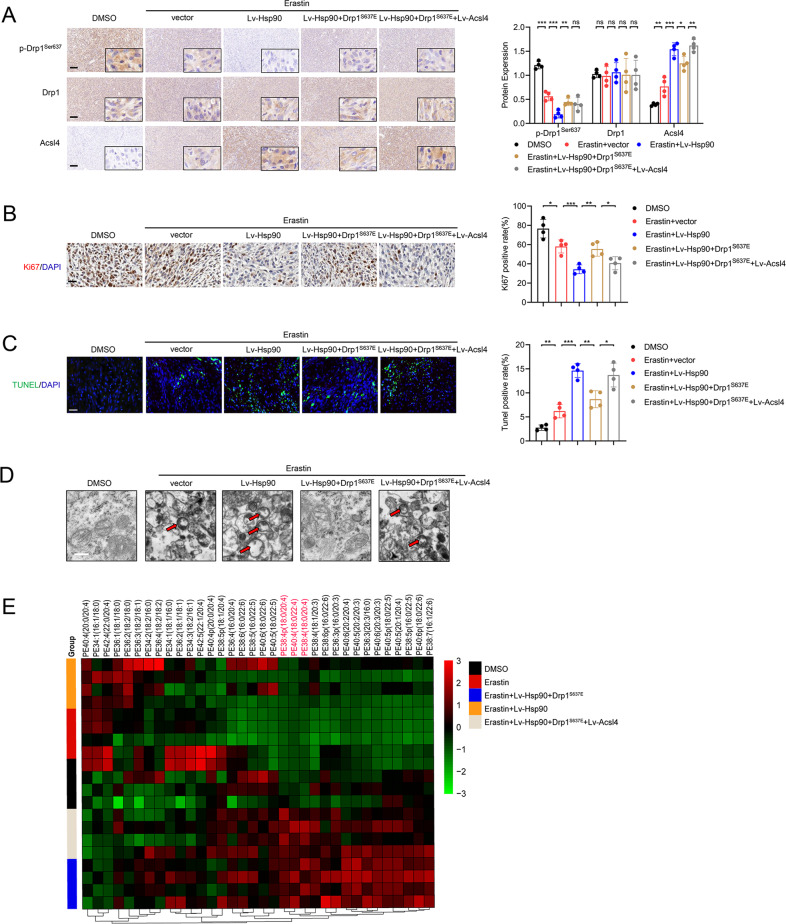
Ferroptosis is a newly identified form of regulated cell death (RCD) characterized by the iron-dependent lipid reactive oxygen species (ROS) accumulation, but its mechanism in gliomas remains elusive. Acyl-coenzyme A (CoA) synthetase long-chain family member 4 (Acsl4), a pivotal enzyme in the regulation of lipid biosynthesis, benefits the initiation of ferroptosis, but its role in gliomas needs further clarification. Erastin, a classic inducer of ferroptosis, has recently been found to regulate lipid peroxidation by regulating Acsl4 other than glutathione peroxidase 4 (GPX4) in ferroptosis. In this study, we demonstrated that heat shock protein 90 (Hsp90) and dynamin-related protein 1 (Drp1) actively regulated and stabilized Acsl4 expression in erastin-induced ferroptosis in gliomas. Hsp90 overexpression and calcineurin (CN)-mediated Drp1 dephosphorylation at serine 637 (Ser637) promoted ferroptosis by altering mitochondrial morphology and increasing Acsl4-mediated lipid peroxidation. Importantly, promotion of the Hsp90-Acsl4 pathway augmented anticancer activity of erastin in vitro and in vivo. Our discovery reveals a novel and efficient approach to ferroptosis-mediated glioma therapy.


Conflict of interest statement

The authors declare no competing interests.

Figures

Fig. 1
Fig. 1. Acsl4 contributs to lipidomic difference in gliomas.
A Heat map of all major PE species was classified into LGG and GBM clusters. B Quantitative analysis of PE (18:0/20:4) and PE (18:0/22:4) in LGG and GBM cells in the absence or presence of AA. The cells were supplemented with AA (3.5 μM, 16 h at 37 °C). Data indicated as mean ± S.D. (n = 4 experiments). C Quantitative analysis of hydroperoxy-PE (18:0/20:4) and hydroperoxy-PE (18:0/22:4) in LGG and GBM cells in the absence or presence of AA. The cells were supplemented with AA (3.5 μM, 16 h at 37 °C) and treated with erastin (5 μM, 6 h at 37 °C). D 12-HETE and 15-HETE levels were detected in LGG and GBM cells. Data indicated as mean ± S.D. (n = 4 experiments). E, F Acsl4 protein in human glioma (LGG, n = 4; GBM, n = 7) samples was evaluated by western blot and IHC. GAPDH was used as control in western blot assays. G Database analysis (TCGA, Rembrandt) of different grades of human primary gliomas. Expression of Acsl4 mRNA in LGG (WHO II) was compared to that of GBM (WHO IV). H Kaplan–Meier survival analysis (TCGA, Rembrandt) of high versus low Acsl4-expressing gliomas. Log-rank test. Scale bars: 100 μm. *p < 0.05, **p < 0.01, ***p < 0.001.
Fig. 2
Fig. 2. Acsl4 participates in mitochondrial-morphology regulation in ferroptosis.
A Representative images by immunofluorescence show mitochondrial morphology in PL1 and PG7 cells treated with erastin in a dose-dependent manner (6 h). Scale bar: 10 μm. B The mean length of mitochondria in PL1 and PG7 cells treated with erastin dose dependently (6 h). Data indicated as mean ± S.D. (n = 3 experiments). C Representative transmission electron microscopy images show morphology of mitochondria in PL1 and PG7 cells under erastin treatment (6 h). Mitochondria showed the increased membrane density and shrunken morphology (red arrows). Scale bar: 2 μm. D Acsl4 protein expression levels in Acsl4 shRNA-mediated knockdown PL1 cells and Acsl4-overexpression PG7 cells were determined by western blot. E Acsl4 mRNA expression levels in Acsl4 shRNA-mediated knockdown PL1 cells and Acsl4-overexpression PG7 cells were determined by qPCR. Data indicated as mean ± S.D. (n = 3 experiments). FK Intracellular ROS, MDA, 12-HETE, 15-HETE, GSH, and GPX activity in PL1 cells after 1 μM erastin treatment and in PG7 cells after 2 μM erastin treatment (6 h). Data indicated as mean ± S.D. (n = 3 experiments). L Confocal images showed colocalization of oxidized lipids (green) and mitochondria (red). PL1 and PG7 cells were treated as indicated before and then stained with BODIPY C11 and MitoTracker. Scale bar: 10 μm. *p < 0.05, **p < 0.01, ***p < 0.001.
Fig. 3
Fig. 3. Drp1 phosphorylation is essential for Acsl4-dependent ferroptosis.
A SDS-PAGE silver staining showed typical pull-down results of Acsl4 after incubation with PL1 cell lysate. Mass spectrometry identified the band framed in the oval as Drp1. B The interaction between Acsl4 and Drp1 was confirmed by co-immunoprecipitation in PL1 and PG7 cells. C Confocal images showed colocalization of Acsl4 (red) and Drp1 (green) in PL1 and PG7 cells. Nuclei were counterstained with Hoechst (blue). Scale bars: 10 μm. D, E Expression levels of p-Drp1Ser637, p-Drp1Ser616, and Drp1 were determined by western blot in PL1 and PG7 cells in the presence or absence of erastin (5 μM, 6 h). Drp1 was used as a loading control of two types p-Drp1. GAPDH was used as control. Data indicated as mean ± S.D. (n = 4 experiments). F Representative images of IHC staining of p-Drp1Ser637, p-Drp1Ser616, and Drp1 in two pairs LGG and GBM tissues. Scale bars: 100 μm. Data indicated as mean ± S.D. (n = 4 experiments). G Flow cytometric analysis of p-Drp1Ser637 and p-Drp1Ser616 levels in PL1 and PG7 cells. Isotype control was set in gray. The histogram shows mean fluorescence intensity (MFI) values for control and erastin-treated cells. Data indicated as mean ± S.D. (n = 4 experiments). H Confocal images showed colocalization of oxidized lipids (green) and mitochondria (red). PL1 cells of indicated groups were treated with erastin (1 μM, 6 h), and PG7 cells of the indicated groups were treated with erastin (2 μM, 6 h); then cells were stained with BODIPY C11 and MitoTracker. Scale bar: 10 μm. IJ Intracellular ROS and MDA level in PL1 and PG7 cells treated as indicated before. Data indicated as mean ± S.D. (n = 3 experiments). *p < 0.05, **p < 0.01, ***p < 0.001.
Fig. 4
Fig. 4. Hsp90 regulates Drp1 phosphorylation via calcineurin in gliomas.
A SDS-PAGE silver staining showed typical pull-down results of Acsl4 after incubation with PL1 cell lysate. Mass spectrometry identified the band framed in the oval as Hsp90. B The interaction between Acsl4, Drp1, and Hsp90 was confirmed by co-immunoprecipitation in PL1 and PG7 cells. C Confocal images showed colocalization of Acsl4 (red) and Hsp90 (green), Drp1 (red), and Hsp90 (green) in PL1 and PG7 cells. Nuclei were counterstained with Hoechst (blue). Scale bars: 10 μm. D Expression levels of proteins in Hsp90-Acsl4 pathway were determined by western blot in the indicated groups. Data indicated as mean ± S.D. (n = 5 experiments). E, F Thermal stabilization of Acsl4 in PL1 and PG7 cells of indicated groups was determined following standard cellular thermal shift protocol with heat treatment from 37 °C to 65 °C. (PL1 cells: erastin 1 μm, PG7 cells: erastin 2 μm). Data indicated as mean ± S.D. (n = 3 experiments). *p < 0.05, **p < 0.01, ***p < 0.001.
Fig. 5
Fig. 5. Promotion of the Hsp90-Acsl4 pathway enhances Acsl4-dependent ferroptosis.
A, B Expression levels of proteins in Hsp90-Acsl4 pathway were determined by western blot in the indicated groups. Data indicated as mean ± S.D. (n = 5 experiments). C Confocal images showed colocalization of oxidized lipids (green) and mitochondria (red). PL1 cells of indicated groups were treated with erastin (1 μM, 6 h), and PG7 cells of the indicated groups were treated with erastin (2 μM, 6 h); then the cells were stained with BODIPY C11 and MitoTracker. Scale bar: 10 μm. DI Intracellular ROS, MDA, 12-HETE,15-HETE levels, and GSH and GPX activity in PL1 and PG7 cells treated as indicated before. Data indicated as mean ± S.D. (n = 5 experiments). *p < 0.05, **p < 0.01, ***p < 0.001.
Fig. 6
Fig. 6. Promotion of the Hsp90-Acsl4 pathway enhances erastin sensitivity in vitro.
A Colony formation assays in the indicated groups in PL1 cells after 1 μM erastin treatment and in PG7 cells after 2 μM erastin treatment (6 h). Data indicated as mean ± S.D. (n = 5 experiments). B EdU assays. Scale bar: 50 μm. Data indicated as mean ± S.D. (n = 5 experiments). C TUNEL assays. Scale bar: 50 μm. Data indicated as mean ± S.D. (n = 5 experiments). *p < 0.05, **p < 0.01, ***p < 0.001.
Fig. 7
Fig. 7. Promotion of the Hsp90-Acsl4 pathway enhances erastin sensitivity in vivo.
A Mice were subcutaneously and intracranially xenografted with PG7 cells of different groups (5 × 106/5 × 105 cells) and treated intraperitoneally with erastin (10 mg kg−1 day−1 per mouse) or DMSO (0.3%) twice, every two days. B Diameter of subcutaneous tumors. Data indicated as mean ± S.D. (n = 6 mice per group). C Image of subcutaneous tumors. D Tumor weight of subcutaneous tumors. Data are indicated as mean ± S.D. (n = 6 mice per group). E Kaplan–Meier survival of mice. (n = 6 mice per group). F Weight of mice during the experiment. Data indicated as mean ± S.D. (n = 6 mice per group). G Bioluminescence imaging was performed on days 7, 14, 21, and 28 after implantation. *p < 0.05, **p < 0.01, ***p < 0.001.
Fig. 8
Fig. 8. Promotion of the Hsp90-Acsl4 pathway enhances erastin sensitivity in vivo.
A IHC assay for p-Drp1Ser637, Drp1, and Acsl4. Scale bar: 100 μm. Data indicated as mean ± S.D. (n = 4 mice per group). B IHC assay for Ki67. Scale bar: 50 μm. Data indicated as mean ± S.D. (n = 4 mice per group). C TUNEL assay. Scale bar: 50 μm. Data indicated as mean ± S.D. (n = 4 mice per group). *p < 0.05, **p < 0.01, ***p < 0.001. D Representative transmission electron microscopy images revealed mitochondrial morphology of different groups. Scale bar: 1 μm. E Heat map of all major PE species with hierarchical clustering of the groups DMSO, Erastin, Erastin+ Lv-Hsp90, Erastin + Lv-Hsp90 + Drp1S637E, Erastin+ Lv-Hsp90 + Drp1S637E + Lv-Acsl4.

References

    1. Tan AC, Ashley DM, Lopez GY, Malinzak M, Friedman HS, Khasraw M. Management of glioblastoma: state of the art and future directions. CA Cancer J Clin. 2020;70:299–312. doi: 10.3322/caac.21613. - DOI - PubMed
    1. Mariappan A, Goranci-Buzhala G, Ricci-Vitiani L, Pallini R, Gopalakrishnan J. Trends and challenges in modeling glioma using 3D human brain organoids. Cell Death Differ. 2021;28:15–23. doi: 10.1038/s41418-020-00679-7. - DOI - PMC - PubMed
    1. Dixon SJ, Lemberg KM, Lamprecht MR, Skouta R, Zaitsev EM, Gleason CE, et al. Ferroptosis: an iron-dependent form of nonapoptotic cell death. Cell. 2012;149:1060–72. doi: 10.1016/j.cell.2012.03.042. - DOI - PMC - PubMed
    1. Xie Y, Hou W, Song X, Yu Y, Huang J, Sun X, et al. Ferroptosis: process and function. Cell Death Differ. 2016;23:369–79. doi: 10.1038/cdd.2015.158. - DOI - PMC - PubMed
    1. Neitemeier S, Jelinek A, Laino V, Hoffmann L, Eisenbach I, Eying R, et al. BID links ferroptosis to mitochondrial cell death pathways. Redox Biol. 2017;12:558–70. doi: 10.1016/j.redox.2017.03.007. - DOI - PMC - PubMed

Publication types