. 2022 Jun 13;13(1):3380.
doi: 10.1038/s41467-022-31098-6.

NUP62 localizes to ALS/FTLD pathological assemblies and contributes to TDP-43 insolubility

Affiliations

NUP62 localizes to ALS/FTLD pathological assemblies and contributes to TDP-43 insolubility

Amanda M Gleixner et al. Nat Commun. .

Abstract

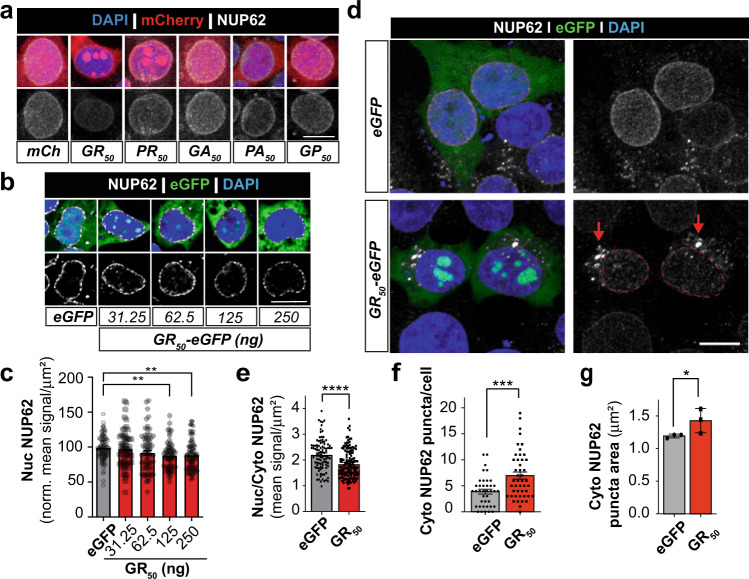
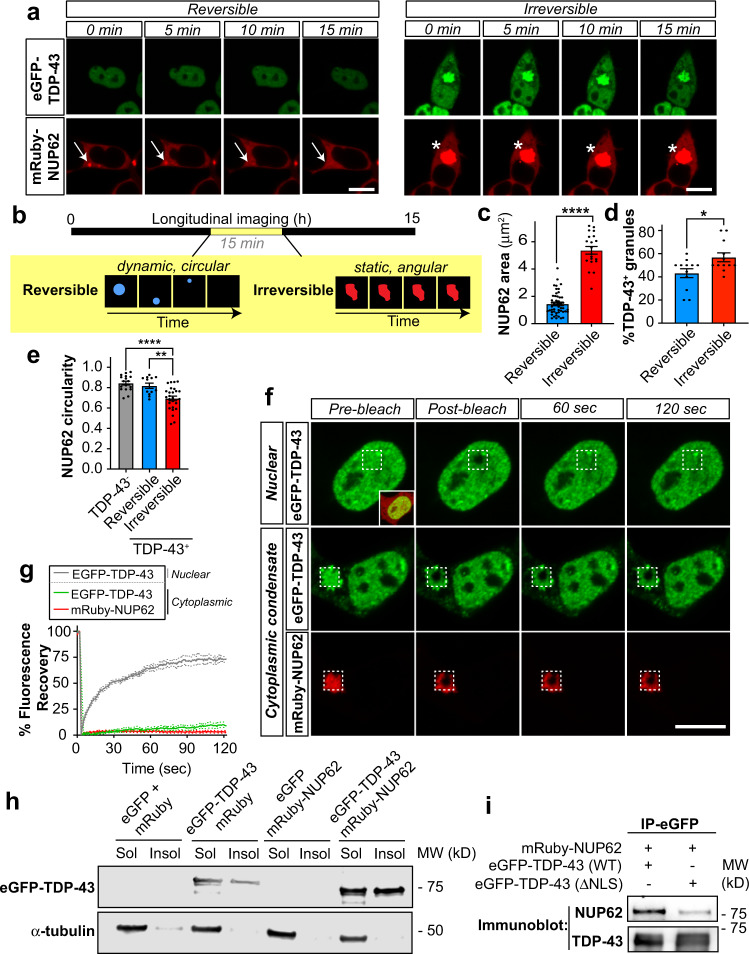
A G4C2 hexanucleotide repeat expansion in the C9orf72 gene is the most common genetic cause of ALS and FTLD (C9-ALS/FTLD) with cytoplasmic TDP-43 inclusions observed in regions of neurodegeneration. The accumulation of repetitive RNAs and dipeptide repeat protein (DPR) are two proposed mechanisms of toxicity in C9-ALS/FTLD and linked to impaired nucleocytoplasmic transport. Nucleocytoplasmic transport is regulated by the phenylalanine-glycine nucleoporins (FG nups) that comprise the nuclear pore complex (NPC) permeability barrier. However, the relationship between FG nups and TDP-43 pathology remains elusive. Our studies show that nuclear depletion and cytoplasmic mislocalization of one FG nup, NUP62, is linked to TDP-43 mislocalization in C9-ALS/FTLD iPSC neurons. Poly-glycine arginine (GR) DPR accumulation initiates the formation of cytoplasmic RNA granules that recruit NUP62 and TDP-43. Cytoplasmic NUP62 and TDP-43 interactions promotes their insolubility and NUP62:TDP-43 inclusions are frequently found in C9orf72 ALS/FTLD as well as sporadic ALS/FTLD postmortem CNS tissue. Our findings indicate NUP62 cytoplasmic mislocalization contributes to TDP-43 proteinopathy in ALS/FTLD.


Conflict of interest statement

CJD is a scientific founder of Confluence Therapeutics. All other authors declare no competing interests.

Figures

Fig. 1
Fig. 1. Cytoplasmic NUP62 is associated with TDP-43 mislocalization.
a, b NUP62 (green) and phosphoTDP-43 (pTDP-43, red) immunoreactivity in postmortem tissue from C9-ALS/FTD clinical diagnoses. Cytoplasmic NUP62 is colocalized with (arrows) and without (asterisks) phosphoTDP-43. Colocalization of NUP62 and phosphoTDP-43 accumulations were observed in the spinal cord (a) and hippocampus (b). Patient diagnostic classifications are described in Supplemental Table 1. Scale bar: 10 µm (c) NUP62 and TDP-43 immunostaining in isogenic control (top row) and C9-ALS (bottom row) iPSC neurons (Supplemental Table 2) presented in spectral colors. Warmer colors represent higher NUP62 or TDP-43 levels while cooler colors show lower levels. Cytoplasmic NUP62 is linked with higher TDP-43 mislocalization in neurons. Scale bar: 12.5 µm. d Nuclear-cytoplasmic (Nuc/Cyto) distribution of NUP62 and TDP-43 were determined for isogenic control and C9-ALS iPSC neurons from maximum intensity projection confocal images. Values were then plotted for each individual neuron and simple linear regression was calculated to determine best fit-line as shown. Pearson’s Correlation Analysis was conducted. There was a positive correlation between Nuc/Cyto NUP62 and TDP-43 in isogenic control [r(101) = .71, p = 3.21e-017] and C9-ALS [r(100) = 0.57, p = 2.54e-010] neurons. e NUP62 immunostaining (red) is shown in the representative confocal maximum intensity projection images of healthy control and C9-ALS MAP2+ iPSC neurons that had been differentiated and matured for 89 days. DAPI+ nuclear compartment is highlighted with dashed white line and cytoplasmic NUP62 puncta are indicated by white arrows. Scale bar: 10 µm. f Quantification of nuclear NUP62 intensity shows lower levels in C9-ALS iPSC neurons. Average signal is shown by graph bars while dots and squares represent the signal in individual neurons. The control group (n = 59 neurons) consists of two separate iPSC lines and C9ORF72 (n = 58 neurons) is the combination of three C9-ALS iPSC lines. Data are shown as mean + /- SEM. g The number of NUP62 puncta in MAP2+ iPSC neurons is quantified from confocal images represented in Fig. 1e. Data analysis reveals an increase in cytoplasmic NUP62 puncta quantity in C9-ALS iPSC neurons. Average cytoplasmic NUP62 puncta per cell are show by the graph bars while individual cell data are shown by the dots and squares (n = 70 (control) or 42 (C9ORF72) neurons). Data are shown as mean + /- SEM. Statistical significance was determined by unpaired, two-tailed student’s t-test. **** p ≤ 0.0001 vs control in f & g.
Fig. 2
Fig. 2. Poly-GR induces RNA granules that recruit TDP-43 and NUP62.
HEK293 cells were transfected with GR50-eGFP plasmid DNA and immunostained prior to imaging by confocal microscopy. Images reveal the accumulation of cytoplasmic GR50-eGFP condensates that we went on to characterize. a Maximum intensity projection image reveals endogenous TDP-43 and GR50-eGFP localize together in cytoplasmic condensates. Scale bar: 10 μm. Inset image highlights a single condensate containing GR50-eGFP and endogenous TDP-43. Scale bar: 5 μm. b Orthogonal view of cytoplasmic GR50-eGFP condensates in HEK293 cells reveals endogenous TDP-43 and SG marker G3BP1 exist within same three-dimensional space. Top left panel is a merged image and others are of individual channels. Scale bar: 10 μm. c The presence of RNA in GR50-mCh condensates was determined with SYTO RNASelect green-fluorescent stain. Areas of intense fluorescent staining coincided with GR50-mCh+ and G3BP1+ structures. Thus, indicating the presence of RNA in GR50 condensates. White box highlights condensates. Scale bar: 10 μm. d Cropped image of cytoplasmic GR50-eGFP accumulations (from subpanel B) that we observe in cells. Immunocytochemistry for endogenous TDP-43 and G3BP1 reveal these proteins are detectable in the GR50-eGFP condensates. e G3BP1 (n = 27) and TDP-43 (n = 20) surface area was measured in GR50-eGFP+ condensates. We observe that TDP-43 is significantly smaller than G3BP1 in these GR50-eGFP structures. Data are shown as mean + /- SEM. Statistical significance was determined by unpaired two-tailed student’s t-test. * p ≤ 0.05 G3BP1 vs TDP-43. f Intensity profile plots for condensates containing GR50-eGFP, TDP-43, and G3BP1. An intensity profile plot line was drawn through the condensate and signal intensity is plotted across the length of line. This data further supports the hypothesis that these proteins exist within the same space. g Orthogonal view of cytoplasmic GR50-eGFP condensates in HEK293 cells reveals endogenous TDP-43 and NUP62 exist within same three-dimensional space. Left panel is a merged image of all signals together and the other panels are of individual channels. Scale bar: 5 µm. h Intensity profile plots for condensate containing GR50-eGFP, TDP-43 and NUP62. An intensity profile plot line was drawn through the condensate and signal intensity is plotted across the length of line. This data further supports the hypothesis that these proteins exist within the same space. Scale bar: 5 µm.
Fig. 3
Fig. 3. Poly-GR alters NUP62 localization in vitro.
a Nuclear NUP62 (white) levels were assessed in HEK293 cells expressing mCherry-tagged poly-DPR constructs (red) by immunofluorescent staining and confocal microscopy. Representative maximum intensity projection images are shown. Nuclear NUP62 quantification is shown in Supplemental Fig. 4a. Scale bar: 10 µm. b HEK293 cells were transfected with increasing amounts of GR50-eGFP plasmid DNA and immunostained for NUP62. Image were processed by automatic deconvolution in Nikon Elements. Single slice images (0.2 µm) of NUP62 (white) show dose-dependent reduction in nuclear NUP62 with increasing GR50-eGFP plasmid DNA. Scale bar: 10 µm c Nuclear NUP62 signal was quantified in maximum intensity projection confocal images following immunofluorescent staining (n = 104 (eGFP), 62 (31.25 ng), 71 (62.5 ng), 64 (125 ng), 120 (250 ng) cells per group). Data corresponds to images presented in Fig. 3b. Statistical significance was determined by one-way ANOVA with Dunnett’s multiple comparisons test. Data are shown as mean + /- SEM. d To assess whether GR50-eGFP alters NUP62 localization, HEK293 cells were transfected with eGFP or GR50-eGFP (green) and immunostained for NUP62 (white). Representative confocal images show nuclear NUP62 depletion that coincides with cytoplasmic NUP62 puncta accumulation. Nuclear compartment is highlighted by dashed red line and cytoplasmic NUP62 accumulations are indicated by red arrow. Scale bar: 10 µm. e Quantification of nuclear/cytoplasmic (Nuc/Cyto) distribution of NUP62 signal corresponding to Fig. 3d representative images. Regions of interest (ROIs) were drawn around DAPI or cytoplasm signals to determine NUP62 in the respective regions. The distribution for each cell was determined and then averaged for n = 96 (eGFP) -138 (GR50) cells across four independent experiments. Statistical significance was determined by unpaired two-tailed t-test. Data are shown as mean + /- SEM. f We identified cytoplasmic NUP62 puncta by spot detection (diameter 1 µm or larger) methods and counted the frequency of these structures in each HEK293 cell (n = 39 (eGFP) - 47 (GR50) cells). Quantification reveals an increased cytoplasmic NUP62 prevalence due to GR50 expression. Statistical significance was determined by unpaired two-tailed t-test. Data are shown as mean + /- SEM. g Cytoplasmic NUP62 puncta were detected by ROI automatic detection and quantification reveals GR50-eGFP causes a significant increase in their size relative to eGFP control (n = 88 (eGFP) -117 (GR50) puncta that were evaluated over three biologically independent experiments). Statistical significance was determined by one-tailed, unpaired t-test. Data are shown as mean + /- SD. *p ≤ 0.05; **p ≤ 0.01; ***p ≤ 0.001; ****p ≤ 0.0001 vs eGFP control.
Fig. 4
Fig. 4. Poly-GR expression coincides with loss of perinuclear and increased cytosolic NUP62 in vivo.
a Top: Schematic of Flexible Accelerated Stop Tetracycline Operator (F.A.S.T.) Cassette driven by the ROSA26 promoter at the ROSA26 locus used to express ATG-driven FLAG-GR50-GFP (GR50) in C57BL/6 mice. GR50 expression occurs upon crossing with a CAG-Cre mouse to excise the floxed STOP codon upstream of GR50. Bottom: The same cassette lacking the randomized GR50 sequence but still expressing eGFP is used as a control. b Representative images of GR50 (green) expression in the lumbar spinal cord of a GR50 mouse. GFAP (red) and SMI32 (magenta) denote astrocytes from neurons, respectively. Similar observations were made in a minimum of three biologically independent samples. Scale bar = 200 µm c Representative images of NUP62 (magenta) in GR50 (green) positive vs control in a 12-month-old mouse. Scale bar = 10 µm. d Quantification of NUP62 cytosolic puncta within NeuN-positive neurons of the lumbar spinal cord in 12-month-old mice. Value shown as percent of NUP62 fluorescence overlap within the whole cell ROI denoted by NeuN fluorescence. NeuN-positive cells (m) from n = 3 mice. Mean ± s.e.m. Unpaired t-test. **p = 0.0055. m = 90 control; 124 GR50. e Same as in (C) but for NUP98. f Same as in (D) but for NUP98. NeuN-positive cells (m) from n = 3 mice. Mean ± s.e.m. Unpaired t-test. **p = 0.0074. m = 276 control; 448 GR50.
Fig. 5
Fig. 5. Cytoplasmic NUP62 and TDP-43 colocalization promotes insolubility.
a HEK293 cells were co-transfected with mRuby-NUP62 and eGFP-TDP-43 (wild type). The cells were observed through live-scan confocal microscopy starting 3 h after transfection and images were obtained every 5 min over the course of 15 h. Two populations of cytoplasmic mRuby-NUP62 condensates were observed: reversible or irreversible. Reversible structures exhibit more dynamic activity and appear circular (see arrow). Irreversible structures appear less mobile or more static and have an angular structure (see asterisks). b Schematic depicting characteristics of cytoplasmic mRuby-NUP62 structures is shown at bottom. Representative still images were obtained from the 6–10 h time points of the imaging session. c Quantification of NUP62 area in confocal microscopy images obtained during live imaging (5–15 h timepoints) described in Fig. 5A, B. Irreversible condensates were significantly larger than reversible structures. The size of reversible granules was determined at times point immediately prior to dissipation. Irreversible granule area was calculated at final time point collected during live imaging session. n = 50 (reversible), 20 (irreversible) NUP62+ granules. Statistical significance was determined by two-tailed, unpaired student’s t-test. Data are shown as mean + /- SEM. d The percentage of reversible and irreversible mRuby-NUP62 granules containing eGFP-TDP-43 were calculated for each frame taken throughout the duration of living imaging session (5–15 h timepoints) described in Fig. 5a, b. A greater percentage of irreversible mRuby-NUP62 condensates contained eGFP-TDP43. n = 12 frames per group. Statistical significance was determined by two-tailed, unpaired student’s t-test. Data are shown as mean + /- SEM. e mRuby-NUP62 condensates were characterized for circularity score at the final time point of live image session (5–15 h timepoints) described in Fig. 5a, b. Irreversible mRuby-NUP62 + eGFP-TDP-43+ condensates (n = 26 condensates) had a significantly reduced circularity score relative to eGFP-TDP-43- (n = 17 condensates) and reversible mRuby-NUP62 + eGFP-TDP-43+ condensates (n = 12 condensates). Statistically differences were calculated by one-way ANOVA with Tukey post hoc analysis. Data are shown as mean + /- SEM. f Representative FRAP analysis images of nuclear eGFP-TDP-43 (reference solubility control) and cytoplasmic eGFP-TDP-43 and mRuby-NUP62 condensates. g Quantification of FRAP analysis shows reduced fluorescence signal recovery in cytoplasmic eGFP-TDP-43 and mRuby-NUP62 condensates relative to nuclear eGFP-TDP-43 control. Data are shown as mean + /- SD. h HEK293 cells were transfected with indicated plasmids for 24 h. Soluble and insoluble biochemical fractionation was then conducted, and Western blot analysis was performed to evaluate TDP-43 and GAPDH (protein loading control). mRuby-NUP62 promotes the formation of increased insoluble TDP-43. Representative western blot image is shown. i HEK293 cells were transfected with mRuby-NUP62 and eGFP-TDP-43 (WT or ΔNLS) for 24 h. Samples were then immunoprecipitated by ChromoTek GFP-Trap Magnetic Agarose affinity beads. Samples were then immunoblotted for NUP62 and TDP-43. *p ≤ 0.05; **p ≤ 0.01; ****p ≤ 0.0001 vs control. Scale bar: 10 µm.
Fig. 6
Fig. 6. Nup62 is a genetic modifier of C9-ALS/FTD Drosophila models.
a Representative images of fly eyes from GMR-GAL4 wild-type (top row) or (G4C2)30 repeat expansion (bottom row) flies combined with control (eGFP) or UAS-Nup62 RNAi flies. b Quantification of scored fly eye degeneration. Nup62 RNAi significantly enhances retinal degeneration of (G4C2)30 repeat expansion. Symbols are indicative of eye degeneration score for individual flies evaluated. n = 9 (control) or 10 (Nup62 RNAi) flies. Statistically significant differences were calculated by unpaired, two-tailed t-test: **** p ≤ 0.0001. Data are shown as mean + /- SEM. c Combination GMR-GAL4; (G4C2)36 repeat expansion were crossed with a UAS-Nup62 RNAi or UAS-eGFP fly. Shown are representative images of these flies 0–1 day post eclosion. d Bar graph shows the normalized quantification for (G4C2)36 repeat expansion fly eclosion in the presence and absence of Nup62 RNAi. The bars show average eclosion per day over the course of 8 days while individual dots are representative of fly counts for one 24 h eclosion period. (G4C2)36;GMR-GAL4 line crossed with UAS-eGFP fly line was used as the control group. Samples sizes n = 8 flies per group. Statistically significant differences in eclosion frequency were determined by one-way ANOVA with Tukey’s multiple comparison’s test: * p ≤ 0.05, **** p ≤ 0.0001. Data are shown as mean + /- SEM. e Combination GMR-GAL4/TM3; Nup62 OE/Sb were crossed with UAS-(G4C2)36 flies. Representative images are of flies carrying Nup62 overexpression or internal controls from the same cross carrying the Sb phenotype instead of Nup62 overexpression. Resulting progeny were evaluated within 24 h of eclosion. W1118 phenotype Drosophila were used as control. f Degeneration of fly eye was scored according to previously described methods. We find Nup62 overexpression abolishes the (G4C2)36 repeat expansion fly eye degeneration (n = 4 flies per group). Statistically significant differences were calculated by unpaired, two-tailed t-test: **** p ≤ 0.0001. Data are shown as mean + /- SEM. g Representative images of retinal degeneration in the presence and absence of Nup62 knockdown with GR36 Drosophila. h Retinal degeneration was measured in GR36 Drosophila with and without Nup62 RNAi. Individual symbols are indicative of individual flies and the average degeneration score is presented by the bars. Sample size: n = 10 flies per group. Statistically significant differences were calculated by unpaired, two-tailed t-test. **** p ≤ 0.0001. Data are shown as mean + /- SEM.
Fig. 7
Fig. 7. FG NUPs colocalize with TDP-43 proteinopathy in ALS/FTLD.
NUP98, NUP54 or NUP62 (green) and total TDP-43, p62 or phosphoTDP-43 (pTDP-43, red) immunohistochemistry in postmortem tissue from various clinical diagnoses. a Cytoplasmic NUP98 is present in cells with cytoplasmic total TDP-43 (arrow) of C9-ALS/FTD postmortem hippocampal tissue. b Cytoplasmic NUP98 exhibits occasional colocalization (arrow) with p62+ inclusions in C9-ALS/FTD postmortem hippocampal tissue. However, cytoplasmic NUP98 was also found absent from p62+ inclusions (asterisks) in C9-ALS/FTD hippocampal tissue. c Phosphorylated TDP-43 was absent of cytoplasmic NUP54 in C9-ALS/FTD postmortem hippocampal tissue. d Postmortem sALS patient spinal cord tissue shows pTDP-43 inclusions that are both positive (arrow) and negative (asterisks) for NUP54. e, f Intact nuclear NUP62 signal surrounds DAPI+ nuclei (asterisks) but becomes more diffuse in cells exhibiting cytoplasmic pTDP-43 (arrow). Colocalization of NUP62 and pTDP-43 accumulations were observed in the spinal cord (E) and mesial temporal cortex (F) of sporadic ALS patient tissue. g Cytoplasmic FUS accumulations (red, asterisks) in the hippocampus from two FTLD patients do not show NUP62 localization. Scale bar: 10 µm.

References

    1. Ling S-C, Polymenidou M, Cleveland DW. Converging mechanisms in ALS and FTD: disrupted RNA and protein homeostasis. Neuron. 2013;79:416–438. doi: 10.1016/j.neuron.2013.07.033. - DOI - PMC - PubMed
    1. Lattante S, Ciura S, Rouleau GA, Kabashi E. Defining the genetic connection linking amyotrophic lateral sclerosis (ALS) with frontotemporal dementia (FTD) Trends Genet. 2015;31:263–273. doi: 10.1016/j.tig.2015.03.005. - DOI - PubMed
    1. Dormann D, Haass C. TDP-43 and FUS: a nuclear affair. Trends Neurosci. 2011;34:339–348. doi: 10.1016/j.tins.2011.05.002. - DOI - PubMed
    1. Neumann M, et al. Ubiquitinated TDP-43 in frontotemporal lobar degeneration and amyotrophic lateral sclerosis. Science. 2006;314:130–133. doi: 10.1126/science.1134108. - DOI - PubMed
    1. Neumann M, et al. A new subtype of frontotemporal lobar degeneration with FUS pathology. Brain. 2009;132:2922–2931. doi: 10.1093/brain/awp214. - DOI - PMC - PubMed

Publication types

MeSH terms