. 2022 Jun 13;13(1):3399.
doi: 10.1038/s41467-022-30573-4.

Gene expression signatures of individual ductal carcinoma in situ lesions identify processes and biomarkers associated with progression towards invasive ductal carcinoma

Affiliations

Gene expression signatures of individual ductal carcinoma in situ lesions identify processes and biomarkers associated with progression towards invasive ductal carcinoma

Clare A Rebbeck et al. Nat Commun. .

Abstract

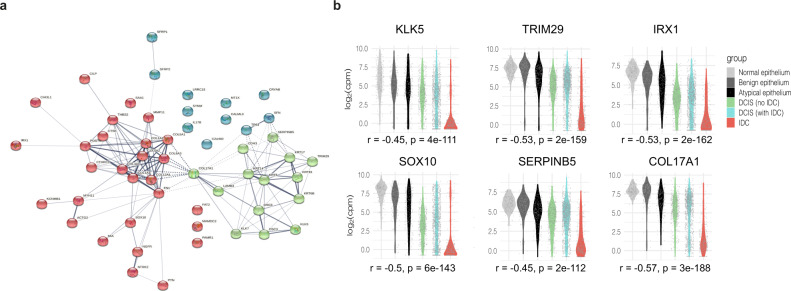
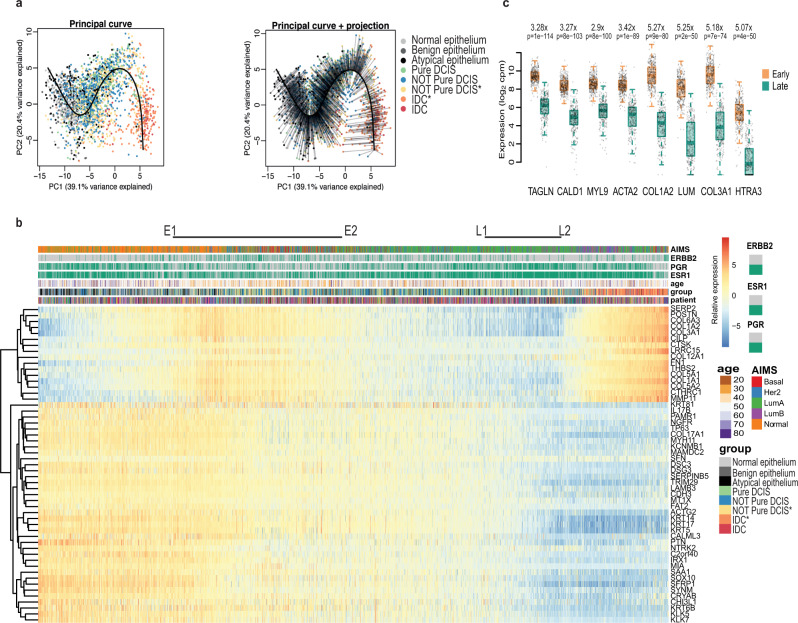
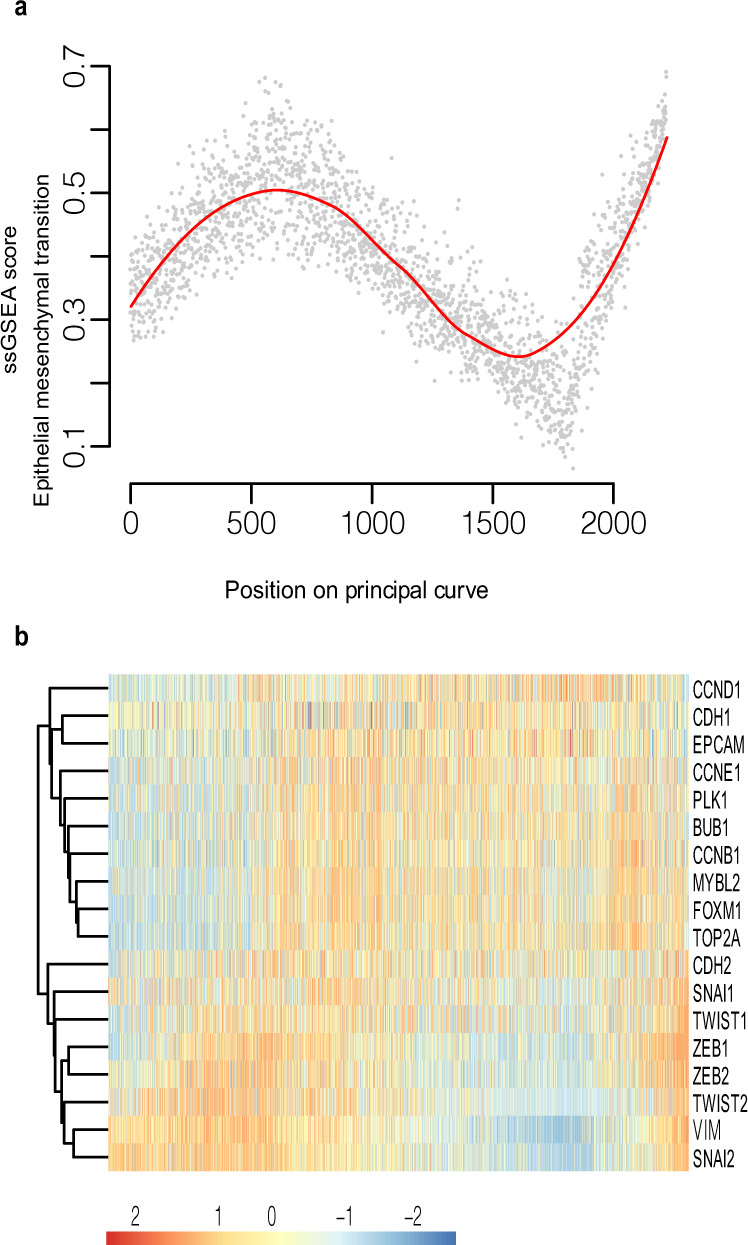
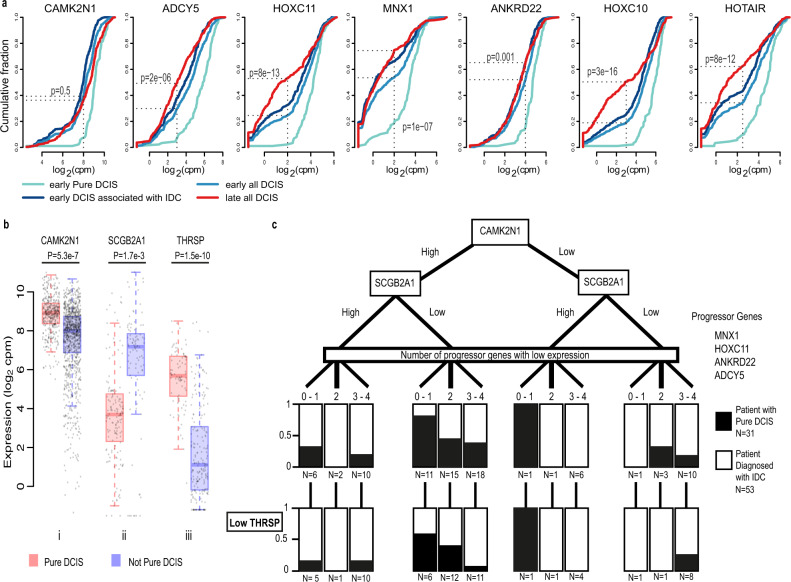
Ductal carcinoma in situ (DCIS) is considered a non-invasive precursor to breast cancer, and although associated with an increased risk of developing invasive disease, many women with DCIS will never progress beyond their in situ diagnosis. The path from normal duct to invasive ductal carcinoma (IDC) is not well understood, and efforts to do so are hampered by the substantial heterogeneity that exists between patients, and even within patients. Here we show gene expression analysis from > 2,000 individually micro-dissected ductal lesions representing 145 patients. Combining all samples into one continuous trajectory we show there is a progressive loss in basal layer integrity heading towards IDC, coupled with two epithelial to mesenchymal transitions, one early and a second coinciding with the convergence of DCIS and IDC expression profiles. We identify early processes and potential biomarkers, including CAMK2N1, MNX1, ADCY5, HOXC11 and ANKRD22, whose reduced expression is associated with the progression of DCIS to invasive breast cancer.


Conflict of interest statement

The University of Cambridge has filed a patent concerning markers identified in this study. Patent title: Biomarkers, GB priority patent application no: 2118312.4. Authors currently linked to the Patent application are C.R., G.H., J.X. and S.B. The remaining authors declare no other competing interests are present.

Figures

Fig. 1
Fig. 1. Triple negative DCIS has a transcriptome distinct from other DCIS subtypes.
Uniform Manifold Approximation and Projection (UMAP) plots illustrating expression patterns in log2 counts per million (CPM), for 1414 DCIS samples by a AIMS (Absolute Intrinsic Molecular Subtyping), b ESR1/PGR/ERBB2 gene expression, and c expression of genes that correlate with triple-negative status in DCIS.
Fig. 2
Fig. 2. Differentially expressed genes between DCIS and co-occurring IDC.
a String connectivity with k-means clustering [3 clusters identified by red, green and blue] of the top 53 significant genes. b Expression distribution, in log2 counts per million (CPM), for example genes that showed a progressive shift among different tissue groups. The Spearman rank correlation (between expression and ordered tissue groups) is given as r = rho. Two-sided p-values without correction for multiple testing are indicated.
Fig. 3
Fig. 3. Generating a pseudo-time for DCIS.
a Principal component analysis (PCA) plot based on the most significant (p < 0.00001) differentially expressed genes between DCIS and co-occurring IDC. All samples plotted according to principal components 1 and 2 (PC1 and PC2 respectively) with their fitted principal curve (left), and with their projection onto the curve (right). b Heatmap showing expression of each of the 53 genes with samples ordered by their projection to the principal curve. Top bars indicate AIMS subtype classification, ERBB2, PGR, and ESR1 status, age of patient at the time of consent, tissue classification group for each sample, and patient distribution. Relative expression is provided as log2 counts per million (CPM) minus the mean log2 CPM for each gene. E1 – E2 indicate the Early stage and L1 – L2 indicates the Late stage. The ‘*’ assigned for ‘Yellow Not Pure DCIS’ and ‘Orange IDC’ indicates samples used in the analysis comparing gene expression of DCIS vs IDC for co-occurring patients. ‘Blue Not Pure DCIS’ and ‘Red IDC’ are from tissue biopsies that did not have co-occurring DCIS and IDC in the same sections and were therefore not used for this expression analysis. (c) Boxplots illustrating per sample expression data for highly differential genes found when comparing samples in the Early group (E1-E2) with those in the Late group (L1–L2). Differential expression analysis was done using limma-voom and two-sided p-values were adjusted for multiple testing using Benjamini-Hochberg correction. Centre line represents the median, box limits represent upper and lower quartiles, whiskers represent minimum and maximum values and at most 1.5x the interquartile range. Each point represents a sample, n = 339 early and n = 287 late samples from 106 patients).
Fig. 4
Fig. 4. Imaging Mass cytometry of ductal regions from patient sample CBZ (LumA subtype).
The single slide was analysed in one continuous scan and magnified regions retained the same intensity threshold. a shows H&E stained section, this same section was destained and used for IMC. Boxed areas indicate the corresponding magnified regions shown in ai, ii and iii. b shows E-Cadherin and SMA, with corresponding boxed areas for i, ii and iii. c Shows CK14 and nuclear stain DNA-191, with corresponding boxed areas for i, ii and iii. d shows Caldesmon and Lumican and e shows SMA and Caldesmon, with corresponding boxed areas for i, ii and iii. Numbers on the H&E images indicate regions with expression data from adjacent sections. f shows the relative gene expression of Cald1 and Lum (as in Fig. 3b) with all samples ordered along the PCP continuum. Numbers above and below pair up with numbers in (a) and mark the position on the PCP continuum for the two (adjacent) data points corresponding to each region.
Fig. 5
Fig. 5. Predominant Hallmark signatures that vary along the PCP continuum.
a Single-sample Gene Set Enrichment Analysis (ssGSEA) score for the Epithelial to Mesenchymal transition Hallmark signature. Samples are ordered according to the principal curve projection. b Heatmap showing expression of key proliferation genes (CCND1 – Top2A) and key EMT (CDH2-SNAI2) genes. Samples were ordered according to the principal curve projection. Relative expression is provided as log2 counts per million (CPM) minus the mean log2 CPM for each gene.
Fig. 6
Fig. 6. Genes displaying potential as indicators of progression from DCIS to IDC.
a Cumulative frequency plots for differential genes between early positioned Pure DCIS and early positioned Not Pure DCIS. X axis shows the gene expression in log2 counts per million (CPM), Y axis shows the cumulative fraction of samples with the corresponding expression value or lower. Significance values reflect the two-sided Fisher’s exact test for a difference between cumulative fraction of all early DCIS compared to all late DCIS. b Expression in log2 counts per million (CPM), of i CAMK2N1 for all DCIS samples (n = 385 Pure DCIS samples and n = 1014 Not Pure DCIS samples), ii of SCGB2A1 for all samples belonging to patients in the Low Hazard group – 1 progressor gene down regulated and CAMK2N1 high (n = 148 Pure DCIS samples and n = 97 Not Pure DCIS samples), and iii THRSP for all samples belonging to patients with 3–4 progressor genes down regulated, CAMK2N1 high and SCGB2A1 low (n = 84 Pure DCIS samples and n = 199 Not Pure DCIS samples). Centre line represents the median, box limits represent upper and lower quartiles, whiskers represent minimum and maximum values and at most 1.5x the interquartile range. Each point represents a sample. Differential expression analysis was done using limma-voom and two-sided p-values were adjusted for multiple testing using Benjamini–Hochberg correction. c Separation of patients with no IDC identified in our tissue biopsy. In all, 31 patients were never diagnosed with IDC after 10+ years of care, 53 patients were diagnosed with IDC in a secondary biopsy or at a later timepoint. Black/white regions reflect the proportion of patients with each diagnosis (Pure DCIS vs with IDC) within each node. Boxes in the low THRSP layer reflect the number of THRSP low patients from the node above.

References

    1. Mannu GS, et al. Invasive breast cancer and breast cancer mortality after ductal carcinoma in situ in women attending for breast screening in England, 1988–2014: population based observational cohort study. BMJ. 2020;369:m1570. doi: 10.1136/bmj.m1570. - DOI - PMC - PubMed
    1. Collins LC, et al. Outcome of patients with ductal carcinoma in situ untreated after diagnostic biopsy: results from the Nurses’ Health Study. Cancer. 2005;103:1778–1784. doi: 10.1002/cncr.20979. - DOI - PubMed
    1. Welch HG, Black WC. Using autopsy series to estimate the disease “reservoir” for ductal carcinoma in situ of the breast: how much more breast cancer can we find? Ann. Intern. Med. 1997;127:1023–1028. doi: 10.7326/0003-4819-127-11-199712010-00014. - DOI - PubMed
    1. Boecker W, et al. Ductal epithelial proliferations of the breast: a biological continuum? Comparative genomic hybridization and high-molecular-weight cytokeratin expression patterns. J. Pathol. 2001;195:415–421. doi: 10.1002/path.982. - DOI - PubMed
    1. Doebar SC, et al. Gene expression differences between ductal carcinoma in situ with and without progression to invasive breast cancer. Am. J. Pathol. 2017;187:1648–1655. doi: 10.1016/j.ajpath.2017.03.012. - DOI - PubMed

Publication types

MeSH terms