

Interannual fluctuations in connectivity among crab populations (Liocarcinus depurator) along the Atlantic-Mediterranean transition
- PMID: 35697727
- PMCID: PMC9192654
- DOI: 10.1038/s41598-022-13941-4
Interannual fluctuations in connectivity among crab populations (Liocarcinus depurator) along the Atlantic-Mediterranean transition
Abstract
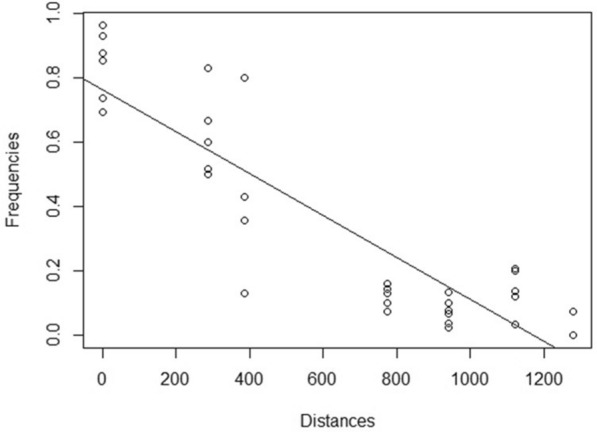
An interesting evolutionary question that still remains open is the connectivity between marine populations. Marine currents can favour the dispersal of larvae or adults, but they can also produce eddies and gyres generating oceanographic fronts, thus limiting gene flow. To address this subject, we selected the Atlantic-Mediterranean transition, where several fronts are located: Gibraltar Strait (GS), Almeria-Oran Front (AOF) and Ibiza Channel (IC). Seven populations of the marine crab Liocarcinus depurator (Cadiz, West and East Alboran, Alacant, Valencia, Ebro Delta and North Catalonia) located along this transition were analysed in six consecutive years (2014-2019) using a fragment of the COI (Cytochrome Oxidase subunit I) gene. All sequences (966) belonged to two well defined haplogroups: ATL (most abundant in Atlantic waters) and MED (predominant in Mediterranean waters). Following a geographic variation, the frequency of ATL decreased significantly from Cadiz to North Catalonia. However, this variation presented steps due to the effect of oceanographic restrictions/fronts. Significant effects were recorded for GS (2015, 2017, 2018 and 2019), AOF (all years except 2018) and IC (2016). The intensity and precise location of these fronts changed over time. Multivariate analyses distinguished three main population groups: Cadiz, Alboran Sea and the remaining Mediterranean populations. These findings could be relevant to properly define Marine Protected Areas and for conservation and fisheries policies.
© 2022. The Author(s).
Conflict of interest statement
The authors declare no competing interests.
Figures


Similar articles
-
Temporal and spatial genetic differentiation in the crab Liocarcinus depurator across the Atlantic-Mediterranean transition.Sci Rep. 2016 Jul 19;6:29892. doi: 10.1038/srep29892. Sci Rep. 2016. PMID: 27431989 Free PMC article.
-
Hydroids (Cnidaria, Hydrozoa) from Mauritanian Coral Mounds.Zootaxa. 2020 Nov 16;4878(3):zootaxa.4878.3.2. doi: 10.11646/zootaxa.4878.3.2. Zootaxa. 2020. PMID: 33311142
-
Phylogeographic patterns of decapod crustaceans at the Atlantic-Mediterranean transition.Mol Phylogenet Evol. 2012 Feb;62(2):664-72. doi: 10.1016/j.ympev.2011.11.009. Epub 2011 Nov 26. Mol Phylogenet Evol. 2012. PMID: 22138160
-
Pillars of Hercules: is the Atlantic-Mediterranean transition a phylogeographical break?Mol Ecol. 2007 Nov;16(21):4426-44. doi: 10.1111/j.1365-294X.2007.03477.x. Epub 2007 Oct 1. Mol Ecol. 2007. PMID: 17908222 Review.
-
Conservation Status of Long-Finned Pilot Whales, Globicephala melas, in the Mediterranean Sea.Adv Mar Biol. 2016;75:173-203. doi: 10.1016/bs.amb.2016.07.004. Epub 2016 Aug 25. Adv Mar Biol. 2016. PMID: 27770984 Review.
Cited by
-
Indicators to assess temporal variability in marine connectivity processes: A semi-theoretical approach.PLoS One. 2024 Jul 1;19(7):e0297730. doi: 10.1371/journal.pone.0297730. eCollection 2024. PLoS One. 2024. PMID: 38950009 Free PMC article.
-
Summer decapod crustacean larval communities along the eastern Spanish Mediterranean coast.PLoS One. 2022 Nov 17;17(11):e0275892. doi: 10.1371/journal.pone.0275892. eCollection 2022. PLoS One. 2022. PMID: 36395266 Free PMC article.
-
Mitochondrial, nuclear and morphological differentiation in the swimming crab Liocarcinus depurator along the Atlantic-Mediterranean transition.Sci Rep. 2024 Aug 20;14(1):19342. doi: 10.1038/s41598-024-69883-6. Sci Rep. 2024. PMID: 39164316 Free PMC article.
References
-
- Belkin IM, Cornillon PC. Fronts in the World Ocean’s Large Marine Ecosystems. Int. Council Explor. Sea. 2007;120:21.
-
- Wilson LJ, et al. Climate-driven changes to ocean circulation and their inferred impacts on marine dispersal patterns. Glob. Ecol. Biogeogr. 2016;25:923–939. doi: 10.1111/geb.12456. - DOI
Publication types
MeSH terms
Substances
LinkOut - more resources
Full Text Sources
