

Patterns of genetic diversity and structure of a threatened palm species (Euterpe edulis Arecaceae) from the Brazilian Atlantic Forest
- PMID: 35697755
- PMCID: PMC9411632
- DOI: 10.1038/s41437-022-00549-7
Patterns of genetic diversity and structure of a threatened palm species (Euterpe edulis Arecaceae) from the Brazilian Atlantic Forest
Erratum in
-
Correction to: Patterns of genetic diversity and structure of a threatened palm species (Euterpe edulis Arecaceae) from the Brazilian Atlantic Forest.Heredity (Edinb). 2022 Sep;129(3):202. doi: 10.1038/s41437-022-00556-8. Heredity (Edinb). 2022. PMID: 35948581 Free PMC article. No abstract available.
Abstract
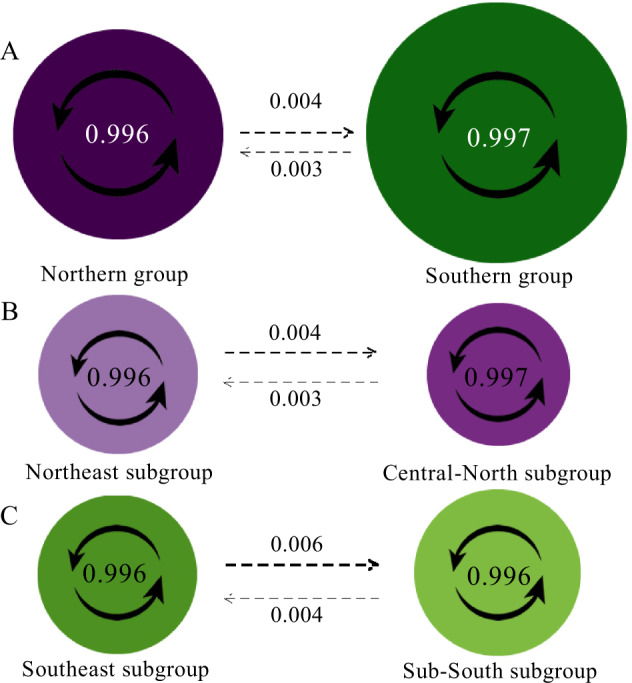
The detection of distribution patterns of genetic diversity of plant and animal species has contributed to the understanding of biodiversity and evolutionary history of the Atlantic Forest. We used microsatellite markers to access the genetic diversity and structure of 26 populations and 527 adult individuals of Euterpe edulis, a native palm which is an important food resource for fauna and is intensively exploited due to economic reasons. We found high genetic diversity and inbreeding in all populations analyzed. We report highest rates of inbreeding for this species, which could reflect the anthropic impacts of selective cutting, fragmentation, and change in foraging behavior from pollinators and less availability and mobility of large dispersers. We detected by STRUCTURE, two genetic groups, Northern and Southern, which divide the Brazilian Atlantic Forest geographically. These groups have low genetic admixtures, but we found a region of lineage hybridization in the contact zone with low recent gene flow. Distribution pattern of this species corroborates results from previous studies reporting the Last Glacial Maximum (LGM) have shaped the structuring of the species through movements of forests' expansion and contraction. The STRUCTURE analysis of each group revealed the presence of genetic subgroups with low rates of recurrent gene flow. Southern subgroups have higher rates of admixtures than the Northern subgroups, revealing greater historical connectivity of forests in this region.
© 2022. The Author(s), under exclusive licence to The Genetics Society.
Conflict of interest statement
The authors declare no competing interests.
Figures


References
-
- Aguiar-Melo C, Zanella CM, Goetze M, Palma-Silva C, Hirsch LD, Neves B et al. (2019) Ecological niche modeling and a lack of phylogeographic structure in Vriesea incurvata suggest historically stable areas in the southern Atlantic Forest. Am J Bot 10.1002/ajb2.1317 - PubMed
-
- Bicudo MOP, Ribani RH, Beta T (2014) Anthocyanins, phenolic acids and antioxidant properties of juçara fruits (Euterpe edulis M.) along the on-tree ripening process. Plant Foods Hum Nutr 10.1007/s11130-014-0406-0 - PubMed
-
- Blengini IAD, Cintra MAMU, Caiafa AN (2015) Proposta de Unidade de Conservação da Serra da Jiboia. Gambá, Salvador, BA, https://www.gamba.org.br/wp-content/uploads/2016/03/Proposta-Final.pdf Accessed 05 May 2022
-
- Bourscheid K. Euterpe edulis—Palmito juçara. In: Coradin L, Siminski A, Câmara, Reis A, editors. Espécies nativas da flora brasileira de valor econômico atual ou potencial: plantas para o futuro - Região Sul. Brasília, D: Ministério do Meio Ambiente; 2011. pp. 179–183.
-
- Cabanne GS, d’Horta FM, Sari EHR, Santos FR, Miyaki CY (2008) Nuclear and mitochondrial phylogeography of the Atlantic forest endemic Xiphorhynchus fuscus (Aves: Dendrocolaptidae): Biogeography and systematics implications Molecular. Mol Phylogenet Evol 10.1016/j.ympev.2008.09.013 - PubMed
Publication types
MeSH terms
LinkOut - more resources
Full Text Sources
