. 2022 Jun;24(6):858-871.
doi: 10.1038/s41556-022-00932-w. Epub 2022 Jun 13.

Integrated multi-omics reveal polycomb repressive complex 2 restricts human trophoblast induction

Affiliations

Integrated multi-omics reveal polycomb repressive complex 2 restricts human trophoblast induction

Dick W Zijlmans et al. Nat Cell Biol. 2022 Jun.

Abstract

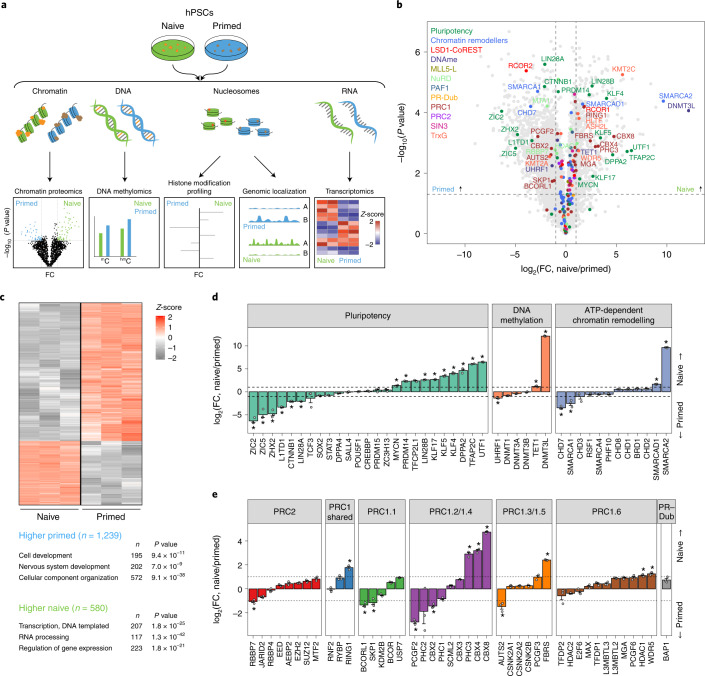
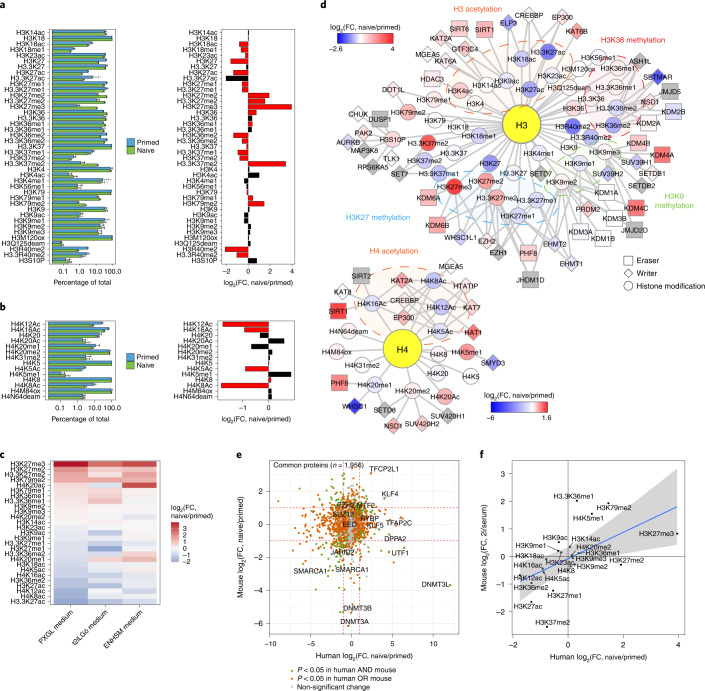
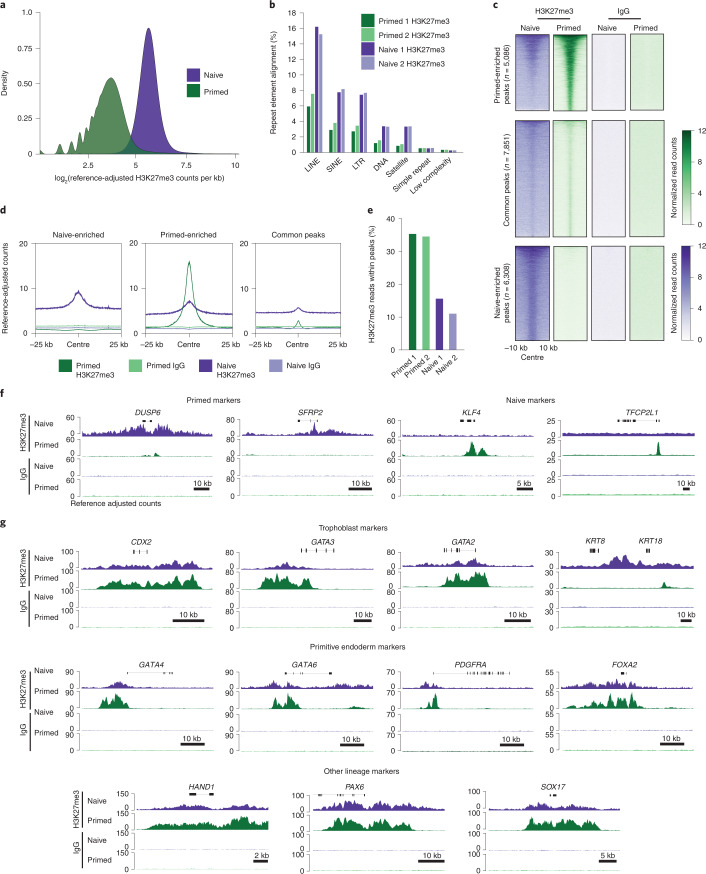
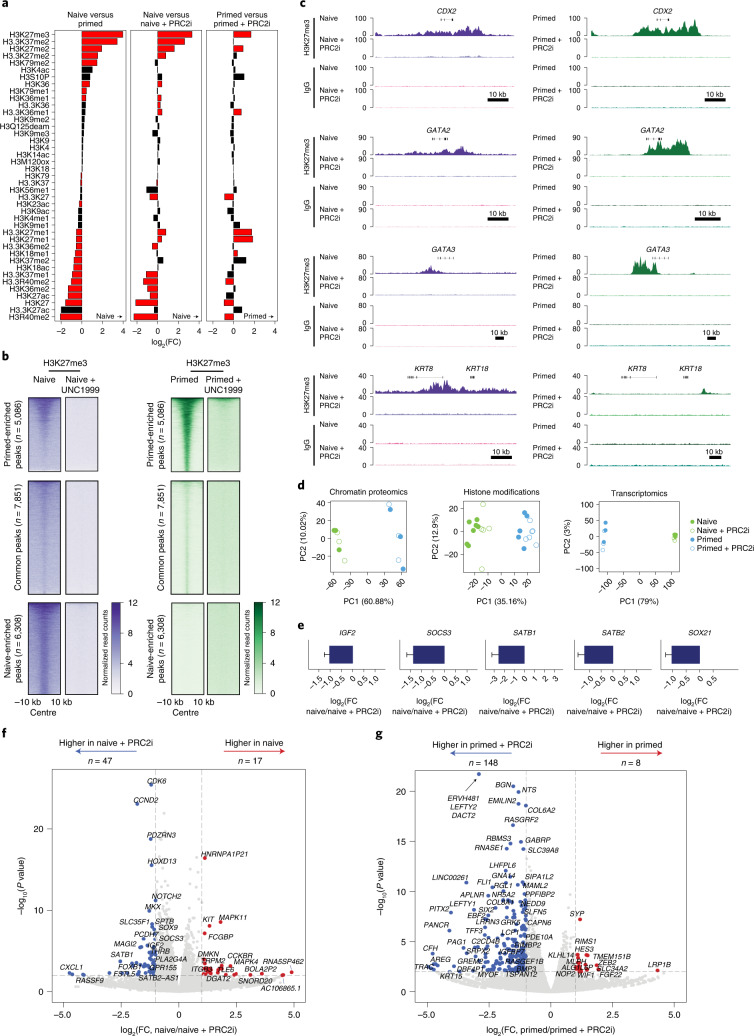
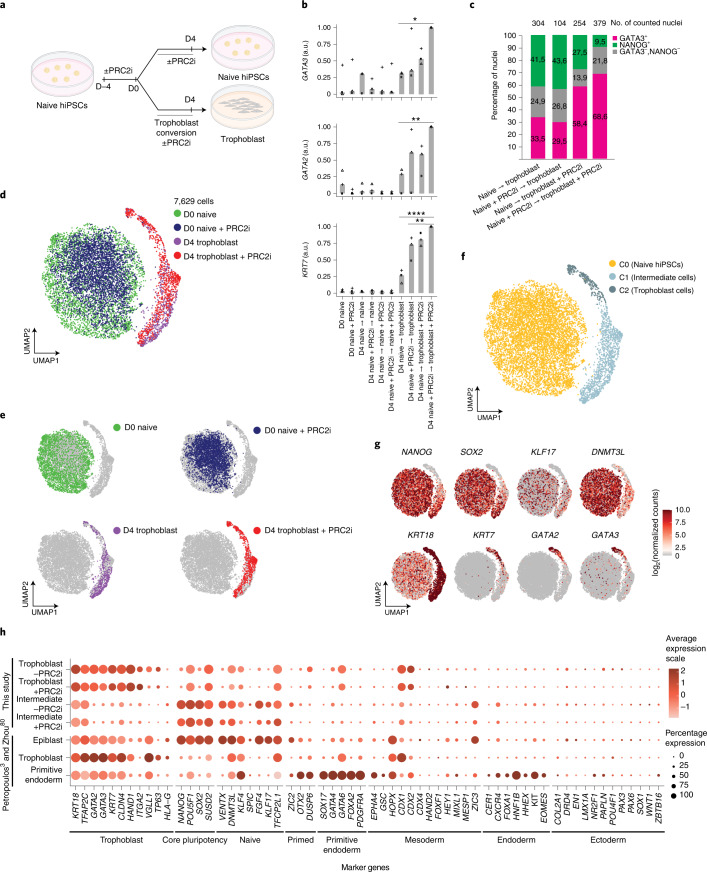
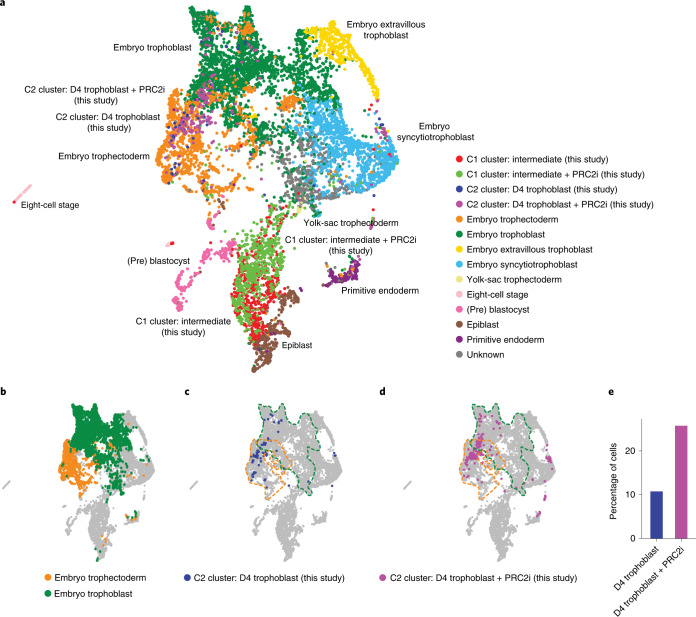
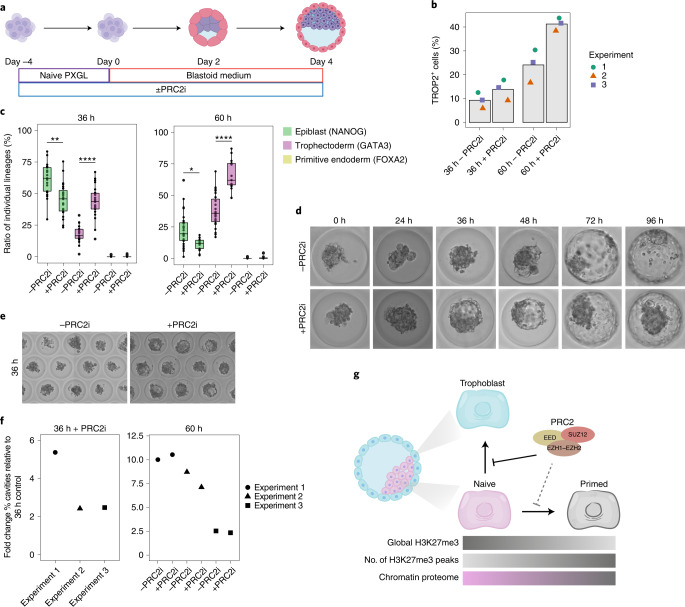
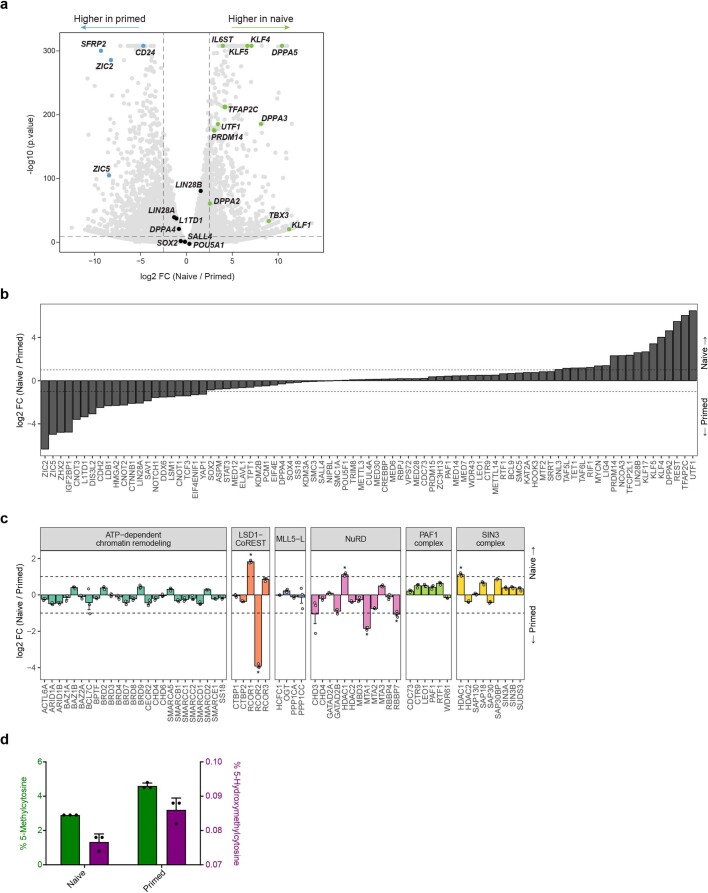
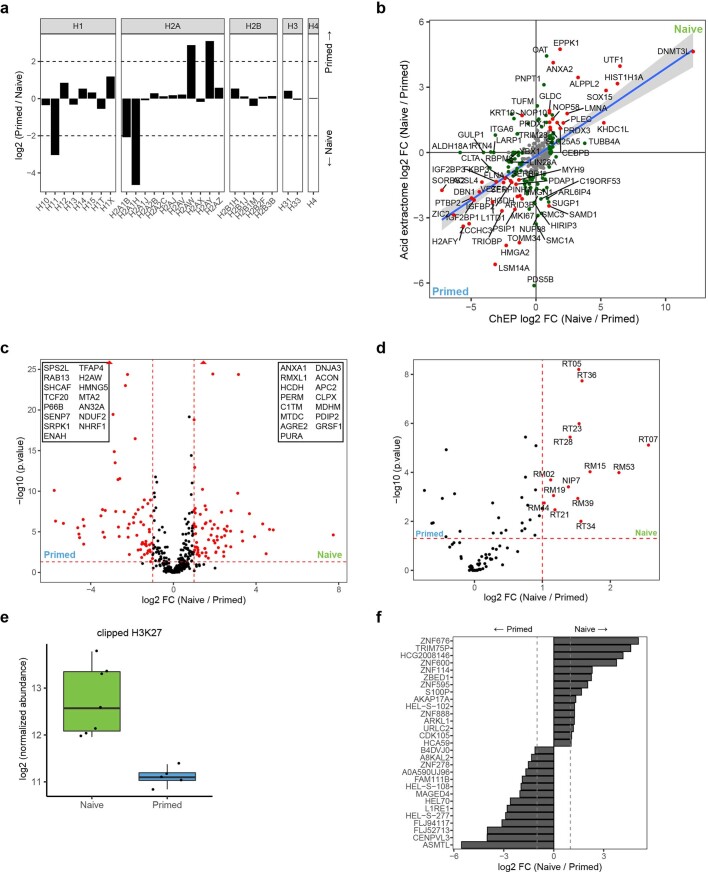
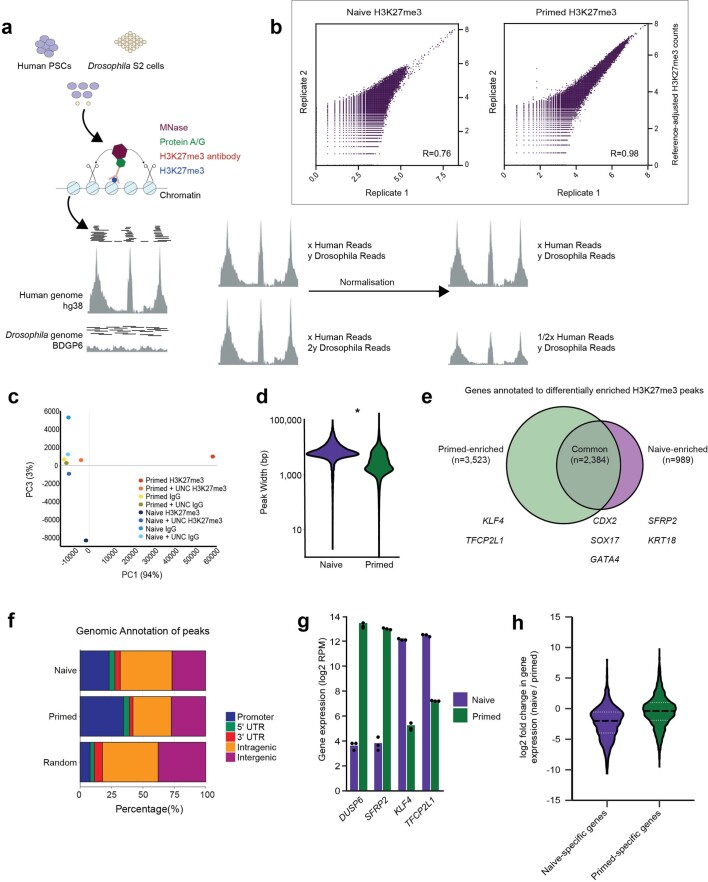
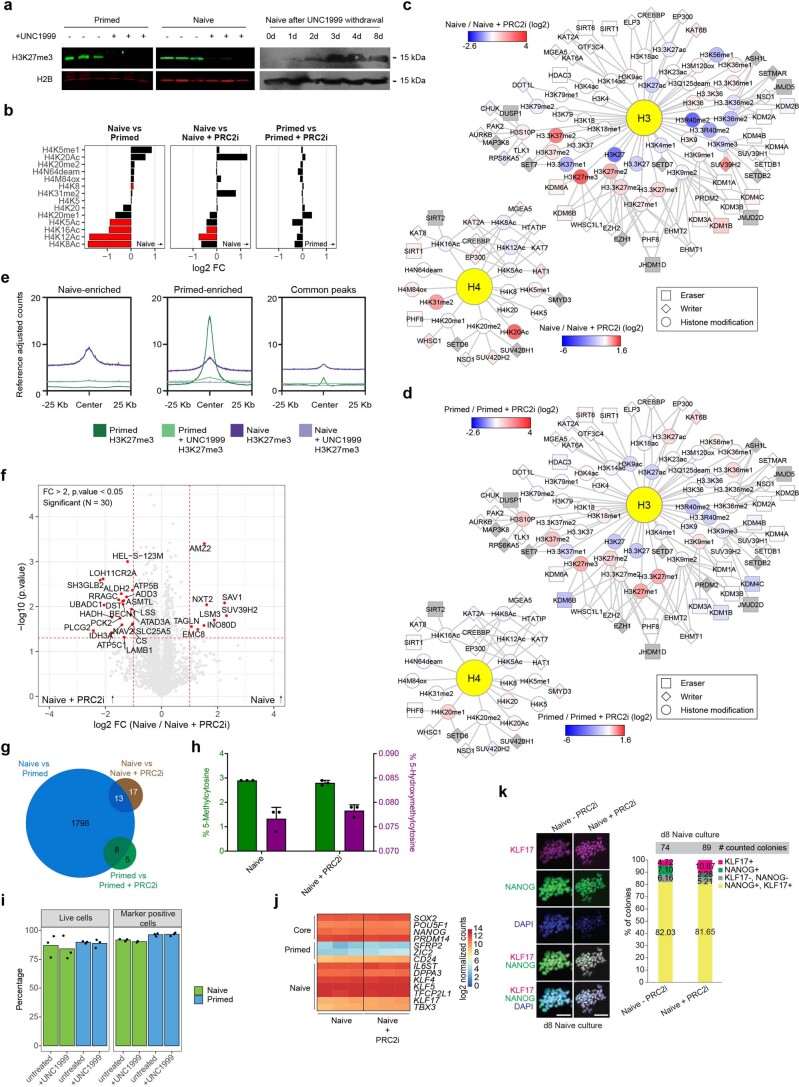
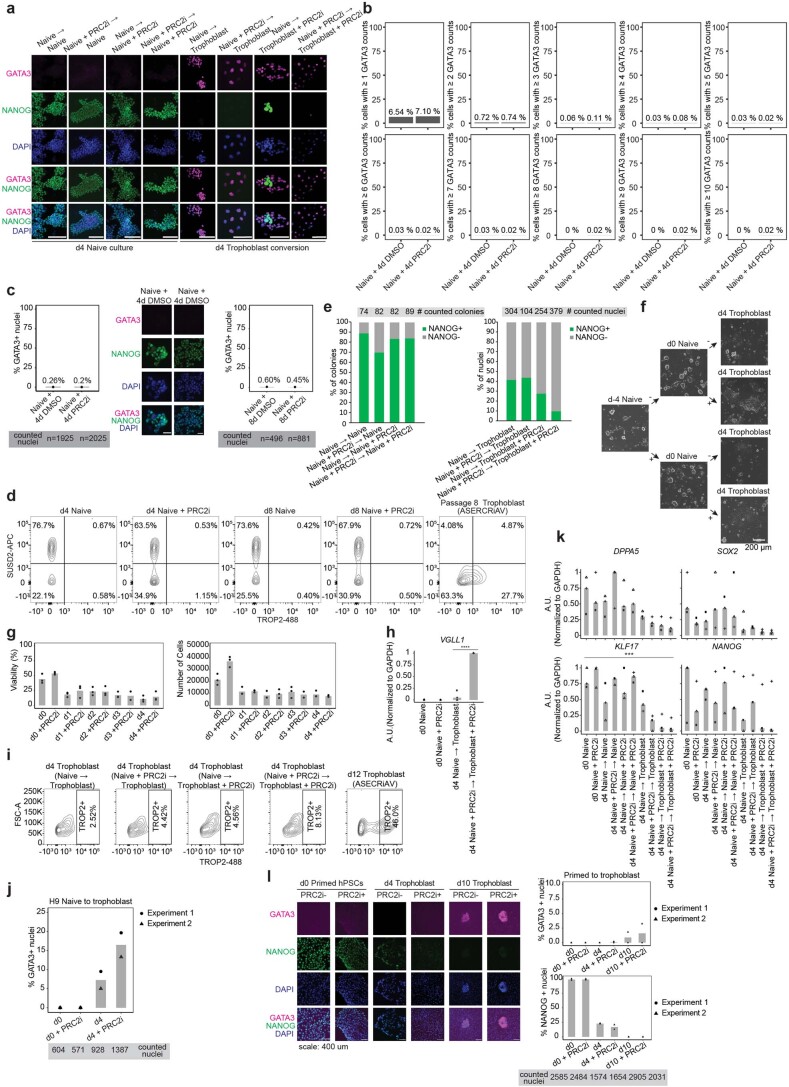
Human naive pluripotent stem cells have unrestricted lineage potential. Underpinning this property, naive cells are thought to lack chromatin-based lineage barriers. However, this assumption has not been tested. Here we define the chromatin-associated proteome, histone post-translational modifications and transcriptome of human naive and primed pluripotent stem cells. Our integrated analysis reveals differences in the relative abundance and activities of distinct chromatin modules. We identify a strong enrichment of polycomb repressive complex 2 (PRC2)-associated H3K27me3 in the chromatin of naive pluripotent stem cells and H3K27me3 enrichment at promoters of lineage-determining genes, including trophoblast regulators. PRC2 activity acts as a chromatin barrier restricting the differentiation of naive cells towards the trophoblast lineage, whereas inhibition of PRC2 promotes trophoblast-fate induction and cavity formation in human blastoids. Together, our results establish that human naive pluripotent stem cells are not epigenetically unrestricted, but instead possess chromatin mechanisms that oppose the induction of alternative cell fates.


Conflict of interest statement

The Institute for Molecular Biotechnology, Austrian Academy of Sciences has filed patent application no. EP21151455.9 describing the protocols for human blastoid formation and for the blastoid–endometrium interaction assay. A.J. and N.R. are the inventors on this patent. All other authors declare no competing interests.

Figures

Fig. 1
Fig. 1. Naive and primed hPSCs contain distinct chromatin proteomes.
a, Schematic of the workflow used for multi-omics profiling of naive and primed hPSCs. b, Volcano plot of quantified chromatin-associated proteins (n = 4,576 proteins) in naive and primed hPSCs. Major classes of chromatin regulators and protein complexes, indicated in the top-left corner, are highlighted. Complex members and regulators with significantly changed levels of expression (two-sided Student’s t-test, P < 0.05, FC > 2) are labelled; n = 3 biologically independent samples for each cell type. Horizontal dashed lines represent P = 0.05; vertical dashed lines represent FC = 2. c, Heatmap of the normalized Z-score of the differentially expressed proteins identified in b (n = 1,819 proteins; top). Representative gene ontology terms for proteins that were significantly enriched (two-sided Student’s t-test, P < 0.05; FC > 2) in naive or primed hPSCs are listed (bottom). d,e, Comparison of the chromatin occupancy for major regulators of pluripotency, DNA methylation and chromatin remodelling (d), and polycomb repressive complexes (e) between naive and primed hPSCs (n = 3 biologically independent samples). Data are presented as the mean ± s.e.m. The dashed lines represent FC = 2; *P < 0.05 and FC > 2 (two-sided Student’s t-test). e, Only high-change proteins (log2(FC) > 0.5) involved in ATP-dependent chromatin remodelling are shown. Low-change proteins are shown in Extended Data Fig. 1d. Source data are provided. Source data
Fig. 2
Fig. 2. Profiling of hPTMs reveals decoupling of chromatin-modifier activity and abundance when comparing naive and primed pluripotency.
a,b, Levels of H3 (a) and H4 (b) hPTMs in naive and primed hPSCs. The relative abundance of each hPTM as a percentage of the total for the histone residue (for example, the relative abundances of H3K79me1, H3K79me2 and H3K79 unmodified all add up to 100%) is provided (left). Unmodified histones are only shown for residues with >1 modification. Data are presented as the mean ± s.d. Change in hPTMs between naive and primed hPSCs as log2-transformed FC values (right). The red bars indicate significantly changed hPTMs (two-sided Student’s t-test with Benjamini–Hochberg correction, P < 0.05); n = 7 (naive hPSCs) and 5 (primed hPSCs) biologically independent samples. c, Comparison of hPTMs in naive and primed H9 hPSCs; the naive hPSCs were cultured in different media conditions. Only hPTMs identified in all datasets were retained. Data on naive hPSCs cultured in ENHSM medium were taken from. d, Integration of the chromatin proteome and hPTM measurements for naive and primed hPSCs, separated by histone H3 and H4 modules. Nodes represent chromatin modifiers and hPTMs, and are coloured according to the log2-transformed abundance FC. Edges indicate known functional connections (write or erase) between the nodes. Highlighted hubs indicate major hPTM groups. Chromatin modifiers in grey nodes were not detected. e, Comparison of the human and mouse chromatin proteomes of naive relative to primed pluripotent states. Only proteins identified in both human and mouse datasets were retained. Proteins with P < 0.05 were deemed as significantly changed (two-sided Student’s t-test). Red dashed lines indicate FC = 2. Proteins referred to in the text as well as polycomb proteins are labeled. Mouse chromatin proteome data were obtained from. f, Comparison of the human and mouse hPTMs in naive relative to primed pluripotent states. Only hPTMs identified in both human and mouse datasets were retained. The blue line indicates the best-fit linear regression; the shaded grey area indicates the 95% confidence interval. Mouse hPTM data were obtained from. Source data are provided. Source data
Fig. 3
Fig. 3. H3K27me3 localization, as determined by cCUT&RUN in naive and primed hPSCs.
a, Kernel density estimate of H3K27me3 cCUT&RUN reads in naive and primed hPSCs after normalization to the Drosophila spike-in. The genome was divided into 1-kb bins, the number of H3K27me3 reads in each bin was quantitated and the log2-transformed value of the counts was calculated; n = 2 biologically independent experiments for all samples (primed and naive H3K27me3 and IgG cCUT&RUN) excepting naive IgG, which is from n = 1 experiment. b, Normalized H3K27me3 reads mapped at repetitive element classes in the human genome as a percentage of the total sequenced reads for naive and primed hPSCs. SINE and LINE, short and long interspersed nuclear elements, respectively; LTR, long terminal repeat. c, Heatmap of normalized H3K27me3 (left) and IgG (right) cCUT&RUN read counts within a 10-kb peak-centred window in naive and primed hPSCs. Regions were subsetted into primed-enriched (n = 5,086 regions; top), common (n = 7,851 regions; middle) and naive-enriched (n = 6,308 regions; bottom) sites. d, Metaplots showing average profiles of normalized H3K27me3 counts across peaks, with relative abundance and distribution within 25 kb either side of the peak centre for primed-specific (middle), shared (right) and naive-specific (left) peaks. e, Percentage of normalized H3K27me3 reads within defined peaks for naive and primed hPSCs. f, Normalized H3K27me3 (top) and IgG (bottom) cCUT&RUN genome browser tracks over naive-specific (DUSP6 and SFRP2; left) and primed-specific (KLF4 and TFCP2L1; right) H3K27me3-marked genes. g, Normalized H3K27me3 (top) and IgG (bottom) cCUT&RUN genome browser tracks for exemplar trophoblast (CDX2, GATA3, GATA2, KRT8 and KRT18; top), primitive endoderm (GATA4, GATA6, PDGFRA and FOXA2; middle) and additional alternative lineage marker genes (HAND1, PAX6 and SOX17; bottom) in naive and primed hPSCs. Regions with P < 0.05 after Benjamini–Hochberg multiple-testing correction were identified as differentially enriched. Source data are provided. Source data
Fig. 4
Fig. 4. Histone, chromatin and transcriptional responses following short-term acute PRC2 inhibition.
a, Levels of H3 hPTMs in naive and primed hPSCs with and without PRC2 activity inhibition for 4 d (PRC2i). Data are presented as the log2-transformed FC between the two conditions indicated above each panel. Data are ordered according to the left panel. The red bars indicate significantly changed hPTMs (two-sided Student’s t-test with Benjamini–Hochberg correction, P < 0.05; n = 7 (naive hPSCs), 5 (primed hPSCs), 6 (naive hPSCs + PRC2i) and 8 (primed hPSCs + PRC2i) biologically independent samples). b, Heatmaps of normalized H3K27me3 cCUT&RUN read counts within a 10-kb peak-centred window in naive and primed hPSCs with and without PRC2i. Regions were subsetted into primed-enriched (n = 5,086 regions), common (n = 7,851 regions) and naive-enriched (n = 6,308 regions) sites; n = 2 biologically independent experiments for all samples (primed and naive H3K27me3 and IgG cCUT&RUNs, both with and without PRC2i) excepting naive IgG, which is from n = 1 experiment. Samples without PRC2i treatment are reproduced from Fig. 3. c, Genome browser tracks show normalized H3K27me3 and IgG cCUT&RUN reads for trophoblast genes (CDX2, GATA2, GATA3, and KRT8 and KRT18) in naive and primed hPSCs with and without PRC2i. d, Principal component (PC) analysis of the chromatin proteome (left), hPTM landscape (middle) and transcriptome (right) of naive and primed hPSCs with and without PRC2i (n = 3 biologically independent samples for chromatin proteome and transcriptomes). e, Gene expression levels, determined through RNA-seq analysis, of trophoblast-associated genes (IGF2, SOCS3, SATB1, SATB2 and SOX21) in naive hPSCs with and without PRC2i (n = 3 biologically independent samples). Data are presented as the mean ± s.d. f,g, Differential gene expression in naive (f) and primed (g) hPSCs with and without PRC2i (n = 3 biologically independent samples). Genes enriched in the untreated condition are highlighted in red and those enriched after PRC2i are highlighted in blue; the number of differentially expressed genes in both conditions are indicated. Dashed lines indicate P < 0.05 and log2(FC) > 1 (two-sided Student’s t-test). Source data are provided. Source data
Fig. 5
Fig. 5. PRC2 inhibition promotes naive hPSC-to-trophoblast fate induction.
a, Schematic of the experimental design used to study the role of PRC2 and H3K27me3 in the conversion of naive human induced PSCs (hiPSCs) to trophoblasts. Inhibition of PRC2 was applied for 4 d before, during or throughout (before and during) trophoblast conversion. Created with BioRender.com. b, Levels of expression of the trophoblast marker genes GATA3, GATA2 and KRT7, determined using quantitative PCR with reverse transcription. The expression values were normalized to GAPDH; experiments are shown as individual data points (squares, triangles and circles; n = 3 biologically independent samples); a.u., arbitrary unit. Two-sided Student’s t-test with Bonferroni adjustment; *P < 0.05, **P < 0.01 and ****P < 0.0001. c, Levels of GATA3+ and NANOG+ nuclei, determined from immunofluorescence microscopy images (see Extended Data Fig. 5a), on day 4 of naive-to-trophoblast conversion; n = 2 biologically independent samples. d,e, scRNA-seq analysis. d, UMAP of single-cell transcriptomes coloured according to sample. Each dot represents a cell (n = 7,629 cells). e, UMAPs of the four treatment combinations shown separately. Grey dots indicate cells not belonging to the highlighted treatment. f, UMAP of single-cell transcriptomes coloured according to the cell clusters (C0–C3). Each dot represents a cell. g, Analysis (scRNA-seq) of pluripotency and trophoblast marker genes. Each dot represents a cell. Data are log-transformed normalized counts of gene expression. h, Expression of cell type-specific marker genes in two cell clusters (C1 and C2) with and without PRC2i, and in human embryo (epiblast, trophoblast and primitive endoderm) data from,. The size of the circles represents the proportion of cells in the cluster with the indicated gene expression enrichment. a,b,d,e, D, day. Source data are provided. Source data
Fig. 6
Fig. 6. Evaluation of differentiation by comparison with human embryo data.
a, UMAP projection of the human pre-implantation and postimplantation embryo integration with day 4 (D4) in vitro trophoblast conversion with and without PRC2i. Human embryo data from,. b, UMAP projection of embryo trophectoderm and embryo trophoblast on the UMAP from a. c,d, UMAP projection of D4 trophoblast cells in C2 with (d) and without (c) PRC2i treatment projected on the UMAP from a. The clusters correspond to those in Fig. 5d–f. Dotted lines represent the embryo trophectoderm (orange) and embryo trophoblast (green) as shown b. e, Proportion of D4 trophoblast conversion cells, with and without PRC2i, that were categorized as belonging to the C2 trophoblast cluster. Source data are provided. Source data
Fig. 7
Fig. 7. PRC2 inhibition accelerates trophoblast development and cavity formation in human blastoids.
a, Schematic of the experimental set-up for studying the role of PRC2 in trophoblast formation in human blastoids. Blastoids are formed by aggregating naive hPSCs in microwells. Created with BioRender.com. b, Proportion of TROP2+ trophoblast cells in human blastoids at 36 h and 60 h with and without PRC2i; n = 3 biologically independent samples. c, NANOG, GATA3 and FOXA2 expression in 36 h (left) and 60 h (right) blastoids with or without PRC2i, quantified from immunofluorescence images (Extended Data Fig. 7a–d). The boxplots show the interquartile range (box limits showing the 25th and 75th percentile) and median (centre line) of the ratio of cells belonging to individual lineages, represented as percentages of the total number of cells per blastoid. Whiskers indicate 1.5x the interquartile range; n = 21 (36 h without PRC2i (−PRC2i)), 23 (36 h + PRC2i), 27 (60 h − PRC2i blastoids) and 17 (60 h + PRC2i) blastoids were quantified from a single experiment. Two-sided Wilcoxon rank-sum test with Bonferroni correction; 36 h, **P = 3.7 × 10−3 and ****P = 1.1 × 10−7; 60 h, *P = 1.1 × 10−2 and ****P = 2.5 × 10−7. d,e, Bright-field images showing accelerated cavity formation during human blastoid formation (0–96 h) following PRC2i treatment (d) and at 36 h of human blastoid formation following PRC2i treatment (e). f, Fold change in cavitated human blastoids after 36 h with PRC2i (left) and 60 h with or without PRC2i (right). Data are shown as the FC normalized to 36 h without PRC2i; n = 3 biologically independent samples. g, Model showing that PRC2 restricts the induction of trophoblast fate from naive hPSCs. For color bars, darker colors indicate higher levels, except for the chromatin proteome, where pink represents naive chromatin proteome and grey represents primed chromatin proteome. Our findings establish that PRC2 acts as a barrier to lineage specification in naive hPSCs, opposing the formation of trophoblast cells in the presence of differentiation cues. In addition, our results uncover a potential role for PRC2 to safeguard the naive epigenome against adopting features of primed pluripotency, similar to observations in mice. PRC2 activity establishes a higher global level of H3K27me3 in naive hPSCs compared with primed hPSCs, whereas the number of defined H3K27me3 peaks shows the opposite pattern. Our study also defined distinct chromatin proteomes that differ between naive and primed pluripotent states. Source data are provided. Source data
Extended Data Fig. 1
Extended Data Fig. 1. Global analysis of chromatin proteome and transcriptome in naive and primed hPSCs.
a. Volcano plot showing differential gene expression as detected by RNA-seq between naive and primed hPSCs (n = 3 biologically independent samples). Core pluripotency factors (black) as well as factors specific to each pluripotent state (blue for primed; green for naive) are highlighted. Dashed lines indicate p-value < 0.05 and log2fold change > 2.5 (two-sided student’s t test). P-values can be found in Supplementary Table 8. b. Chromatin occupancy of all proteins with a potential role in stem cell maintenance in naive and primed hPSCs (n = 3 biologically independent samples). Protein names were collected from AmiGO (http://amigo.geneontology.org/; ‘stem cell maintenance’ GO:0019827),. The following pluripotency-associated proteins were not detected in our dataset: ASCL2, BMP7, BMPR1A, DAZL, DLL1, ERAS, ESRRB, FANCC, FGF10, FGF4, FGFR1, FOXO3, FZD7, HES1, HES5, HESX1, ID1, ID2, ID3, JAG1, KIT, KLF10, KLF2, LBH, LDB2, LIF, LOXL2, LRP5, MCPH1, MED21, MED27, MMP24, MYC, NANOG, NANOS2, NODAL, NOG, NOTCH2, NR0B1, NR2E1, PADI4, PAX2, PAX8, PELO, PHF19, PIWIL2, PRDM16, PROX1, PRRX1, PTN, RAF1, SETD6, SFPI1, SFRP1, SIX2, SKI, SMO, SOX9, SPI1, TAL1, TBX3, TCF15, TCL1, TERT, TP63, TUT4, WNT7A, WNT9B, ZFP36L2, ZNF322, ZNF358, ZNF706. c. ChEP analysis of differential abundance of chromatin-associated complexes in naive and primed hPSCs (n = 3 biologically independent samples), supplementing Fig. 1d,e. Data are presented as mean values + /- SEM. Dashed lines represent 2-fold change. Asterisks indicate p-value < 0. 05 and fold change > 2 (two-sided student’s t test). Low-change proteins (log2 FC < 0.5) involved in ATP-dependent chromatin remodelling (Fig. 1e) are shown. d. Mass spectrometry analyses of global levels of DNA methylation (green) and DNA hydroxymethylation (purple) in naive and primed hPSCs (n = 3 biologically independent samples) Data are presented as mean values + /- SD. Underlying source data is provided in Source Data Extended Data Fig. 1. Source data
Extended Data Fig. 2
Extended Data Fig. 2. Global analysis of acid extractome and hPTM clipping in naive and primed hPSCs.
a. Overview of histone variants identified in acid extractomes. Data are visualized as log2 transformed normalized expression of primed over naive hPSCs. Naive hPSCs, n = 7 biologically independent samples; primed hPSCs, n = 5 biologically independent samples. b. Comparison of proteins identified in the chromatin proteome (n = 4,576 proteins) and acid extractome (n = 894 proteins) in naive and primed hPSCs. Only proteins identified in both conditions were retained (n = 355 proteins). Proteins significantly changing (two-sided student’s t test for chromatin proteome, moderated t test with Benjamini–Hochberg correction for acid extractome, p-value <0.05, > 2-fold change) in both datasets are indicated with red dots, while proteins significantly changing in only one dataset are highlighted in green dots. Strongest changing proteins (p-value < 0.05 & > 4-fold change in one dataset) are labelled by name. Blue line indicates best fit linear regression, while the shaded grey area indicates 95% confidence interval. c. Quantification of proteins uniquely identified in the acid extractome of naive and primed hPSCs (n = 539 proteins). Significantly changing proteins (moderated t test with Benjamini–Hochberg correction, p-value <0.05 & >2-fold change) are indicated with red dots. The 15 most strongly changing proteins for each pluripotent state are labelled by name. d. Quantification of ribosomal and nucleolar proteins identified in the acid extractome of naive and primed hPSCs (n = 128 proteins). Significantly changing proteins (moderated t test with Benjamini–Hochberg correction, p-value <0.05 & >2-fold change) are indicated with red dots and labelled by name. e. Log2 transformed abundance of H3 tail clipping events (normalized against all histone peptidoforms) as identified by mass spectrometry. The boxplots show the interquartile range (box limits) and the median (centre line) of the abundance of clipping events. Naive hPSCs, n = 7 biologically independent samples; primed hPSCs, n = 5 biologically independent samples. f. Comparison of chromatin-associated proteins uniquely identified in human between naive and primed pluripotent states. The listed proteins have no known mouse ortholog or homologue. Underlying source data is provided in Source Data Extended Data Fig. 2. Source data
Extended Data Fig. 3
Extended Data Fig. 3. Chromatin profiling of H3K27me3 in naive and primed hPSCs.
a. Schematic of the cCUT&RUN method and normalization strategy. b. Scatterplots comparing the log2 transformed H3K27me3 normalized read count across 1 kb windows for naive (left) and primed (right) hPSCs. Correlation r is determined by Pearson correlation prior to transformation. 2 biologically independent experiments for primed and naive H3K27me3 and IgG calibrated CUT&RUNs, with the exception of naive IgG cCUT&RUN which was performed once. c. Principal Component Analysis of normalized cCUT&RUN data. d. Violin plots showing the H3K27me3 peak width of normalized cCUT&RUN data in naive and primed hPSCs. The difference in width between primed and naive hPSCs is statistically significant, indicated by * (two-sided student’s t test, p < 2.2×10⁻¹⁶; n = 10,187 peaks for naive PSCs and n = 17,626 peaks for primed PSCs). e. Venn diagram showing the extent of overlap of nearest genes (within 10 kb of promoter) to H3K27me3 peaks in naive and primed hPSCs, with example genes added for each category. f. Stacked bar plot describing genomic annotation of H3K27me3 peaks in untreated naive and primed hPSCs, compared to a background sample of 10,000 randomly generated peaks. g. Gene expression values of primed-specific (DUSP6 and SFRP2) and naive-specific (KLF4 and TFCP2L1) transcripts from bulk RNA-sequencing data. Individual data points from n = 3 biologically independent samples are shown, and the bar indicates the mean expression value. h. Violin plots show the fold change in gene expression between naive and primed hPSCs for naive-specific and primed-specific H3K27me3-marked genes from bulk RNA-sequencing data. The plots show the 25th and 75th quartiles (white dotted lines) and the median (black dashed lines). Underlying source data is provided in Source Data Extended Data Fig. 3. Source data
Extended Data Fig. 4
Extended Data Fig. 4. Four-day PRC2 inhibition by UNC1999 efficiently removes H3K27me3, with minor alterations in chromatin proteome and hPTM landscape.
a. Western blot validation of H3K27me3 removal in naive and primed hPSCs upon treatment with UNC1999 (Data shown represent 3 biologically independent samples [AU: modified as “n = X” statement is retained for cases where statistics are derived]). b. Histone PTM quantification for H4 in naive and primed hPSCs, with and without PRC2i. Data are visualized as log2 fold changes between two conditions, which are listed on top of each panel. Data are ordered according to the first panel. Red bars indicate significantly changing hPTMs (two-sided student’s t test with Benjamini–Hochberg correction, p-value < 0.05). Naive hPSCs, n = 7 biologically independent samples; primed hPSCs, n = 5 biologically independent samples; naive hPSCs + inhibitor n = 6 biologically independent samples; primed hPSCs + inhibitor, n = 8 biologically independent samples. c-d. Integration of the chromatin proteome and hPTM measurements for naive (c) and primed (d) hPSCs with and without PRC2i. Nodes represent chromatin modifiers and hPTMs, and are coloured by log2 fold change in abundance. Edges indicate functional connection (write or erase) between the nodes. Chromatin modifiers in grey nodes were not detected. e. Metaplots showing average profiles of normalized H3K27me3 reads across peaks, with relative abundance and distribution within 25 kb either side of the peak centre for primed-enriched, common and naive-enriched peaks in naive and primed hPSCs, with or without PRC2i. Two biologically independent experiments were used for primed and naive H3K27me3 and IgG cCUT&RUN experiments, both with and without PRC2i, with the exception of naive IgG cCUT&RUN which was performed once. Non-inhibitor treated samples are replicated from Extended Data Fig. 3. f. Specific changes in chromatin-associated proteins induced by PRC2i in naive hPSCs. Volcano plot of chromatin-associated proteins (n = 3,784 proteins) quantified in n = 3 biologically independent samples for naive hPSCs with or without PRC2i. Significantly changing (two-sided student’s t test, p-value <0.05, >2-fold change) proteins are indicated with red dots and labelled by name. g. Numbers of significantly changing chromatin proteins (two-sided student’s t test, p-value < 0.05 & >2-fold change) between naive and primed hPCSs and after PRC2i. N = 3 biologically independent samples. h. Global DNA methylation (green) and DNA hydroxymethylation (purple) levels in naive hPSCs, with and without PRC2i (n = 3 biologically independent samples). Data are presented as mean values + /- SD. i. Flow cytometry analysis of cell viability (left) and state-specific pluripotency markers (right) in naive and primed hPSCs treated with and without UNC1999 for four days. Cell viability was assessed using a live-dead dye, and the values shown represent the percentage of live cells in the total cell population. For the protein marker analysis, naive hPSCs were assayed for the expression of cell-surface markers SUSD2 and CD75, and primed hPSCs for the cell-surface markers SSEA4 and CD24. The values shown are the percentage of double-positive cells (SUSD2 and CD75, or SSEA4 and CD24) out of the total population of live cells. N = 3 biologically independent samples. j. Heatmap of normalized counts from RNA-seq of naive hPSCs with and without PRC2i for naive, primed and core pluripotency marker genes. Data are visualized as log2 normalized counts. N = 3 biologically independent samples. k. Immunofluorescence analysis for KLF17 (magenta), NANOG (green) and DAPI (blue) in naive hiPSCs after 8 days with or without PRC2i in PXGL medium. Right panel: quantification of KLF17 and/or NANOG positive colonies. Images are representative of 2 experiments. Scale bar = 100 mm. Underlying source data is provided in Source Data Extended Data Fig. 4. Source data
Extended Data Fig. 5
Extended Data Fig. 5. PRC2 inhibition promotes naive to trophoblast induction.
a. Immunofluorescence analysis of trophoblast and pluripotency markers with or without PRC2 inhibition. Naive hiPSCs were stained for GATA3 (magenta), NANOG (green) and DAPI (blue) at day 4 of naive to trophoblast conversion with PRC2 inhibition (PRC2i) during the 4 days preceding trophoblast conversion only (Naive + PRC2i → Trophoblast), or during trophoblast conversion only (Naive → Trophoblast + PRC2i), or throughout the experiment (Naive + PRC2i → Trophoblast + PRC2i). Representative images from 3 experiments. Scale bar = 100 mm. b. Proportion of naive hiPSCs with GATA3 expression using different thresholds of scRNA-seq data counts to deem a cell GATA3 positive after 4 days of PRC2i in PXGL or in DMSO control conditions. c. Immunofluorescence analysis of naive hPSC with and without PRC2i. Cells were stained for GATA3 and DAPI at day 4 (H9 hPSCs; n = 1,925 cells for day 4 Naïve; n = 2,025 cells for day 4 Naive + PRC2i, in two experiments) and day 8 (ICSIG-1 hiPSCs; n = 496 cells for day 8 Naïve; n = 881 cells for day 8 Naive + PRC2i, in one experiment). Middle panel shows representative images for day 4 (H9 hPSCs). Left and right panels show quantification of GATA3 + nuclei for day 4 and day 8, respectively. Scale bar = 200 mm. d. Flow cytometry analysis of TROP2 and SUSD2 in naive hiPSCs at 4 and 8 days with or without PRC2i treatment. This experiment was performed once. e. Quantification of the proportion of colonies expressing or lacking NANOG protein expression in 2 experiments as evaluated by immunofluorescence. The number of colonies counted is shown on top of the panels. f. Phase contrast images of representative cells at day -4 (d -4), 0 (d0) and 4 (d4) of naive hiPSC to trophoblast conversion. Representative images of 3 experiments. g. Cell viability (left) and cell number (right) during naive hiPSC to trophoblast conversion with and without PRC2i. Cells have been pretreated for 4 days with PRC2i. N = 3 biologically independent samples. h. RT-qPCR assay for trophoblast marker VGLL1. Expression was normalized to GAPDH. Squares, triangles and circles represent n = 3 biologically independent samples, each with averaged biological triplicates or duplicates in each experiment. A.U. = arbitrary unit. Two-sided t test with Bonferroni adjustment, *p < 0.05, **p < 0.01, ***p < 0.001, ****p < 0.0001. i. Flow cytometry analysis of TROP2 and SUSD2 markers during naive hiPSC to trophoblast conversion with and without PRC2i treatment or pre-treatment at day 4. Day 12 trophoblast cells were included as a positive control. This experiment was performed once. j. Quantification of immunofluorescence analysis of H9 naive hPSC to trophoblast conversion with and without PRC2i from 2 experiments. Cells were stained for GATA3 at day 0 and day 4. k. RT-qPCR assay for pluripotency-associated genes, DPPA5, SOX2, KLF17 and NANOG (normalized to GAPDH) at day 0 and 4 of naive hiPSC to trophoblast conversion with and without PRC2 pre-treatment, treatment during trophoblast conversion alone, or PRC2i throughout the experiment. Squares, triangles and circles represent independent experiments (n = 3 experiments). For each experiment, the average of 3 or 2 biologically independent samples is shown. A.U. = arbitrary unit. Two-sided t-test with Bonferroni adjustment, *p < 0.05, **p < 0.01, ***p < 0.001, ****p < 0.0001. l. Immunofluorescence analysis of primed hPSC to trophoblast conversion with and without PRC2i. Cells were stained for GATA3, NANOG and DAPI at day 0, day 4 and day 10. Right panel shows quantification of GATA3 + and NANOG + nuclei. Representative images of 2 experiments. Underlying source data is provided in Source Data Extended Data Fig. 5. Source data
Extended Data Fig. 6
Extended Data Fig. 6. Integration with human embryo data.
a. Violin plots with single cell expression distributions combined with boxplots in naive hiPSCs with and without PRC2i of pluripotency-associated genes. Data are visualized as log(nUMI). The boxplots show the interquartile range (box limits) and median (centre line) of gene expression levels. Number of single cells measured: n = 2,903 cells for the naive sample, and n = 3,338 cells for the naive + PRC2i sample. b. scRNA-seq analysis of pluripotency-associated and trophoblast-associated genes (UMAPs). Data are visualized as log normalized counts. Darker red intensity represents higher levels of gene expression, while lower red represents lower gene expression levels. c. scRNA-seq analysis showing the 20 most differentially expressed genes between the naive, intermediate and trophoblast cell clusters. Point size represents the proportion of cells in the cluster with the indicated gene expression enrichment. Data are visualized as average expression scale. Darker red intensity represents higher levels of gene expression, while softer red represents lower gene expression levels. d. Proportion of day 4 converted cells with intermediate cell identity. Purple indicates the day 4 trophoblast and red indicates the day 4 + PRC2i samples. e. Single-cell UMAP representation comparing in vitro day 4 trophoblast and day 4 trophoblast + PRC2i with human pre-implantation and postimplantation by data integration. Annotations from. f. Single-cell UMAP representation of pluripotency, trophoblast and primitive endoderm marker genes from data in e. Data are visualized as log normalized counts. Underlying source data is provided in Source Data Extended Data Fig. 6. Source data
Extended Data Fig. 7
Extended Data Fig. 7. Human blastoids.
a–b. Boxplots with the immunofluorescence quantification at 36 h (a) and 60 h (b) blastoids with or without PRC2i. Blastoids were stained for NANOG, GATA3 and FOXA2. The boxplots show the interquartile range (box limits) and median (centre line) of the total number of positive cells per blastoid (left panel). The right panel indicates the total number of cells per blastoid. N = 21 blastoids for 36 h -PRC2i blastoids; n = 23 blastoids for 36 h + PRC2i; n = 27 blastoids for 60 h -PRC2i; and n = 17 blastoids for 60 h + PRC2i, quantified from n = 1 experiment. A two-sided Wilcoxon rank-sum test with Bonferroni correction was used for significance testing. 36 h: ****P = 1 ×10⁻⁶; 60 h: ****P = 3.9 ×10⁻⁵, **P = 1.6 ×10⁻³. c. Close-up for average number of FOXA2 + cells as found in (b). N = 27 blastoids for -PRC2i, and n = 17 blastoids for +PRC2i, quantified from n = 1 experiment. PrEnd = Primitive Endoderm. d. Representative immunofluorescence images for Fig. 7c and Extended Data Fig. 7a-b. NANOG is shown in green, GATA3 in magenta and FOXA2 in yellow. Scale bar: 200 mm. The experiment was performed once. e. Immunofluorescence analysis of human blastoids with and without PRC2i. Cells were stained for AQP3 (white) and NANOG (green) after 24 h. Representative image from 1 experiment. Scale bar: 200 mm. f. Quantification of cavitated human blastoids after 36 and 60 h with and without PRC2i. N = 3 biologically independent samples. g. Quantification of immunofluorescence in naïve human pluripotent stem cells cultured in PXGL treated with PRC2i EPZ-6438 or UNC1999 for 7 days. Cells were stained for GATA3 and GATA4. The experiment was performed once. Underlying source data is provided in Source Data Extended Data Fig. 7. Source data

Comment in

References

    1. Rossant J. Investigation of the determinative state of the mouse inner cell mass. II. The fate of isolated inner cell masses transferred to the oviduct. J. Embryol. Exp. Morphol. 1975;33:991–1001. - PubMed
    1. De Paepe C, et al. Human trophectoderm cells are not yet committed. Hum. Reprod. 2012;28:740–749. doi: 10.1093/humrep/des432. - DOI - PubMed
    1. Petropoulos S, et al. Single-cell RNA-seq reveals lineage and X chromosome dynamics in human preimplantation embryos. Cell. 2016;165:1012–1026. doi: 10.1016/j.cell.2016.03.023. - DOI - PMC - PubMed
    1. Gerri C, et al. Initiation of a conserved trophectoderm program in human, cow and mouse embryos. Nature. 2020;587:443–447. doi: 10.1038/s41586-020-2759-x. - DOI - PMC - PubMed
    1. Meistermann D, et al. Integrated pseudotime analysis of human pre-implantation embryo single-cell transcriptomes reveals the dynamics of lineage specification. Cell Stem Cell. 2021;28:1625–1640. doi: 10.1016/j.stem.2021.04.027. - DOI - PubMed

Publication types

MeSH terms