. 2022 Sep;18(9):942-953.
doi: 10.1038/s41589-022-01047-x. Epub 2022 Jun 13.

MNK2 deficiency potentiates β-cell regeneration via translational regulation

Affiliations

MNK2 deficiency potentiates β-cell regeneration via translational regulation

Christos Karampelias et al. Nat Chem Biol. 2022 Sep.

Abstract

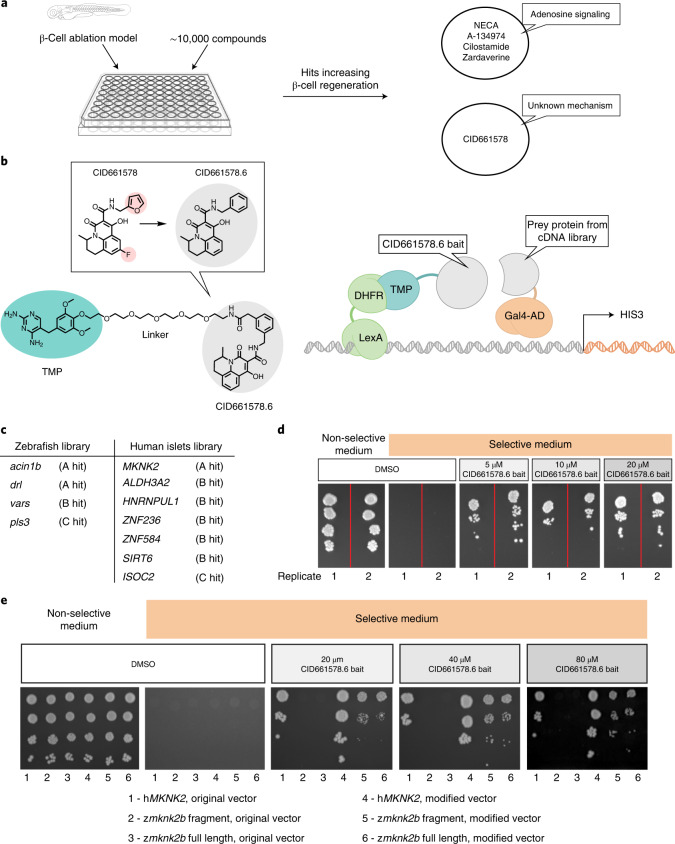
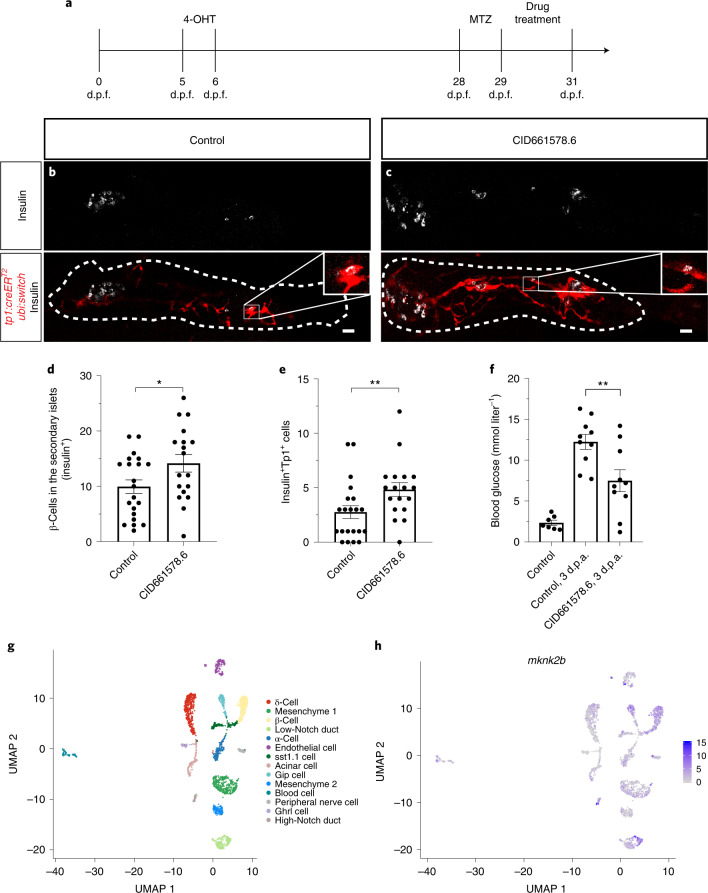
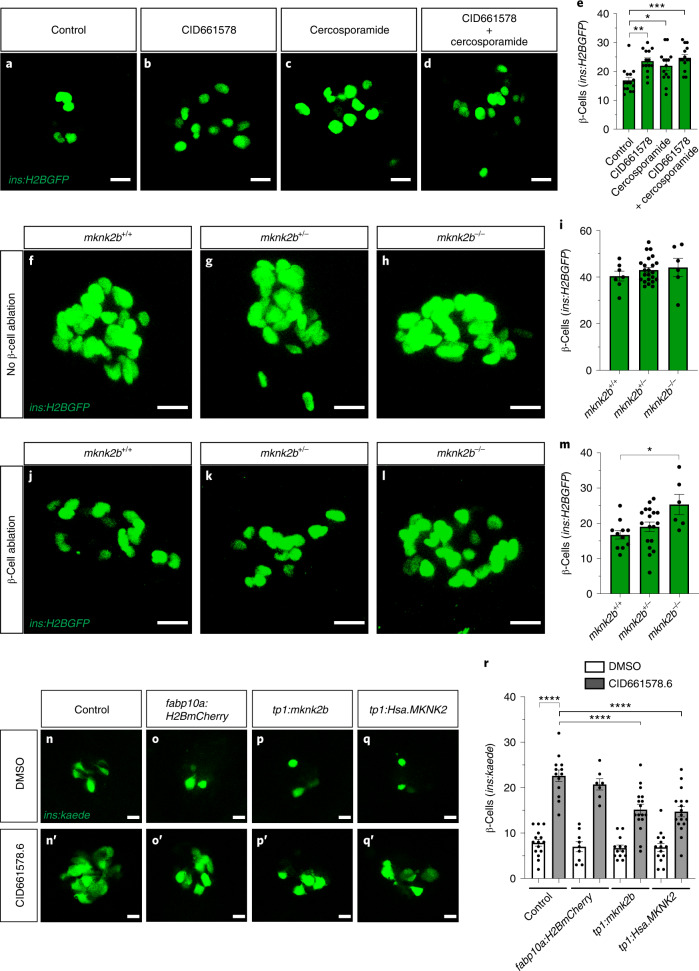
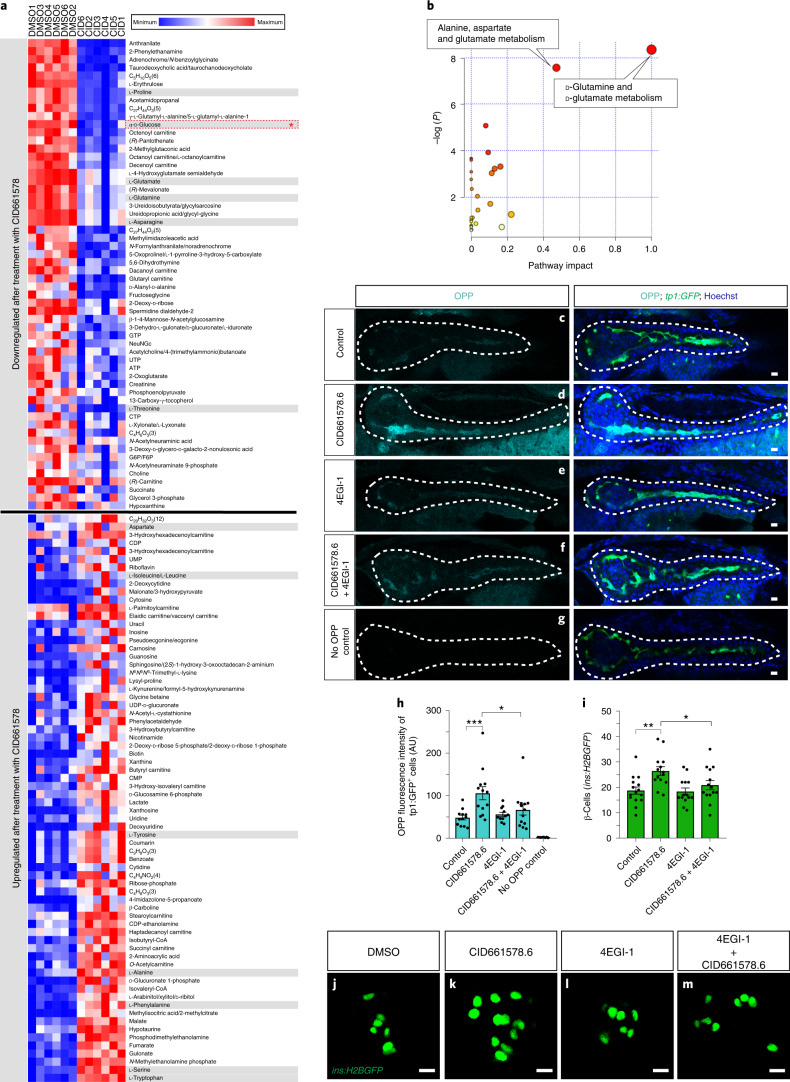
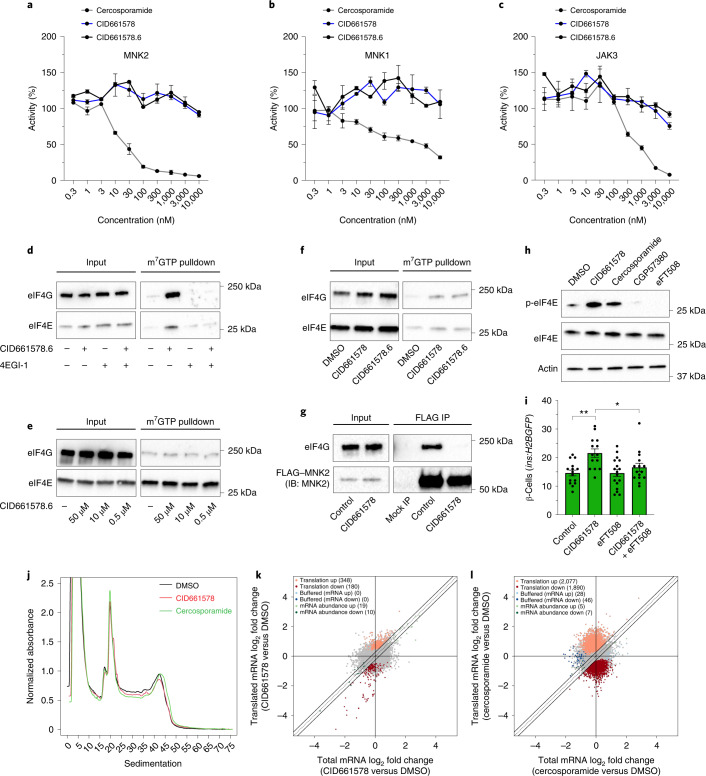
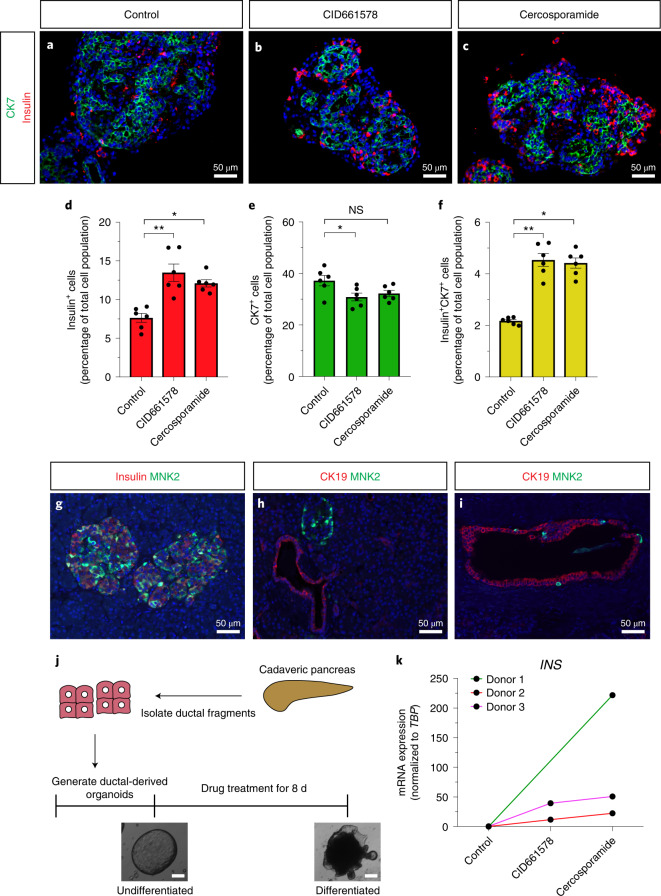
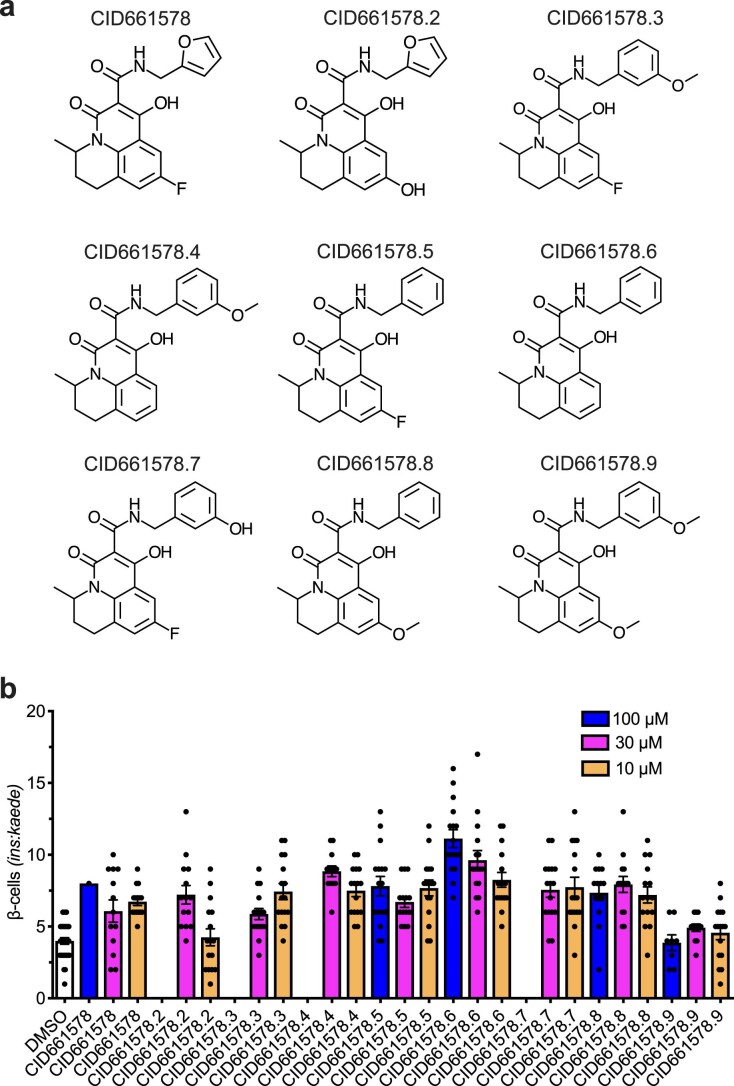
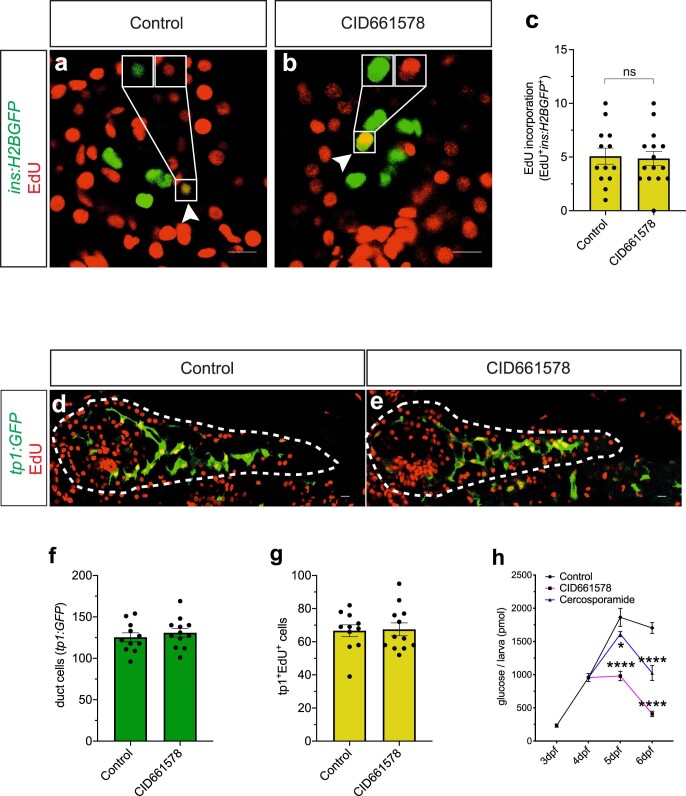
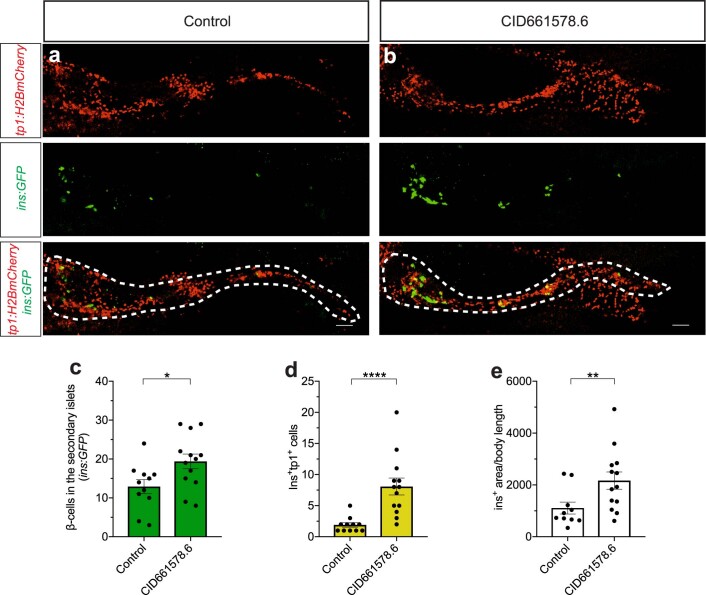
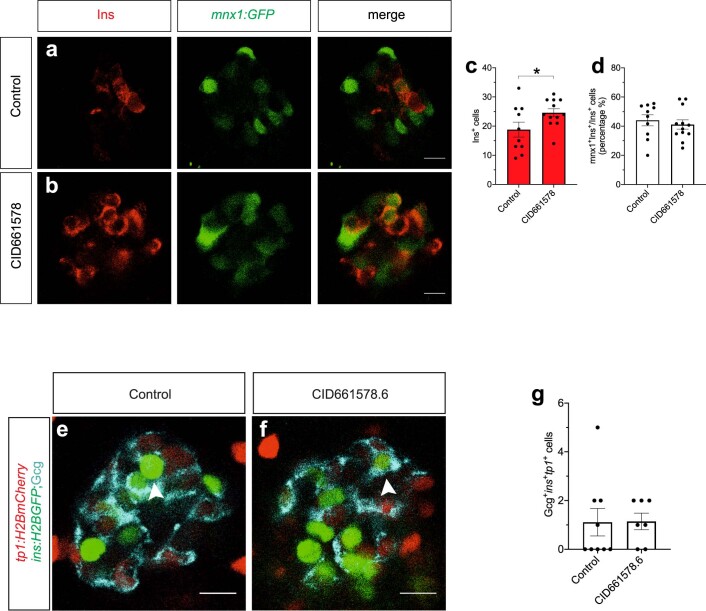
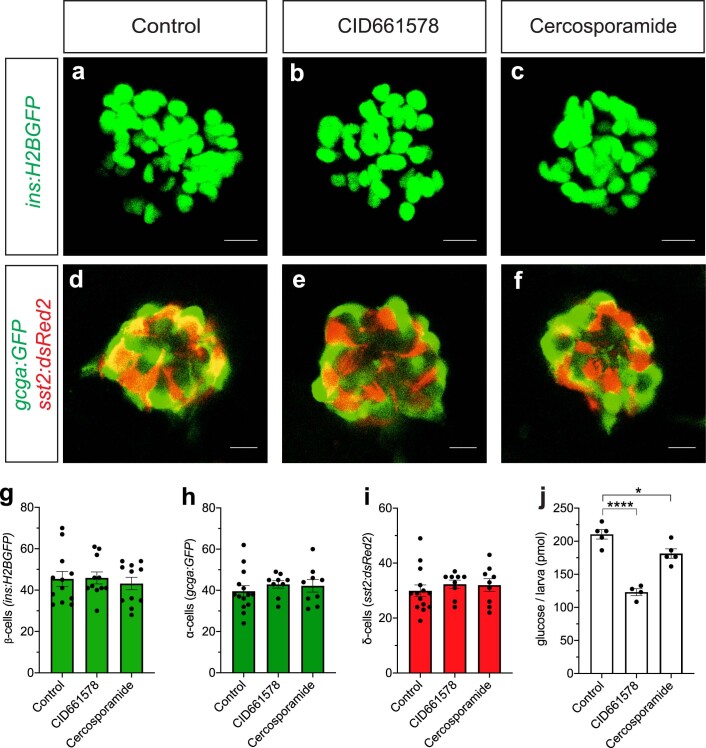
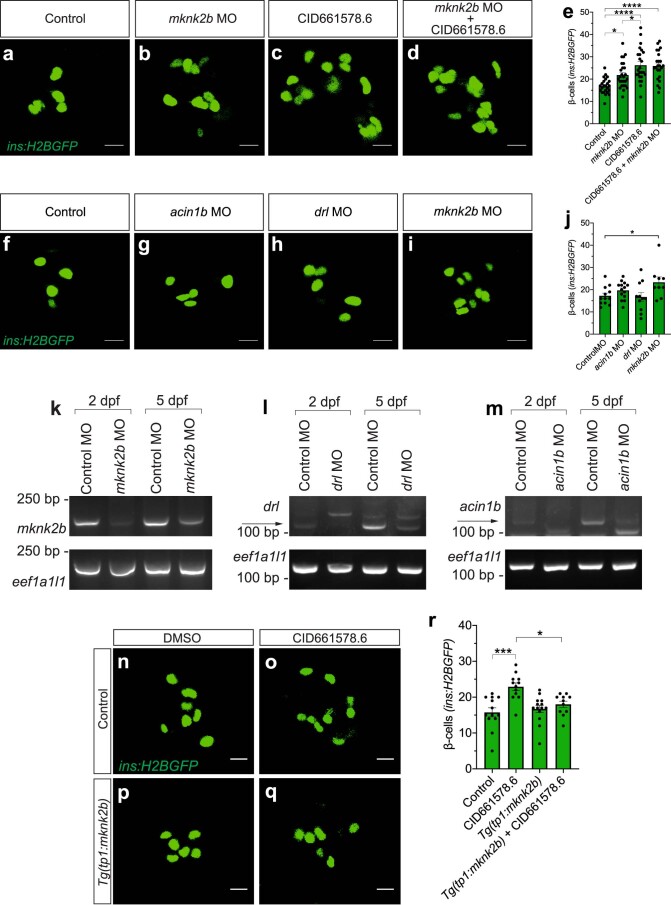
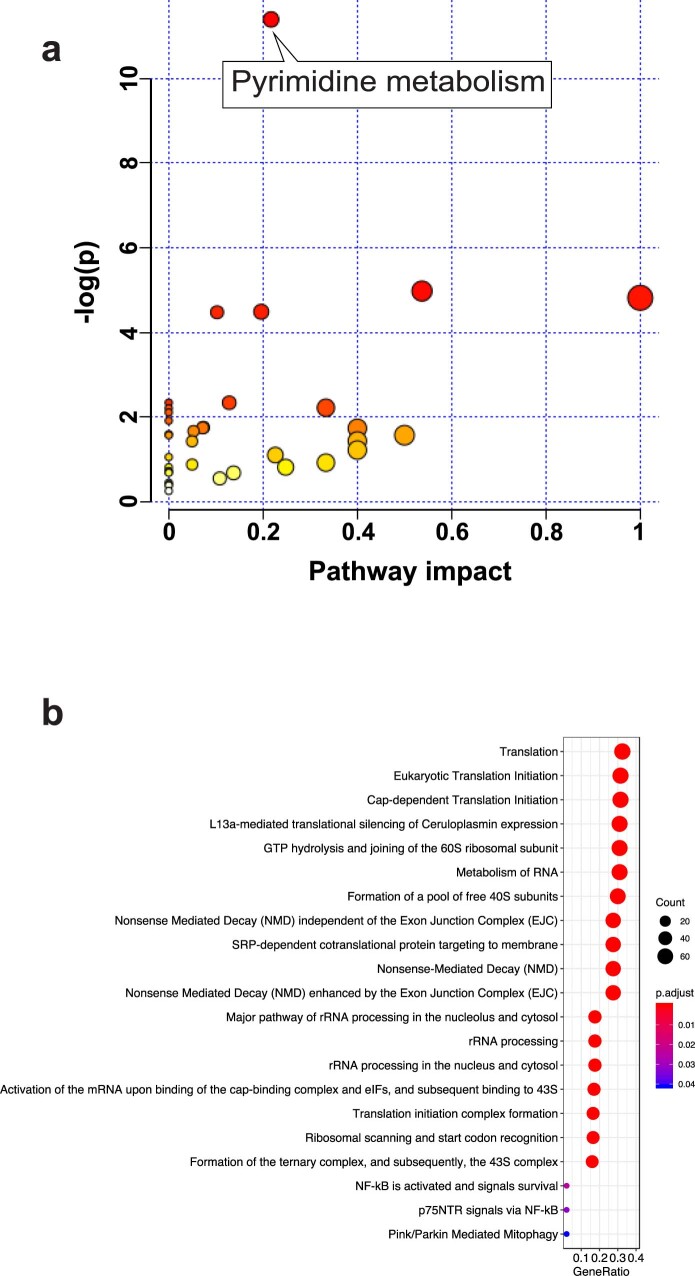
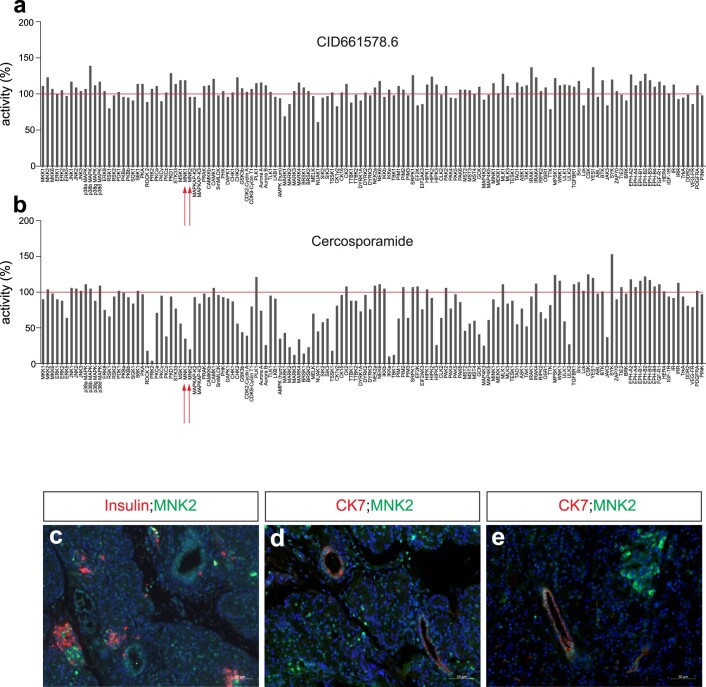
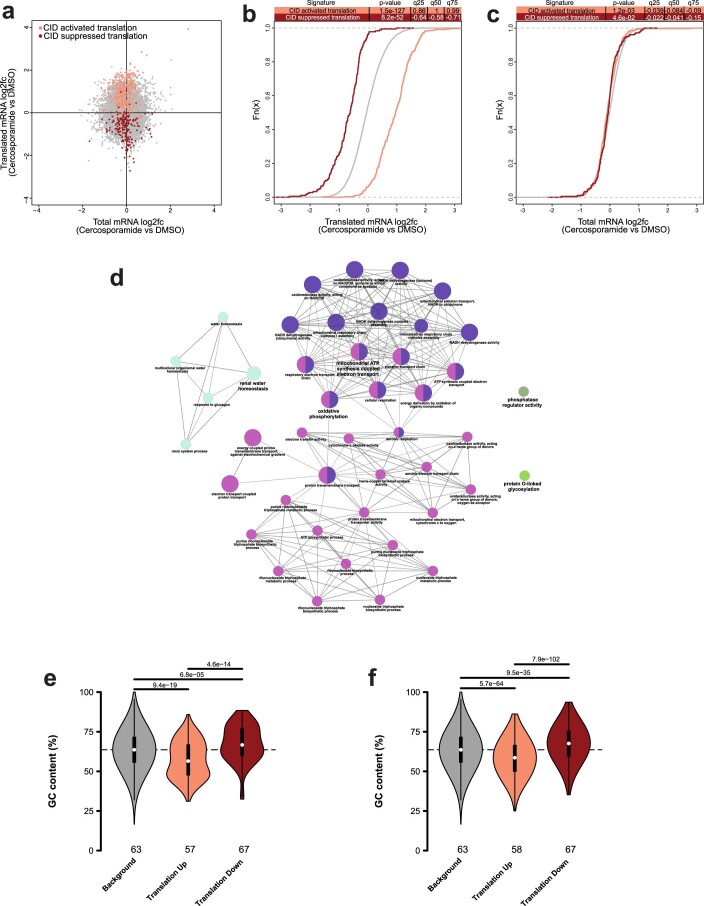
Regenerating pancreatic β-cells is a potential curative approach for diabetes. We previously identified the small molecule CID661578 as a potent inducer of β-cell regeneration, but its target and mechanism of action have remained unknown. We now screened 257 million yeast clones and determined that CID661578 targets MAP kinase-interacting serine/threonine kinase 2 (MNK2), an interaction we genetically validated in vivo. CID661578 increased β-cell neogenesis from ductal cells in zebrafish, neonatal pig islet aggregates and human pancreatic ductal organoids. Mechanistically, we found that CID661578 boosts protein synthesis and regeneration by blocking MNK2 from binding eIF4G in the translation initiation complex at the mRNA cap. Unexpectedly, this blocking activity augmented eIF4E phosphorylation depending on MNK1 and bolstered the interaction between eIF4E and eIF4G, which is necessary for both hypertranslation and β-cell regeneration. Taken together, our findings demonstrate a targetable role of MNK2-controlled translation in β-cell regeneration, a role that warrants further investigation in diabetes.


Conflict of interest statement

The authors declare no competing interests.

Figures

Fig. 1
Fig. 1. YChemH screen identifies MNK2 as the molecular target of CID661578.
a, Schema for the screening of compounds increasing β-cell regeneration using a transgenic zebrafish model for β-cell ablation and approximately 10,000 compounds. The hits included four compounds affecting adenosine signaling and CID661578 with an unknown mechanism. b, Schematic showing the structures of CID661578 and the analog CID661578.6 along with the screening strategy (YChemH). The red circles highlight the structures that were altered in CID661578. Survival of yeast on selective histidine-free medium was the output of the screen for clones expressing interactors of the CID661578.6 bait; TMP, trimethoprim; AD, activation domain. c, Table summarizing the top hits of the YChemH screen from the two cDNA libraries. The A-classified hits (drl and acin1b from the zebrafish embryo library and MKNK2 from the human islet library) have a higher probability of being true targets of CID661578.6 than B- and C-classified hits. d, Validation of the MNK2–CID661578.6 interaction with different concentrations of CID661578.6 bait and an MNK2-expressing yeast clone. DMSO demonstrates the sensitivity to the selective medium, and yeast clones did not survive in the selective histidine-free medium. The interaction between MNK2 and CID661578.6 promoted yeast survival, as illustrated by the multiple colonies at the four spots of inoculation (decreasing levels of inoculation from the top to the bottom). Each condition was tested in two replicates. e, Validation of the zebrafish Mnk2b–CID661578.6 interaction with different concentrations of CID661578.6 bait and two different DHFR hook vectors. Experiments using the original hook vector, N-LexA–DHFR-C, are listed as 1, 2 and 3. Experiments using the modified vector with the reverse order, N-DHFR–LexA-C, are listed as 4, 5 and 6. Both full-length zebrafish Mnk2b (3 and 6) and a fragment (2 and 4) corresponding to the original fragment of the human MNK2 identified in the screen were used. Human MNK2 was used as a positive control (1 and 4), and zebrafish Mnk2b only mediated binding when expressed by the hook vector with the reverse order (5 and 6) to the one used in the original screen (explaining why zebrafish Mnk2b did not show up as a hit in the original screen).
Fig. 2
Fig. 2. CID661578.6 increases β-cell regeneration from a pancreatic ductal origin and lowers glucose levels.
a, Schematic of the lineage tracing experiment. Briefly, larvae were treated with 4-hydroxytamoxifen (4-OHT) for 24 h (5-6 d.p.f.) to induce recombination of the reporter. At 28 d.p.f., the fish were treated with MTZ for 24 h to ablate the β-cells, followed by 48 h of treatment with DMSO or CID661578.6. be, Representative images of Tg(ubi:switch); Tg(tp1:creERT2); Tg(ins:flag-NTR) fish treated with DMSO (b) or 2 µM CID661578.6 (c) and immunostained for insulin at 31 d.p.f.; scale bars, 20 µm. Quantifications of the number of β-cells in the secondary islets along the tail of the pancreas (d) as well as the number of β-cells derived from Notch-responsive cells (e) are shown; n = 21 (control) and n = 18 (CID661578.6) for de. An unpaired two-tailed Student’s t-test was used to assess significance for d (*P = 0.0393), and a two-tailed Mann–Whitney test was used for e (**P = 0.0087). Data are presented as mean values ± s.e.m. The experiment shown in b and c was repeated twice with similar results. f, Blood glucose was measured 3 d post-β-cell ablation (d.p.a.) in 4-month-old fish treated with DMSO or CID661578.6. Blood glucose levels in zebrafish without β-cell ablation were included as a basal-state reference; n = 7 (control), n = 10 (control, 3 d.p.a.), n = 10 (CID661578.6, 3 d.p.a.). A one-way ANOVA followed by Šidák’s multiple comparisons test was used to assess significance for f (**P = 0.0078). Data are presented as mean values ± s.e.m. g,h, UMAP plots showing the different cell types present in the adult zebrafish pancreas after reanalysis of published single-cell RNA-seq data (g) and expression of mknk2b (h) at various levels in the different clusters. Source data
Fig. 3
Fig. 3. CID661578 targets Mnk2b in vivo to promote β-cell regeneration.
ae, Representative images of Tg(ins:H2BGFP); Tg(ins:flag-NTR) larvae treated with MTZ from 3 to 4 d.p.f. to ablate β-cells, followed by treatment with DMSO (a), 10 µM CID661578 (b), 500 nM cercosporamide (c) or a combination of drugs thereof (d) for 2 d; scale bars, 10 µm. Quantification of the regenerated β-cells is shown in e; n = 15 (control), n = 14 (CID661578), n = 14 (cercosporamide) and n = 14 (CID661578 + cercosporamide). A Kruskal–Wallis test followed by Dunn’s multiple comparisons test was used to assess significance for e (**P = 0.0027, *P = 0.0280 and *** P = 0.0003). Data are presented as mean values ± s.e.m. fi, Representative maximum projections of mknk2b+/+ (f), mknk2+/– (g) and mknk2b−/− (h) Tg(ins:H2BGFP); Tg(ins:flag-NTR) 6 d.p.f. larvae. Quantification of the β-cell number in the basal state for all genotypes is shown in i; scale bars, 10 µm; n = 7 (mknk2+/+), n = 23 (mknk2b+/–) and n = 6 (mknk2b–/–). Data are presented as mean values ± s.e.m. jm, Representative maximum projections of mknk2b+/+ (j), mknk2b+/– (k) and mknk2b–/– (l) Tg(ins:H2BGFP); Tg(ins:flag-NTR) 6 d.p.f. larvae following 2 d of β-cell regeneration. Quantification of the β-cell number for all genotypes is shown in m; scale bars, 10 µm; n = 11 (mknk2b+/+), n = 18 (mknk2b+/–) and n = 6 (mknk2b–/–). A Kruskal–Wallis test followed by Dunn’s multiple comparisons test was used to assess significance for m (*P = 0.0198). Data are presented as mean values ± s.e.m. nr, Single-plane confocal images of Tg(ins:H2BGFP); Tg(ins:flag-NTR) larvae treated with DMSO (nq) or CID661578.6 (n′q′) that were uninjected (n and n′) or injected at the one-cell stage with control fabp10a:H2BmCherry (o and o′), tp1:mknk2b (p and p′) or tp1:Hsa.MKNK2 (q and q′) vectors together with transposase mRNA to induce mosaic overexpression of the zebrafish Mnk2b or the human MNK2 in Notch-responsive cells. Quantification results revealed that overexpression of either mknk2b or MKNK2 significantly blocked the effect of CID661578.6 on β-cell regeneration (r); scale bars, 10 µm; n = 15 (control + DMSO), n = 13 (control + CID661578.6), n = 9 (fabp10a:H2BmCherry + DMSO), n = 7 (fabp10a:H2BmCherry + CID661578.6), n = 13 (tp1:mknk2b + DMSO), n = 17 (tp1:mknk2b + CID661578.6), n = 14 (tp1:Hsa.MKNK2 + DMSO) and n = 17 (tp1:Hsa.MKNK2 + CID661578.6). A one-way ANOVA followed by Tukey’s multiple comparisons test was used to assess significance for r (****P < 0.0001 for control + DMSO versus control + CID661578.6, control + CID661578.6 versus tp1:mknk2b + CID661578.6 and control + CID661578.6 versus tp1:Hsa.MKNK2 + CID661578.6). Data are presented as mean values ± s.e.m. Source data
Fig. 4
Fig. 4. CID661578 boosts protein synthesis to increase β-cell regeneration.
a, Heat map showing significantly downregulated and upregulated metabolites following treatment with CID661578 (t-test analyses). Pools of 10 wild-type larvae at 5 d.p.f. were used for each of the six independent biological replicates for DMSO (DMSO1–DMSO6) or CID661578 (CID1–CID6) treatment from 4 to 5 d.p.f. Gray shading highlights the amino acids regulated in the samples, and the red asterisk highlights the glucose metabolite. b, Pathway analysis assessing 81 characterized metabolic pathways in zebrafish using the significantly downregulated metabolites. Boxes show the most significantly affected pathways (false discovery rate < 0.05) following treatment with CID661578. ch, Single-plane confocal images of Tg(tp1:GFP); Tg(ins:flag-NTR) pancreata from 5 d.p.f. larvae incubated with OPP for 18 h to label protein synthesis during treatment with DMSO (c), CID661578.6 (d), 4EGI-1 (e) or CID661578.6 together with 4EGI-1 (f). Larvae that were not incubated with OPP but were developed to visualize the fluorophore (g) were used as controls to assess background staining. White dashed lines outline the pancreata of the larvae. Quantification of the OPP fluorescence intensity levels in the Notch-responsive cells is shown in h; scale bars, 10 µm; n = 12 (control), n = 13 (CID661578.6), n = 11 (4EGI-1), n = 13 (CID661578.6 + 4EGI-1) and n = 8 (no OPP control); AU, arbitrary units. A one-way ANOVA followed by Šidák’s multiple comparisons test was used to assess significance for h (***P = 0.0004 and *P = 0.0151). Data are presented as mean values ± s.e.m. im, Representative images of Tg(ins:H2BGFP); Tg(ins:flag-NTR) larvae treated with DMSO (j), CID661578.6 (k), 4EGI-1 (l) or CID661578.6 together with 4EGI-1 (m) for 2 d following β-cell ablation. Quantification of the number of β-cells (i) showed that 4EGI-1 treatment could abolish the effect of CID661578.6 on β-cell regeneration; scale bars, 10 µm; n = 15 (control), n = 14 (CID661578.6), n = 14 (4EGI-1) and n = 14 (CID661578.6 + 4EGI-1). A one-way ANOVA followed by Šidák’s multiple comparisons test was used to assess significance for i (**P = 0.0022 and *P = 0.0341). Data are presented as mean values ± s.e.m. Source data
Fig. 5
Fig. 5. CID661578 increases the interaction between eIF4G and eIF4E and leads to translational changes, without affecting the kinase activity of MNK2.
ac, Dose–response of CID661578, CID661578.6 or cercosporamide on MNK2 (a), MNK1 (b) and JAK3 (c) kinase activity in vitro; n = 2 for each concentration tested. Data are presented as mean values ± s.e.m. d, Immunoblotting against eIF4G and eIF4E after an m7GTP pulldown assay in lysates of COLO 320HSR cells after 6-h treatment with DMSO, CID661578.6, 4EGI-1 or CID661578.6 together with 4EGI-1. For a loading control, 5% of the input was used. e, Immunoblotting against eIF4G and eIF4E after an m7GTP pulldown assay in rabbit reticulocytes treated with the indicated concentrations of CID661578.6. f, Immunoblotting against eIF4G and eIF4E after an m7GTP pulldown assay in lysates of PANC-1 cells treated with DMSO, CID661578 or CID661578.6 for 6 h. For a loading control, 1% of the input was used. g, Immunoblotting against eIF4G and FLAG–MNK2 after an immunoprecipitation (IP) assay with anti-FLAG in lysates of PANC-1 cells that were treated for 6 h with DMSO or CID661578. For a loading control, 1% of the input was used; IB, immunoblot. h, Immunoblotting against phospho-eIF4E (Ser 209; p-eIF4E), total eIF4E and actin in lysates of PANC-1 cells after 6-h treatment with DMSO, CID661578, cercosporamide, CGP57380 or eFT508. i, Quantification of the number of β-cells in 6 d.p.f. zebrafish larvae following β-cell ablation and treatment for 48 h with DMSO, CID661578, eFT508 or a combination of CID661578 and eFT508; n = 15 (control), n = 14 (CID661578), n = 17 (eFT508) and n = 15 (CID661578.6 + eFT508). A one-way ANOVA followed by Dunnett’s multiple comparisons test was used to assess significance for i (**P = 0.0014 (control versus CID661578) and *P = 0.0283 (CID661578 versus CID661579 + eFT508)). Data are presented as mean values ± s.e.m. Experiments in dh were repeated at least two times. j, Representative polysome tracings from optimized sucrose gradients of PANC-1 cells treated with DMSO, CID661578 or cercosporamide. k,l, Scatter plots showing log2 fold changes for total mRNA (x axis) and polysome-associated mRNA (y axis) for the comparisons of CID661578 (k) and cercosporamide (l) to DMSO. Color codes indicate significantly affected mRNAs identified by anota2seq analysis. Source data
Fig. 6
Fig. 6. CID661578/cercosporamide treatment increases β-cell differentiation in ductal cells from neonatal pigs and human organoids.
af, Images of neonatal pig islets treated with DMSO (a), CID661578 (b) or cercosporamide (c) and stained for insulin (red) and the ductal cell marker CK7 (green). Quantification results showed that treatment with either CID661578 or cercosporamide increased the number of insulin+ β-cells (d), decreased the number of CK7+ duct cells (e) and increased the number of double-positive (insulin+CK7+) cells (f); n = 6; **P = 0.0041 and *P = 0.0116 (d); *P = 0.0401 and P = 0.1671 (NS, not significant) (e); **P = 0.0034 and *P = 0.0137 (f). A Kruskal–Wallis test followed by Dunn’s multiple comparisons test was used to assess significance for df. Data are presented as mean values ± s.e.m. gi, Images of human pancreatic sections from different donors stained for MNK2, with insulin used as a marker of β-cells and CK19 used to mark the pancreatic duct. Similar results have been reproduced in stainings from pancreatic sections of multiple human donors. j,k, Schema showing the procedure for generating and treating human ductal-derived organoids (j). Brightfield images of representative examples of human ductal-derived organoids before differentiation and after treatment with cercosporamide are shown; scale bar, 200 µm. INS mRNA expression is shown in k for three different organoid preparations (that is, from three different donors) for cercosporamide and two for CID661578. The experiment was reproducible in at least two different organoid preparations. Source data
Extended Data Fig. 1
Extended Data Fig. 1. Effect of different analogues of CID661578 on β-cell regeneration.
a, Chemical structures of the different analogues of CID661578 synthesized for the screen. b, Quantification of the number of regenerating β-cells in Tg(ins:kaede);Tg(ins:CFP-NTR) treated with the indicated analogue, tested in three different concentrations from 4-6 dpf after β-cell ablation. The absence of bars denote that the chemical treatment was toxic to the larvae. n = 32 (DMSO), n = 1 (CID661578-100 µM), n = 13 (CID661578-30 µM), n = 15 (CID661578-10 µM), n = 0 (CID661578.2-100 µM), n = 14 (CID661578.2-30 µM), n = 16 (CID661578.2-10 µM), n = 0 (CID661578.3-100 µM), n = 16 (CID661578.3-30 µM), n = 16 (CID661578.3-10 µM), n = 0 (CID661578.4-100 µM), n = 13 (CID661578.4-30 µM), n = 16 (CID661578.4-10 µM), n = 16 (CID661578.5-100 µM), n = 14 (CID661578.5-30 µM), n = 16 (CID661578.5-10 µM), n = 16 (CID661578.6-100 µM), n = 16 (CID661578.6-30 µM), n = 16 (CID661578.6-10 µM), n = 0 (CID661578.7-100 µM), n = 16 (CID661578.7-30 µM), n = 16 (CID661578.7-10 µM), n = 14 (CID661578.8-100 µM), n = 14 (CID661578.8-30 µM), n = 15 (CID661578.8-10 µM), n = 8 (CID661578.9-100 µM), n = 12 (CID661578.9-30 µM) and n = 16 (CID661578.9-10 µM). Data are presented as mean values ±SEM. Source data
Extended Data Fig. 2
Extended Data Fig. 2. CID661578 does not induce β- or ductal-cell proliferation.
a-c, Representative confocal images of Tg(ins:H2BGFP);Tg(ins:flag-NTR) larvae at 6 dpf after β-cell ablation (3-4 dpf) and incubation with EdU together with DMSO (a) or 5 µM CID661578 (b) during the regenerative period (4-6 dpf). β-cells that proliferated are marked by EdU and displayed as yellow overlap (arrowheads). The number of β-cells that proliferated was not altered by CID661578 (c). Scale bar, 10 µm. n = 13 (Control) and n = 15 (CID661578). Unpaired two-tailed Student’s t test was used to assess significance for (c) ns=not significant (P = 0.8340). Data are presented as mean values ±SEM. The experiment shown in (a-b) has been repeated two times with similar results. d-g, CID661578 treatment does not alter the number or the proliferation of notch-responsive ductal cells. Confocal images of DMSO- (d) or CID661578-treated (e) Tg(tp1:GFP);Tg(ins:flag-NTR) larvae at 6 dpf after β-cell ablation and incubation with EdU. White dashed lines outline the pancreata of the larvae. Scale bar, 10 µm. Quantification of the number of notch-responsive cells (f) and the number of proliferating, EdU+ notch-responsive ductal cells (g) per larva is shown. n = 11 (Control) and n = 12 (CID661578). Data are presented as mean values ±SEM. h, Glucose levels of Tg(ins:flag-NTR) larvae treated with DMSO, cercosporamide or CID661578 during the regenerative period (4-6 dpf). Four larvae were pooled for each replicate. n = 4 (all treatments – 3 dpf), n = 5 (all treatments – 4 dpf) n = 5 (all treatments – 5 dpf), n = 4 (Control and Cercosporamide – 6 dpf) and n = 4 (CID661578– 6 dpf). 2way ANOVA test followed by Tukey’s multiple comparisons test was used to assess significance for *P = 0.0430 (5 dpf Control vs Cercosporamide), ****P < 0.0001 (5 dpf Control vs CID661578), ****P < 0.0001 (6 dpf Control vs CID661578) and ****P < 0.0001 (6 dpf Control vs Cercosporamide). Data are presented as mean values ±SEM. Source data
Extended Data Fig. 3
Extended Data Fig. 3. Validation of the notch-responsive cells as the source of the newly formed β-cells in juvenile fish.
a-e, CID661578.6 promotes β-cell neogenesis in juvenile fish. Single-plane confocal images of Tg(ins:GFP);Tg(tp1:H2BmCherry);Tg(ins:flag-NTR) pancreata from 1-month-old zebrafish treated with DMSO (a) or CID661578.6 (b). Briefly, 1-month-old zebrafish were incubated with MTZ (1 mM) for 24 hours to ablate β-cells followed by chemical treatment for 2 days. Pancreata are outlined with white dashed lines. Quantification of β-cells in the secondary islets in the tail of the pancreas (c) shows an increase in β-cell regeneration, and quantification of the overlap between the notch-responsive cell tracer and β-cell marker demonstrated an increase in the number of β-cells derived from notch-responsive cells (d). CID661578.6 treatment also doubled the ins+ area normalized to the body length of the fish (μm2/mm) (e). Scale bar, 50 µm. (c and d), n = 11 (Control) and n = 13 (CID661578.6); (e), n = 10 (Control) and n = 13 (CID661578.6). Unpaired two-tailed Student’s t test was used to assess significance for (c) *P = 0.0229; two-tailed Mann-Whitney test was used for (d) ****P < 0.0001; two-tailed Mann-Whitney test was used for (e) **P = 0.0099. Data are presented as mean values ±SEM. Source data
Extended Data Fig. 4
Extended Data Fig. 4. Newly-derived β-cells express mnx1, another marker for β-cell identity/maturation, and are devoid of glucagon expression.
a-d, Single-plane confocal images of 6 dpf Tg(mnx1:GFP);Tg(ins:flag-NTR) larvae treated with DMSO (a) or CID661578 (b) (4-6 dpf) after β-cell ablation (3-4 dpf) and staining for insulin. Quantification results showed that CID661578 treatment increased the number of β-cells (c), but there was no difference in the percentage of mnx1:GFP+, insulin+ β-cells (d). Scale bar, 10 µm. For (c and d) n = 10 (Control) and n = 12 (CID661578). Unpaired two-tailed Student’s t test was used to assess significance for (c) *P = 0.0497. Data are presented as mean values ±SEM. e-g, Representative confocal images of 6 dpf Tg(ins:H2BGFP);Tg(tp1:H2BmCherry);Tg(ins:flag-NTR) larvae treated with DMSO (e) or CID661578.6 (f) (4-6 dpf) after β-cell ablation (3-4 dpf) and stained for glucagon. White arrowheads point to bihormonal cells (glucagon+, ins:H2BGFP+) derived from notch-responsive cells. Quantification of bihormonal cells derived from notch-responsive cells (g) showed no difference between treatments. Scale bar, 10 µm. n = 9 (Control) and n = 7 (CID661578.6). Data are presented as mean values ±SEM. Source data
Extended Data Fig. 5
Extended Data Fig. 5. Gene expression of the primary pancreatic lineage genes in the single-cell RNA-Seq dataset.
a-f, UMAPs showing the expression of amy2a (acinar cells) (a), cftr (ductal cells) (b), ins (β-cells) (c), gcga (α-cells) (d), sst2 (δ-cells) (e) and sst1.1 (f) in the dataset used to analyze mknk2b expression in adult zebrafish pancreata.
Extended Data Fig. 6
Extended Data Fig. 6. CID661578-treated zebrafish in the basal state exhibit no changes in endocrine cell numbers.
a-c,g, Maximum projections confocal images of primary islets in Tg(ins:H2BGFP) larvae at 6 dpf after treatment with (a) DMSO, (b) CID661578 or (c) cercosporamide from 3-6 dpf. Quantification (g) of the total number of β-cells revealed no changes resulting from the treatments. Scale bar, 10 µm. n = 12 (Control), n = 11 (CID661578) and n = 11 (Cercosporamide). Data are presented as mean values ±SEM. d-f,h-i, Single-plane confocal images of primary islets in Tg(gcga:GFP);Tg(sst2:dsRed2) larvae at 6 dpf after treatment with (d) DMSO, (e) CID661578 or (f) cercosporamide from 3-6 dpf. Quantification of the total number of α-cells (h) and δ-cells (i) revealed no changes resulting from the treatments. Scale bar, 10 µm. For both (h and i), n = 14 (Control), n = 9 (CID661578) and n = 9 (Cercosporamide). Data are presented as mean values ±SEM. j, Glucose measurements in zebrafish larvae in the basal state treated with DMSO, CID661578 or cercosporamide for 1 day (3-4 dpf). Four larvae were pooled for each replicate. n = 5 (Control), n = 4 (CID661578) and n = 5 (Cercosporamide). One-way ANOVA test followed by Dunnett’s multiple comparisons test was used to assess significance for (j) ****P < 0.0001 (Control vs CID661578); *P = 0.0182 (Control vs Cercosporamide). Source data
Extended Data Fig. 7
Extended Data Fig. 7. Morpholino-mediated knockdown of the A-hits from the yeast screen show that mknk2b, but not acin1b and drl, affects β-cell regeneration.
a-e, Tg(ins:H2BGFP);Tg(ins:flag-NTR) embryos were injected at the 1-cell stage with a control morpholino (a,c) or a morpholino against mknk2b (b,d), β-cells ablated between 2-3 dpf, and treated with DMSO (a,b) or 2 µM CID661578.6 (c,d) for 2 days. Quantification of regenerated β-cells (e) revealed an increase upon mknk2b knockdown, similar to the chemical inhibition of Mnk2. No additive effect was observed with the combined mknk2b MO and CID661578.6 treatment. Scale bar, 10 µm. n = 24 (Control), n = 26 (mknk2b MO), n = 24 (CID661578.6) and n = 23 (mknk2b MO + CID661578.6). *P = 0.0210 (control vs mknk2b MO) and 0.0459 (mknk2b MO vs CID661578.6), ****P < 0.0001. Data in this graph are pooled from two independent experiments and are presented as mean values ±SEM. f-j, Confocal images of primary islets of Tg(ins:H2BGFP);Tg(ins:flag-NTR) at 5 dpf, after injection at the one-cell stage with control (f), acin1b (g), drl (h) or mknk2b (i) morpholinos. Following the ablation of β-cells, only mknk2b knockdown significantly increased β-cell regeneration (j). Scale bar, 10 µm. n = 12 (Control MO), n = 14 (acin1b MO), n = 11 (drl MO) and n = 9 (mknk2b MO). (j) *P = 0.0410. Data are presented as mean values ±SEM. k-m, Agarose gel images of RT-qPCR validating the knockdown of mknk2b (k), drl (l) and acin1b (m) at two stages (2 dpf and 5 dpf). Amplification of eef1a1l1 was used as control. Arrows point to the band of the expected size. The experiment shown in (k-m) has been repeated twice with similar results. n-r, Single-plane confocal images of Tg(ins:H2BGFP);Tg(ins:flag-NTR) islets from control (n and o) or larvae overexpressing mknk2b in notch-responsive cells (p and q), treated with DMSO (n and p) or CID661578.6 (o and q). Quantification results (r) showed that the stable Tg(tp1:mknk2b) overexpression blocked the effect of CID661578.6 on β-cell regeneration, similar to that observed in the transient overexpression model (see Fig. 3). Scale bar, 10 µm. n = 13 (Control), n = 12 (CID661578.6), n = 14 (Tg(tp1:mknk2b)) and n = 11 (Tg(tp1:mknk2b)+CID661578.6). (r)***P = 0.0001 and *P = 0.0172. Data are presented as mean values ±SEM. Source data
Extended Data Fig. 8
Extended Data Fig. 8. Enrichment analysis for the upregulated metabolites and differentially expressed genes in the single-cell RNA-Seq data.
a, Pathway analysis, assessing 81 characterized metabolic pathways in zebrafish, using the significantly upregulated metabolites. Only pyrimidine metabolism was significantly enriched in this dataset (FDR < 0.05). b, Enrichment analysis for KEGG pathways in differentially expressed genes, that is, genes upregulated in ductal cells (‘low-notch’ cluster, see Fig. 2g) compared to all endocrine cells.
Extended Data Fig. 9
Extended Data Fig. 9. CID661578.6 does not potently affect the activity of any kinase in an in vitro screen; and MNK2 expression in the pig pancreas.
a,b, An in vitro screen to assess the specificity of 1 µM CID661578.6 and 1 µM cercosporamide against a panel of 140 kinases. CID661578.6 did not alter the activity of any kinase by more than 50% (a), while cercosporamide inhibited the activity of several kinases, including MNK1 and MNK2 (b). Red arrows point to MNK1 and MNK2. c-e, Images of neonatal (c,d) and adult (e) pig pancreatic sections immunostained for MNK2, with insulin used as a marker of β-cells and CK7 as a marker of ductal cells. Scale bar, 50 µm. Similar staining results were obtained in sections from multiple pig pancreata. Source data
Extended Data Fig. 10
Extended Data Fig. 10. Polysome profiling expands on the effects and similarities between CID661578 and cercosporamide treatments on PANC-1 cells.
a, Scatterplot indicating that genes translationally regulated by CID661578 are similarly regulated by treatment with cercosporamide. b,c, Empirical cumulative distributions of log2 fold changes for polysome-associated (translated) and total mRNA when comparing cercosporamide and DMSO treatments. Transcripts whose translation was suppressed (dark red) or activated (light red) by CID661578 differed from background (grey) and showed a similar directionality following cercosporamide treatment. P-values (Wilcoxon test) comparing each set to background mRNAs and shifts (log2) relative to background transcripts at multiple quartiles are also shown. d, Significantly enriched GO terms among proteins encoded by mRNAs that were hypotranslated upon both CID661578 and cercosporamide treatments relative to DMSO. e,f, Violin plots showing the 5’UTR GC percentage among transcripts translationally activated or suppressed following CID661578 (e) or cercosporamide (f) treatment. The background (grey; that is mRNAs not in regulated subsets) is also shown together with P-values from two-sided Wilcoxon Rank Sum test for the indicated comparisons. For (e): (background) n = 9853, minima:16,7;maxima:100;centre:63,6;upper bound:95,4;lower bound:32;25th per:55,7;75th per:71,6; (translation up) n = 319, minima:31,1;maxima:85,9;centre:56,5;upper bound:85,9;lower bound:31,1;25th per:47,7;75th per:66,8; (translation down) n = 127, minima:32,5;maxima:88,4;centre:66,7;upper bound:88,4;lower bound:33,9;25th per:59,8;75th per:77. For (f): (background) n = 9853, minima:16,7;maxima:100;centre:63,6;upper bound:95,4;lower bound:32;25th per:55,7;75th per:71,6; (translation up) n = 1850, minima:25;maxima:86,2;centre:58,6;upper bound:86,3;lower bound:25,3;25th per:50;75th per:66,5; (translation down) n = 1468, minima:35,2;maxima:93,7;centre:67,6;upper bound:93,7;lower bound:35,8;25th per:59,6;75th per:75,4. Source data

References

    1. Ackermann AM, Gannon M. Molecular regulation of pancreatic β-cell mass development, maintenance, and expansion. J. Mol. Endocrinol. 2007;38:193–206. - PubMed
    1. Yu PB, et al. Dorsomorphin inhibits BMP signals required for embryogenesis and iron metabolism. Nat. Chem. Biol. 2008;4:33–41. - PMC - PubMed
    1. North TE, et al. Prostaglandin E2 regulates vertebrate haematopoietic stem cell homeostasis. Nature. 2007;447:1007–1011. - PMC - PubMed
    1. Andersson O, et al. Adenosine signaling promotes regeneration of pancreatic β-cells in vivo. Cell Metab. 2012;15:885–894. - PMC - PubMed
    1. Tsuji N, et al. Whole organism high content screening identifies stimulators of pancreatic β-cell proliferation. PLoS ONE. 2014;9:e104112. - PMC - PubMed

Publication types

MeSH terms

Substances