. 2022 Nov;40(11):1624-1633.
doi: 10.1038/s41587-022-01342-x. Epub 2022 Jun 13.

Estimation of tumor cell total mRNA expression in 15 cancer types predicts disease progression

Affiliations

Estimation of tumor cell total mRNA expression in 15 cancer types predicts disease progression

Shaolong Cao et al. Nat Biotechnol. 2022 Nov.

Abstract

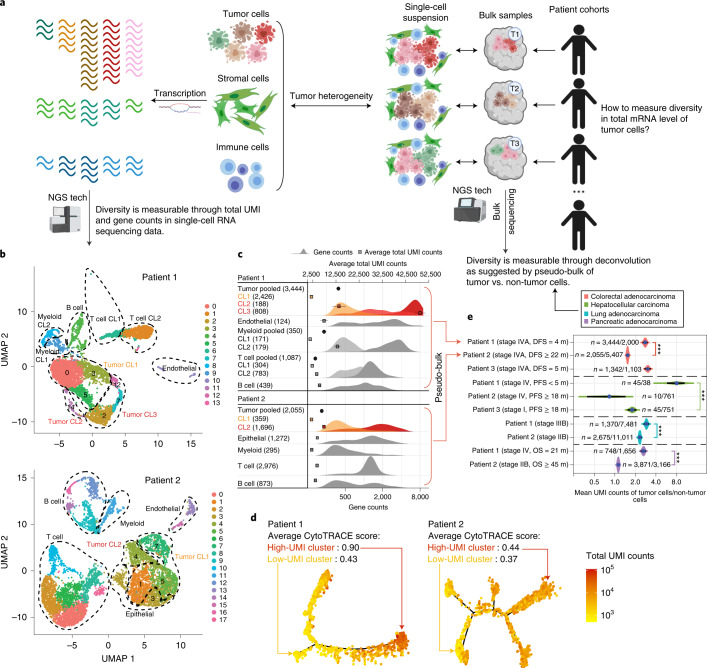
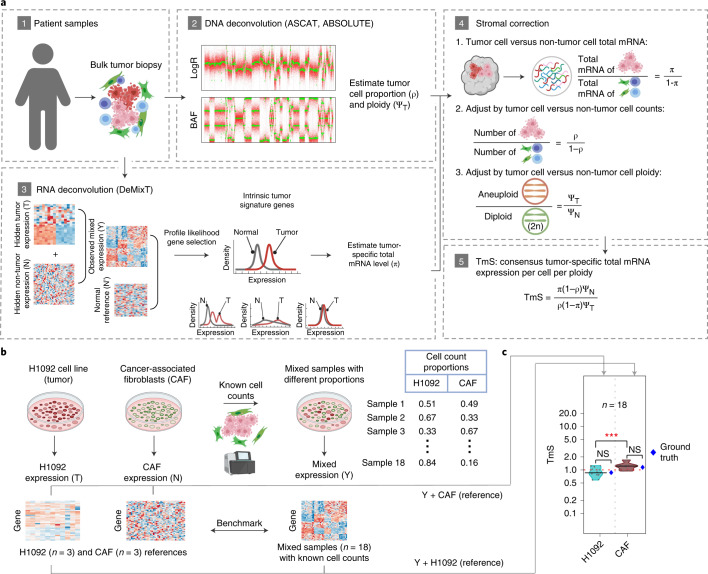
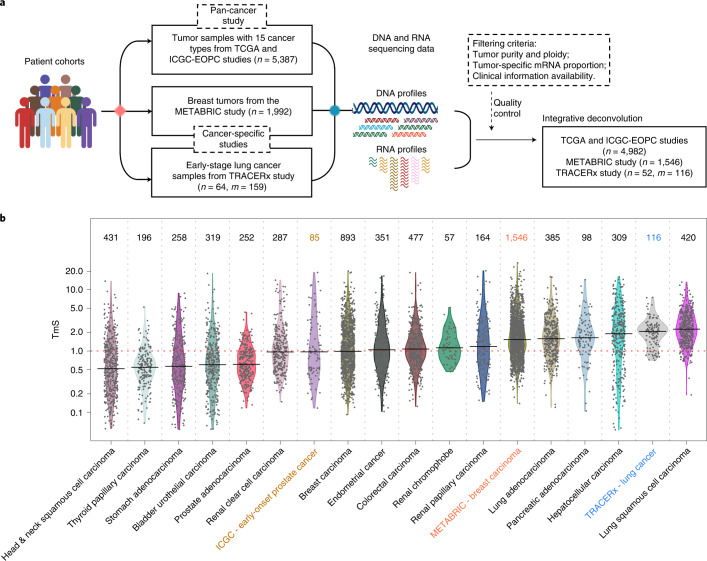
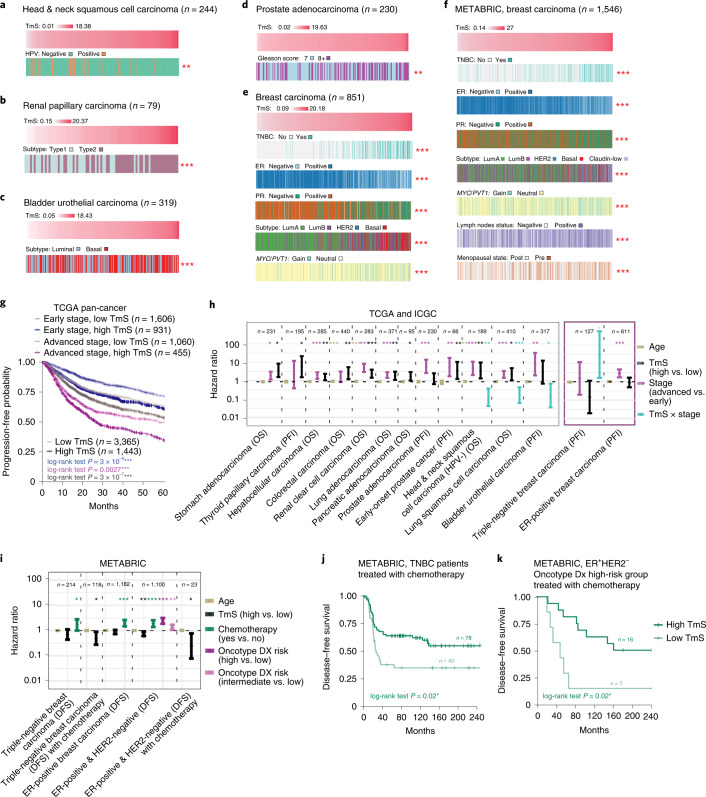
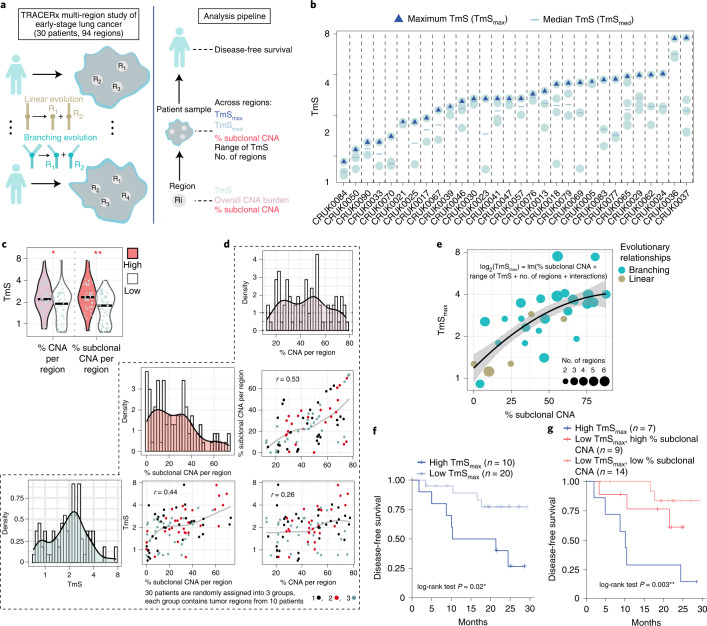
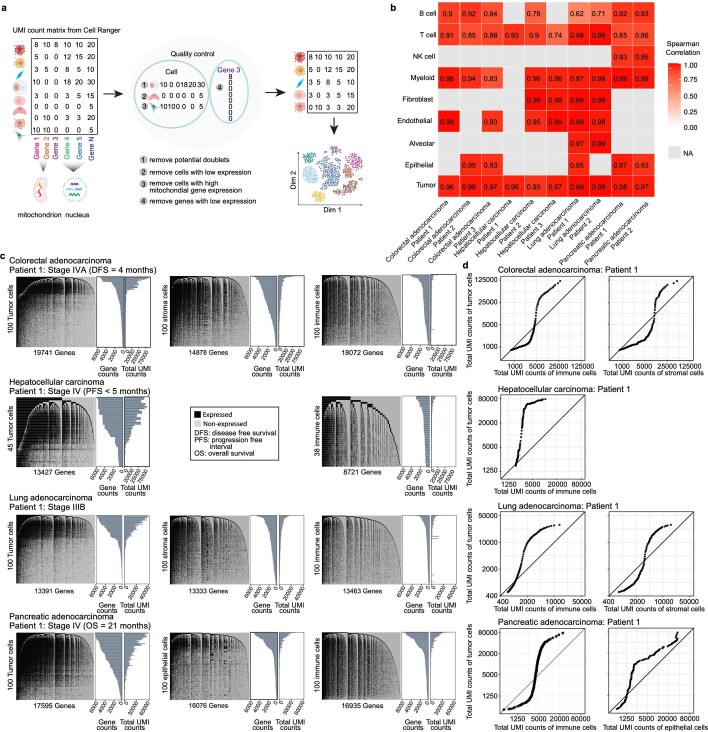
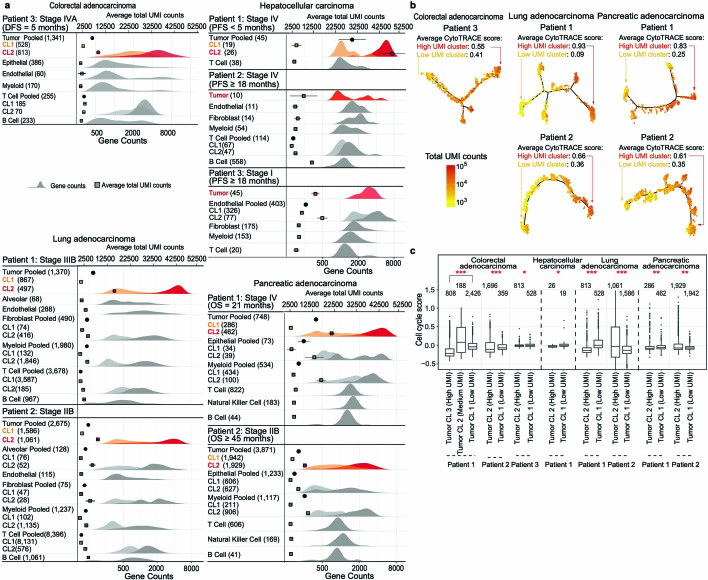
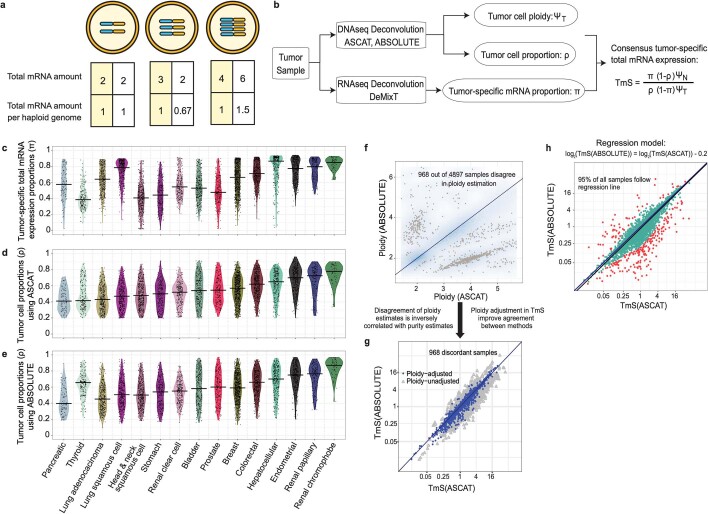
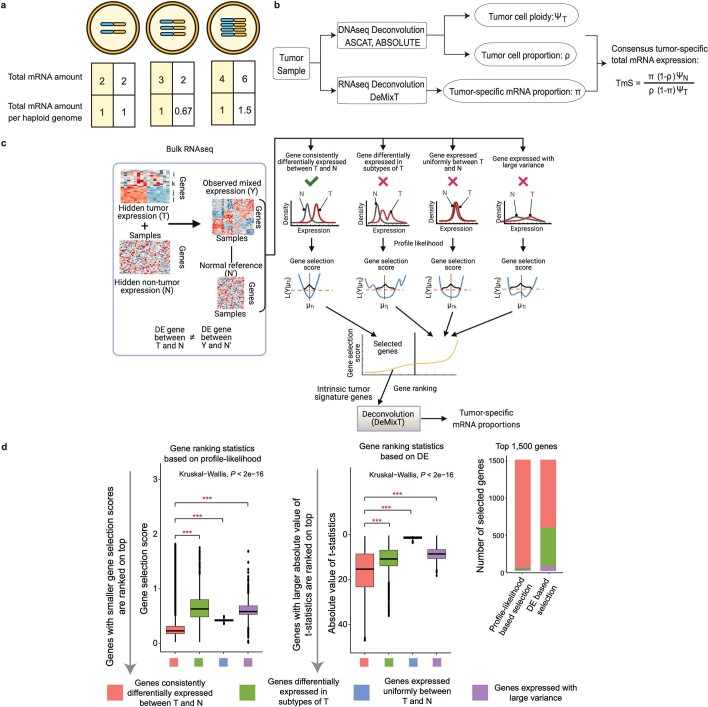
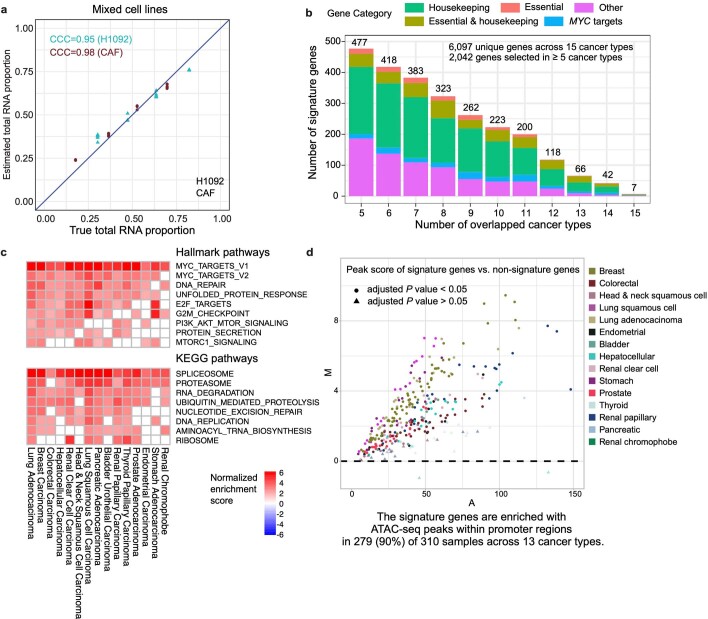
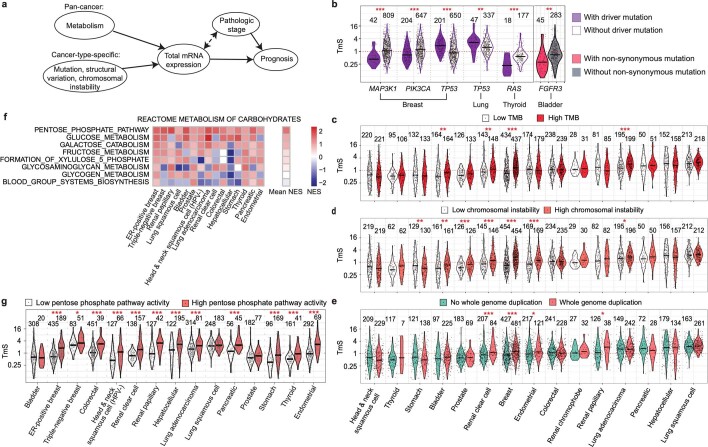
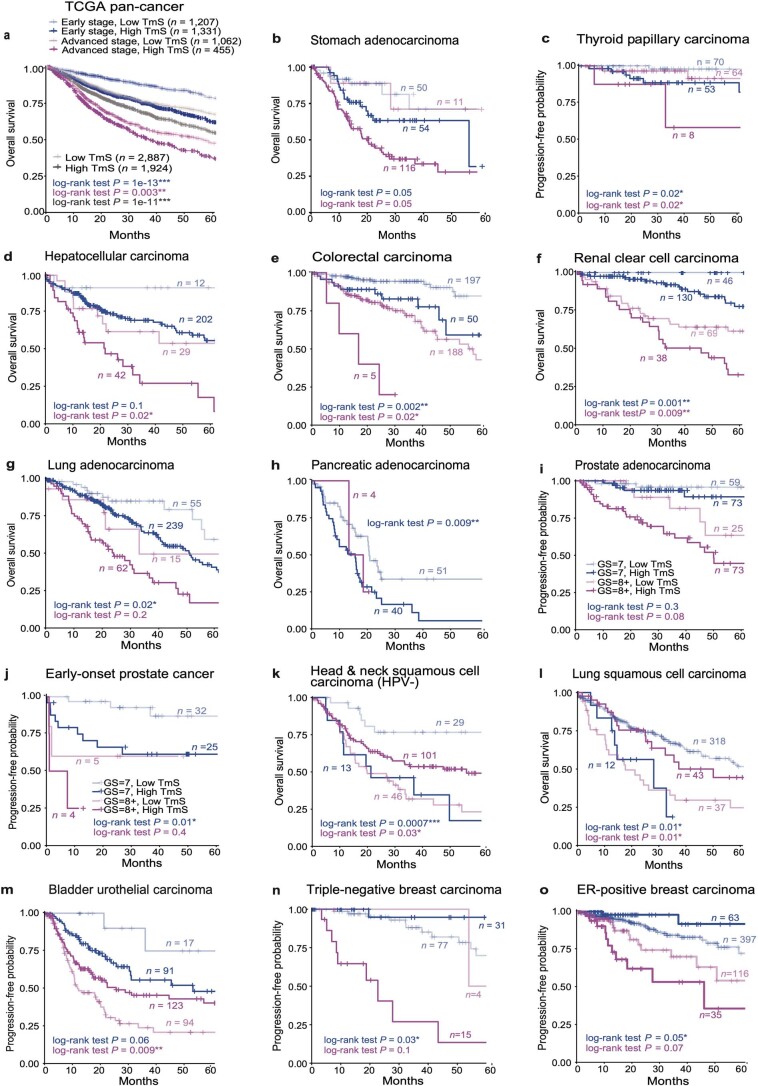
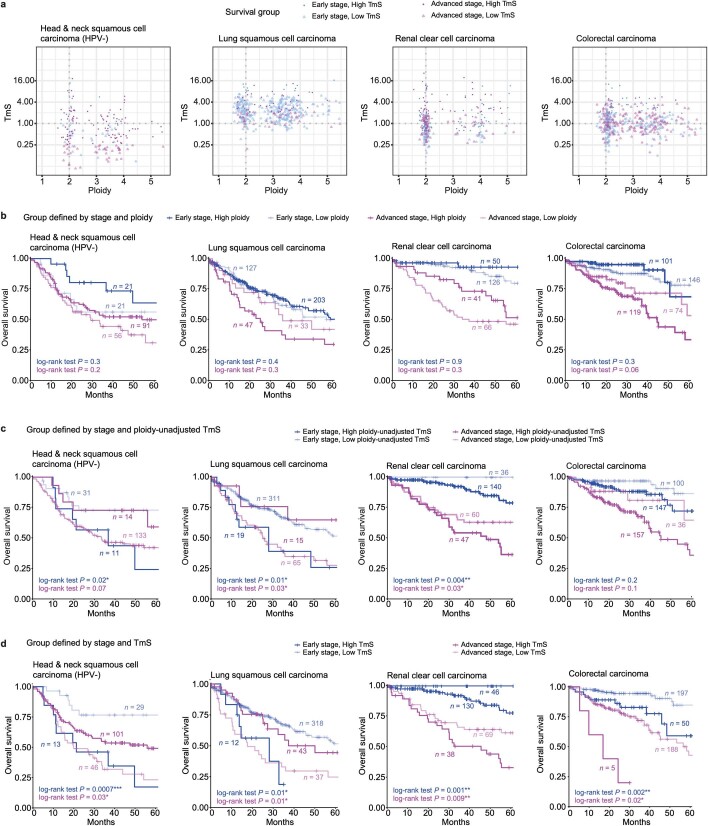
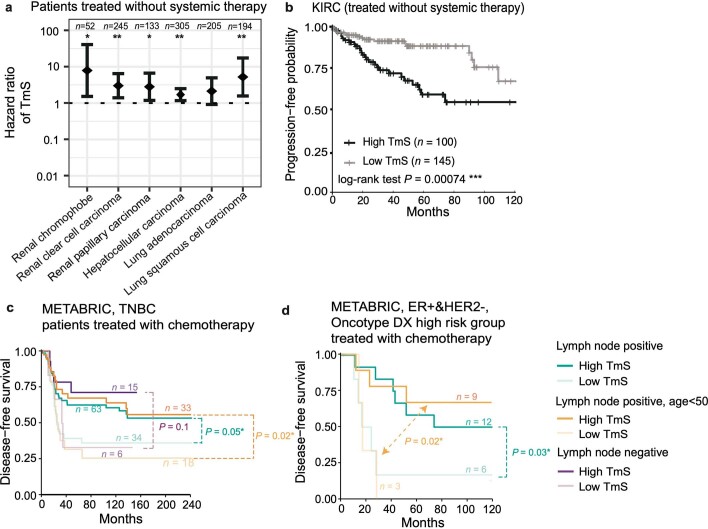
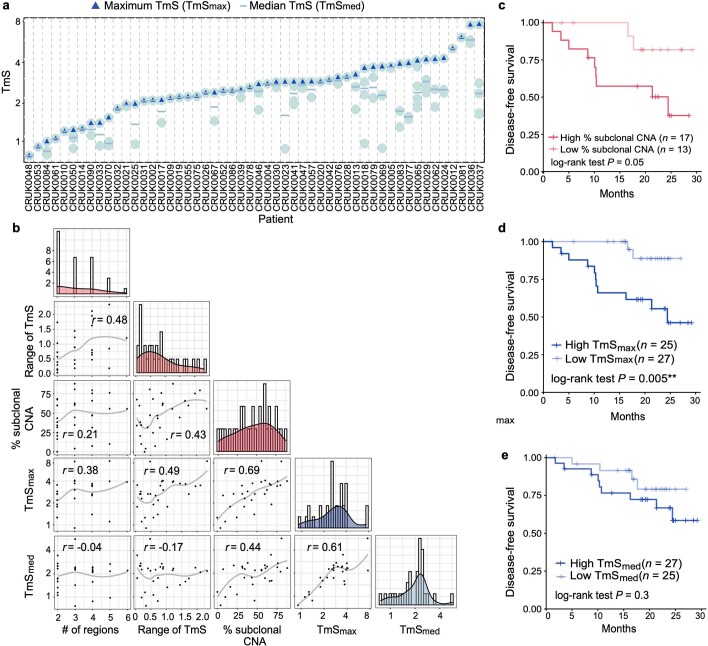
Single-cell RNA sequencing studies have suggested that total mRNA content correlates with tumor phenotypes. Technical and analytical challenges, however, have so far impeded at-scale pan-cancer examination of total mRNA content. Here we present a method to quantify tumor-specific total mRNA expression (TmS) from bulk sequencing data, taking into account tumor transcript proportion, purity and ploidy, which are estimated through transcriptomic/genomic deconvolution. We estimate and validate TmS in 6,590 patient tumors across 15 cancer types, identifying significant inter-tumor variability. Across cancers, high TmS is associated with increased risk of disease progression and death. TmS is influenced by cancer-specific patterns of gene alteration and intra-tumor genetic heterogeneity as well as by pan-cancer trends in metabolic dysregulation. Taken together, our results indicate that measuring cell-type-specific total mRNA expression in tumor cells predicts tumor phenotypes and clinical outcomes.


Conflict of interest statement

A.M. receives royalties for a pancreatic cancer biomarker test from Cosmos Wisdom Biotechnology. A.M. is also listed as an inventor on a patent that has been licensed by Johns Hopkins University to Thrive Earlier Detection. A.M. is a consultant for Freenome and Tezcat Biotechnology. J.Z. reports research funding from Merck and Johnson & Johnson and consultant fees from Bristol Myers Squibb (BMS), Johnson & Johnson, AstraZeneca, Geneplus, OrigMed and Innovent outside of the submitted work. P.M. has received honoraria for service on a Scientific Advisory Board for Mirati Therapeutics and BMS, non-branded educational programs supported by Exelixis and Pfizer and research funding for clinical trials from Takeda, BMS, Mirati Therapeutics and Gateway for Cancer Research. W.W. reports research funding from Curis, Inc. J.P.S. and W.W. report research funding from Celsius Therapeutics. J.P.S. is a paid consultant for Engine Biosciences. S.K. has ownership interest in MolecularMatch, Lutris and Iylon and is a consultant for Genentech, EMD Serono, Merck, Holy Stone, Novartis, Eli Lilly, Boehringer Ingelheim, Boston Biomedical, AstraZeneca/MedImmune, Bayer Health, Pierre Fabre, Redx Pharma, Ipsen, Daiichi Sankyo, Natera, HalioDx, Lutris, Jacobio, Pfizer, Repare Therapeutics, Inivata, GlaxoSmithKline, Jazz Pharmaceuticals, Iylon, Xilis, Abbvie, Amal Therapeutics, Gilead Sciences, Mirati Therapeutics, Flame Biosciences, Servier, Carina Biotechnology, Bicara Therapeutics, Endeavor BioMedicines, Numab Pharma and Johnson & Johnson/Janssen and receive research funding from Sanofi, Biocartis, Guardant Health, Array BioPharma, Genentech/Roche, EMD Serono, MedImmune, Novartis, Amgen, Eli Lilly and Daiichi Sankyo. P.A.F. reports research funding from MEI Pharma, Inc. P.H.B. owns stock in GeneTex. C.S. acknowledges grant support from AstraZeneca, Boehringer Ingelheim, BMS, Pfizer, Roche-Ventana, Invitae (previously Archer Dx—collaboration in minimal residual disease sequencing technologies) and Ono Pharmaceutical. C.S. is an AstraZeneca Advisory Board member and Chief Investigator for the AZ MeRmaiD 1 and 2 clinical trials and is also chief investigator of the NHS Galleri trial. C.S. has consulted for Amgen, AstraZeneca, Pfizer, Novartis, GlaxoSmithKline, Merck, BMS, Illumina, Genentech, Roche-Ventana, GRAIL, Medicxi, Metabomed, Bicycle Therapeutics, Roche Innovation Centre Shanghai and the Sarah Cannon Research Institute. C.S. had stock options in Apogen Biotechnologies and GRAIL until June 2021; currently has stock options in Epic Bioscience and Bicycle Therapeutics; and has stock options in and is a co-founder of Achilles Therapeutics. C.S. holds various patents relating to assay technology for cancer; US patents relating to detecting tumor mutations and methods for lung cancer detection; and both a European and a US patent related to identifying insertion/deletion mutation targets. All is outside the submitted work. The remaining authors declare no competing interests.

Figures

Fig. 1
Fig. 1. High diversity of total mRNA expression in cancer cells.
a, Illustration of diversity in total mRNA levels in tumor cells versus other cell types. b, UMAP plots of scRNA-seq data from two patients with colorectal cancer. Tumor cell clusters are bolded in both samples. Dashed circles indicate groups of cells that are similar in total UMI and gene counts, which are merged for simplicity. c, Distributions of gene counts and total UMI counts by cell type in scRNA-seq data from the two patients shown in b. The top x axis annotates total UMI counts (with mean and 95% CI). The bottom x axis annotates gene count distribution (density). Density curves are colored for tumor cells and shown in grayscale for non-tumor cells. Clusters with higher gene counts are shown in darker shades. Numbers of cells analyzed are indicated in parentheses. Tumor cell clusters are highlighted by the same colors as those in b. d, Monocle-inferred trajectories for tumor cells from the two patients. Cells on the trees are colored by total UMI counts. Average differentiation scores by CytoTRACE for high-UMI and low-UMI clusters are provided. e, Ratios of mean total UMI counts of tumor cells to non-tumor cells (n = number of tumor cells / number of non-tumor cells) and 95% CIs in pooled scRNA-seq data (pseudo-bulk) from ten patients with colorectal (n = 3, including patients 1 and 2 shown in bd), hepatocellular (n = 3), lung (n = 2) and pancreatic (n = 2) cancers. DFS, disease free survival; PFS, progression-free survival; OS, overall survival. The Benjamini–Hochberg-adjusted P values for two-sided Wilcoxon rank-sum tests comparing the ratios between patient samples are indicated by asterisks (*P < 0.05, **P < 0.01 and ***P < 0.001). UMAP, uniform manifold approximation and projection. Source data
Fig. 2
Fig. 2. Analysis workflow to measure tumor-specific total mRNA expression and benchmarking.
a, Calculation of TmS begins with deconvolution using matched DNA sequencing and RNA sequencing data. ASCAT and/or ABSOLUTE are used to estimate tumor purity and ploidy from the DNA sequencing data, whereas DeMixT estimates tumor-specific mRNA proportion from the RNA sequencing. b, Benchmarking using bulk RNA sequencing data from in vitro cell lines containing tumor and non-tumor cells, H1092 (human lung cancer) and cancer-associated fibroblasts (CAFs). c, Distribution of TmS in 18 mixed cell line samples estimated under two scenarios using DeMixT: (1) three pure CAF samples as known reference and (2) three pure H1092 samples as known reference. The true TmS values for H1092 and CAF are provided in blue dots. They are measured as the ratio of total RNA amount (in ng µl−1) in 1 million cells: 0.87 for H1092 and 1.2 for CAF. The median estimates of TmS are (0.86, 1.2), with MADs of (0.24, 0.18) for H1092 and CAF cells, using the other cell line as the baseline. The P values for two-sided Wilcoxon rank-sum tests comparing TmS between groups are indicated (not significant (NS): P > 0.05; ***P < 0.001). Source data
Fig. 3
Fig. 3. Estimation of tumor-specific total mRNA expression in bulk sequencing data.
a, Diagram for the TmS calculation in TCGA, ICGC-EOPC, METABRIC and TRACERx datasets. The number of patients is denoted by n. When there are more than one tumor sample for each patient, the number of tumor samples is denoted by m. b, Distribution of TmS in 6,644 tumor samples from 6,580 patients across 15 cancer types in TCGA, ICGC-EOPC, METABRIC and TRACERx. The number of tumor samples for each cancer type is indicated above each violin plot. Source data
Fig. 4
Fig. 4. TmS is associated with known prognostic characteristics and refines prognostication in addition to stage.
af, Clinicopathologic annotations for TCGA head and neck (a); TCGA renal papillary (b); TCGA bladder urothelial (c); TCGA prostate (d); TCGA breast (e); and METABRIC breast (f) cancers. Receptor status is indicated as follows: ER, estrogen; PR, progesterone; TNBC, triple-negative. Tumor samples are ordered by TmS from low to high. Benjamini–Hochberg-adjusted P values for Kruskal–Wallis tests comparing TmS across clinicopathologic subgroups are indicated by asterisks. For MYC/PVT1 copy number status, ‘Gain’ indicates either MYC or PVT1 amplification, and ‘Neutral’ indicates that no copy number alterations were detected. g, Kaplan–Meier curves of PFI for TCGA samples. Gray lines denote summary Kaplan–Meier curves of patients with high versus low TmS across all cancer types. Kaplan–Meier curves are further grouped into four groups by TmS and pathologic stage. P values of log-rank tests between high- versus low-TmS groups are indicated by asterisks. h, Forest plot of HRs (center points) and 95% CIs (error bars) of multivariate Cox proportional hazard models for OS or PFI in TCGA. Models are adjusted for age, TmS (high versus low), stage (advanced versus early) as well as an interaction term of TmS × stage, where applicable (see details in Supplementary Table 5). i, Forest plot of HRs (center points) and 95% CIs (error bars) of multivariate Cox proportional hazard models with age, TmS (high versus low), chemotherapy (yes versus no), Oncotype Dx risk classification (high versus intermediate versus low) as predictors for DFS in METABRIC (see details in Supplementary Table 7). For h and i, P values of two-sided Wald tests for the covariates are indicated by asterisks. Kaplan–Meier curves of DFS grouped by TmS (high versus low) for METABRIC TNBC (j) and ER+HER2 (k) patients treated with chemotherapy. P values of log-rank tests between high- versus low-TmS groups are indicated by asterisks. For all P values, significance levels are denoted as follows: *P < 0.05, **P < 0.01 and ***P < 0.001. HPV, human papillomavirus. Source data
Fig. 5
Fig. 5. Regional estimation of TmS identifies spatial heterogeneity and refines prognostication in early-stage lung cancer.
a, Illustration of the TRACERx multi-region study and a multi-level analysis pipeline. b, Distribution of TmS for 94 tumor regions from 30 TRACERx patients with at least two regions sampled. Blue triangles denote the maximum TmS for each patient. Blue ‘-’ denotes the median TmS for each patient. c, Distributions of TmS per region with high or low % CNA burden (left) and % subclonal CNA per region (right). The number of regions is 47 for each group. Benjamini–Hochberg-adjusted P values of two-sided Wilcoxon rank-sum tests are indicated by asterisks. d, Pairwise scatter plots and histograms of % CNA, % subclonal CNA and TmS per region across 94 regions. Different colors annotate three randomly assigned patient groups, demonstrating that the correlation between TmS and % subclonal CNA per region is not driven by a subset of patients. Spearman correlation coefficient r values are shown, and the gray lines represent a LOESS fit. e, Scatter plot showing TmSmax versus total % subclonal CNA in each patient (n = 30). The regression line and its 95% confidence band are colored in black and gray, respectively. Patients are colored by the evolutionary relationship. f, Kaplan–Meier survival curves of DFS stratified by TmSmax. g, Kaplan–Meier survival curves of DFS stratified by both TmSmax and % subclonal CNA. P values are obtained by log-rank tests between high- versus low-TmS groups. For all P values, significance levels are denoted as follows: *P < 0.05, **P < 0.01 and ***P < 0.001. Source data
Extended Data Fig. 1
Extended Data Fig. 1. High diversity of total mRNA expression in tumor cells.
a, Flowchart of scRNA-seq data preprocessing. b, Heatmap showing the Spearman correlations between gene counts and total UMI counts across cell types in the ten patient samples. c, Illustration of expressed genes in tumor cells (left panels) compared to non-tumor cells: epithelial and stromal cells (middle panels) and immune cells (right panels). The data shown are based on cells randomly selected from each of the four ‘patient 1’ samples with colorectal, hepatocellular, lung and pancreatic cancers, who presented worse prognosis or advanced disease. In each heatmap, expressed genes (UMI count > 0) are shown in black, and non-expressed genes (UMI count = 0) are shown in gray. Cells in the rows and genes in the columns are ordered from high to low by the total numbers of expressed genes and the number of cells with detected expression of each gene, respectively. Barplots provide the corresponding distributions of gene counts and total UMI counts. d, Q-Q plots of total UMI counts in tumor cells compared to non-tumor cells for the same four ‘patient 1’ samples that were used as in c. For each patient, the log2 transformed total UMI counts of immune cells (left) or stromal/epithelial cells (right) are used as the theoretical quantiles, respectively. Source data
Extended Data Fig. 2
Extended Data Fig. 2. Using total UMI counts and gene counts to measure global gene expression heterogeneity.
a, Distributions of gene counts and total UMI counts by cell type in scRNA-seq data from eight remaining patients with colorectal, hepatocellular, lung or pancreatic cancers (in relation to Fig. 1). The top x-axis annotates total UMI counts (means and 95% CIs). The bottom x-axis annotates gene count distribution (density). Density curves are shown in color for tumor cells and in grayscale for non-tumor cells. Clusters with higher gene counts are shown in darker shades. Numbers in the parentheses indicate the number of cells analyzed. b, Monocle-inferred trajectories for tumor cells from five patients with colorectal, lung and pancreatic cancers. Cells on the trees are colored by total UMI counts. Average differentiation scores by CytoTRACE for high- and low-UMI count tumor cell clusters are labelled. c, Distribution of cell cycle scores in tumor cell clusters from eight scRNA-seq patient samples where multiple tumor cell clusters were presented. Cell cycle score is the sum of the S and G2/M scores as estimated by Seurat. P values of two-sided Wilcoxon rank-sum tests comparing the cell cycle scores across clusters are indicated by asterisks (* P < 0.05, ** < 0.01, *** < 0.001). In the boxplots, whiskers represent the maximum and minimum values of cell cycle scores, the middle line in the box denotes median, and the bounds of the box stand for upper and lower quartiles. Source data
Extended Data Fig. 3
Extended Data Fig. 3. Consensus estimation of TmS from matched RNAseq and DNAseq data in TCGA.
a, Illustrative relationship between cells, ploidy and mRNA content. Three examples with ploidy of 2, 3, or 4 are given. Under the scenario of linear dosage effects, as shown in the boxes with a yellow background, if cellular total mRNA amounts are 2, 3, and 4, then the ploidy-adjusted, or per haploid genome, total mRNA amount would be 1, 1, and 1, respectively. Under the scenario of dosage compensation, that is, more chromosomal copies but maintaining the same total dose, the second cell has a total mRNA amount of 2 and a per haploid genome value of 0.67. Under the scenario of dosage transgression, that is, more chromosomal copies with more dose per copy, the third cell has a total mRNA amount of 6 and a per haploid genome value of 1.5. b, Definition of TmS and its analytic pipeline. c, Distribution of tumor-specific mRNA proportions estimated by DeMixT across cancer types. d-e, Distributions of tumor cell proportions estimated by (d) ASCAT or (e) ABSOLUTE across cancer types. f, Smoothed scatter plot of tumor ploidy estimates from ABSOLUTE vs. ASCAT across all samples. Gray points correspond to 968 samples that presented inconsistent tumor ploidy (and purity) estimates between the two methods. g, TmS estimates using either ABSOLUTE or ASCAT-derived purity and ploidy estimates with or without ploidy adjustment for the 968 discordant samples from (f). Blue and gray points correspond to TmS prior to and after ploidy adjustment, respectively. Ploidy adjustment improved consistency between the ABSOLUTE and ASCAT results. h, Scatter plot of TmS calculated using the two methods. A linear regression model was fitted using log2(TmS estimated by ABSOLUTE) as the predicted variable and log2(TmS estimated by ASCAT) as the predictor variable. Red points are outliers with a Cook’s distance ≥ 4/n, where n = 5,295 for the total number of TCGA samples. Cyan points are the remaining samples (95%) that showed a good fit for the model and hence their TmS estimates are consistent and robust across two DNAseq deconvolution methods. Source data
Extended Data Fig. 4
Extended Data Fig. 4. Profile likelihood-based gene selection for RNAseq deconvolution.
a-b, same as Extended Data Fig. 3a-b. c, Illustration of the RNAseq deconvolution workflow with intrinsic tumor signature genes selected using a profile-likelihood based gene selection approach. Three scenarios where genes with undesirable properties are included, leading to large estimation biases, are illustrated with red ‘x’ on top. Their corresponding gene selection scores are expected to be larger than genes with the desirable property for the DeMixT model-based deconvolution (illustrated with a green check on top). Therefore, when genes are ranked based on the gene selection score, as derived using profile likelihoods, selecting the top-ranked genes will reduce the biases in estimating tumor-specific mRNA proportions. d, Distributions of gene selection scores across four types of genes in a simulation study (Supplementary Note 2.2). For the profile-likelihood based gene selection, genes are ranked from the smallest to the largest score (left). For the DE based gene selection, genes are ranked from the largest to the smallest absolute t-statistics (middle). P values of Kruskal-Wallis (one-way ANOVA) test across all four gene groups are shown on top. P values of two-sided Wilcoxon rank-sum tests within pairs of gene groups are indicated by asterisks (* P < 0.05, ** < 0.01, *** < 0.001). The types of genes among the top 1,500 selected genes are shown (right) for the two rankings. Ideally only genes consistently differentially expressed between tumor (T) and normal (N), annotated in red, should be selected, corresponding demonstrating the lowest values in both panels as compared to genes annotated in other colors. This is achieved by the profile-likelihood method but not the DE method. In the boxplots, whiskers represent the maximum and minimum values of gene selection scores, the middle line in the box stands for median, and the bounds of the box stand for upper and lower quartiles. Source data
Extended Data Fig. 5
Extended Data Fig. 5. Validating the TmS measure through benchmarking and evaluating the biological relevance of intrinsic tumor signature genes in TCGA.
a, Total mRNA proportion estimation for H1092 and CAF using DeMixT in the benchmarking study (n = 18). The concordance correlation coefficient (CCC) for two variables x (true tumor-specific RNA proportions) and y (estimated tumor-specific RNA proportions) is expressed as 2ρσxσyσx2+σy2+(μxμy)2, where μ and σ2 represent the mean and variance, and ρ is the Pearson correlation coefficient. b, Histogram of the number of overlapping genes across cancer types and their annotation categories. The y axis represents the total number of genes and the x axis represents the number of cancer types for which a gene was selected. c, Heatmap of normalized enrichment scores of top cancer hallmark pathways and KEGG pathways. Only pathways with a BH adjusted P value < 0.05 are colored. d, M-A plot comparing ATAC-seq peak scores of intrinsic tumor signature genes (signature) vs. other genes (non-signature) from matched tumor samples in each cancer type. Samples above the dashed line have higher ATAC-seq peak scores in intrinsic tumor signature genes compared to those in non-signature genes. Samples with BH adjusted P values < 0.05 from per-sample permutation tests are shown as circles. Source data
Extended Data Fig. 6
Extended Data Fig. 6. TmS is associated with tumor genomic features and metabolic pathway activities across cancer types.
a, Contributors to tumor-specific total mRNA expression. b, Distributions of TmS for TCGA samples with or without specific mutations in six cancer-gene pairs. The number of samples is indicated on the top. We performed an agnostic association analysis of TmS with all non-synonymous mutations (32,894 cancer-gene pairs, using logistic regression models), and concurrently a driver mutation-specific association analysis of TmS (24 cancer-gene pairs). We find 5 overlapping pairs out of 6 statistically significant pairs produced from each interrogation (BH adjusted P values < 0.01). The additional pair found through the agnostic search (FGFR3 in bladder carcinoma in TCGA) was not identified in the driver mutation analysis due to a limited sample size. These associations in breast, lung, thyroid, and bladder cancers show that TmS can capture changes in tumor phenotypes induced by driver mutations in a cancer type-specific manner. Our observation also supports previous findings that the same driver mutations may not have the same prognostic effect across cancers, and their effects may be modified by additional tumor and/or treatment-related factors. c-e, Distribution of TmS for patient samples with (c) high or low tumor mutation burden (TMB); (d) high or low chromosomal instability score; (e) with or without a whole genome duplication event. Patient groups are categorized as high vs. low based on the median values of TMB and chromosomal instability scores in (c) and (d) respectively. f, Heatmap of normalized enrichment scores (NES) of Reactome metabolism of carbohydrates pathways across 15 cancer types in TCGA. Pathways are ordered by the mean NES across 15 cancer types, from high to low. g, Distribution of TmS for patient samples with high or low for pentose phosphate pathway activity, where patient groups are defined by hierarchical clustering of expression levels from 13 genes. For b-d and g, the BH adjusted P values for two-sided Wilcoxon rank-sum tests comparing TmS between corresponding groups are indicated by asterisks (* P < 0.05, ** < 0.01, *** < 0.001). Source data
Extended Data Fig. 7
Extended Data Fig. 7. TmS refines prognostication on pathological stages.
a, KM curves of OS for TCGA pan-cancer. Gray lines denote summary KM curves of patients with high vs. low TmS across all cancer types. KM curves are further grouped by TmS and pathological stages into four groups. P values of log-rank tests between high vs. low TmS groups are indicated by asterisks (* P < 0.05, ** < 0.01, *** < 0.001). b-o, KM survival curves for individual cancer types. Source data
Extended Data Fig. 8
Extended Data Fig. 8. Prognostication using ploidy or ploidy-unadjusted TmS on pathological stages.
a, Scatter plots of TmS (y axis) vs. tumor ploidy (x axis) for samples from TCGA patient cohorts with head-and-neck squamous cell carcinoma (HPV negative), lung squamous cell carcinoma, renal clear cell carcinoma, and colorectal carcinoma. The samples were grouped into high vs. low TmS within early or advanced pathological stages, with different groups shown in distinct colors. TmS shows no correlation with tumor ploidy, with Spearman correlation coefficients r = −0.12, 0.01, 0.08 and −0.02 for the four cancer types. b, KM survival curves of OS in four cancer types according to patient groups defined by ploidy and stage. We grouped patients into high vs. low ploidy based on a cutoff of 2.5 within early or advanced pathological stage. c, KM survival curves of overall survival in four cancer types over patient groups defined by ploidy-unadjusted TmS and stage. d, KM survival curves of OS in four cancer types for patient groups defined by TmS and stage. P values of log-rank tests between pairs of patient groups are shown with matching colors and are indicated by asterisk (* P < 0.05, ** < 0.01, *** < 0.001). Source data
Extended Data Fig. 9
Extended Data Fig. 9. TmS refines prognostication in cancer patients with and without systemic therapy.
a, Forest plot of hazard ratios and 95% of CIs of TmS as predictor in patients treated without systemic therapy across 6 TCGA cancer types. P values of two-sided Wald tests are indicated by asterisks (* P < 0.05, ** < 0.01, *** < 0.001). b, KM curves of PFI for renal clear cell carcinoma patients without systemic therapy. c, KM curves of DFS for METABRIC triple negative breast cancer patients who are treated with chemotherapy. KM curves are further grouped by TmS, Lymph node status and age into six groups. d, KM curves of DFS for METABRIC estrogen receptor (ER) positive and human epidermal growth receptor-2 (HER2) negative breast cancer patients who are classified as high risk by Oncotype Dx risk score and treated with chemotherapy. KM curves are further grouped by TmS and age under 50. For b, c and d, P values of log-rank tests between pairs of patient groups are shown with matching colors and are indicated by asterisk (* P < 0.05, ** < 0.01, *** < 0.001). Source data
Extended Data Fig. 10
Extended Data Fig. 10. Regional TmS identifies spatial heterogeneity and refines prognostication in patients with early-stage lung cancer.
a, Distribution of TmS values for 116 tumor regions from 52 patients of the TRACERx study. Blue triangles denote the maximum TmS for a patient. Blue ‘-‘ denote the median TmS for a patient. b, Pairwise scatter plots and histograms of number of regions, range of TmS, % subclonal CNA, maximum of TmS across regions (TmSmax), and median of TmS across regions (TmSmed) per patient. The number of evaluated patients with at least 2 regions is 30. Spearman correlation coefficient r’s are shown, and the gray lines represent a loess fit. c, KM survival curves of DFS for the 30 patients stratified by % subclonal CNA: high versus low. d-e, KM survival curves of DFS for all 52 patients stratified into two groups by TmSmax (d) and (e) TmSmed, respectively. P values obtained by log-rank tests between high vs. low TmS groups are indicated by asterisks (* P < 0.05, ** < 0.01, *** < 0.001). Source data

References

    1. Hanahan D, Weinberg RA. Hallmarks of cancer: the next generation. Cell. 2011;144:646–674. - PubMed
    1. Quintanal-Villalonga Á, et al. Lineage plasticity in cancer: a shared pathway of therapeutic resistance. Nat. Rev. Clin. Oncol. 2020;17:360–371. - PMC - PubMed
    1. Marjanovic ND, et al. Emergence of a high-plasticity cell state during lung cancer evolution. Cancer Cell. 2020;38:229–246. - PMC - PubMed
    1. LaFave LM, et al. Epigenomic state transitions characterize tumor progression in mouse lung adenocarcinoma. Cancer Cell. 2020;38:212–228. - PMC - PubMed
    1. Stewart CA, et al. Single-cell analyses reveal increased intratumoral heterogeneity after the onset of therapy resistance in small-cell lung cancer. Nat. Cancer. 2020;1:423–436. - PMC - PubMed

Publication types