. 2022 Aug;47(9):1597-1607.
doi: 10.1038/s41386-022-01358-6. Epub 2022 Jun 13.

Adolescent social isolation induces distinct changes in the medial and lateral OFC-BLA synapse and social and emotional alterations in adult mice

Affiliations

Adolescent social isolation induces distinct changes in the medial and lateral OFC-BLA synapse and social and emotional alterations in adult mice

Hiroshi Kuniishi et al. Neuropsychopharmacology. 2022 Aug.

Abstract

Early-life social isolation is associated with social and emotional problems in adulthood. However, neural mechanisms underlying how social deprivation impairs social and emotional development are poorly understood. Recently, the orbitofrontal cortex (OFC) and basolateral amygdala (BLA) have been highlighted as key nodes for social and emotional functions. Hence, we hypothesize that early social deprivation disrupts the information processing in the OFC-BLA pathway and leads to social and emotional dysfunction. Here, we examined the effects of adolescent social isolation on the OFC-BLA synaptic transmission by optogenetic and whole-cell patch-clamp methods in adult mice. Adolescent social isolation decreased social preference and increased passive stress-coping behaviour in adulthood. Then, we examined excitatory synaptic transmissions to BLA from medial or lateral subregions of the OFC (mOFC or lOFC). Notably, adolescent social isolation decreased the AMPA/NMDA ratio in the mOFC-BLA synapse in adulthood, while the ratio was increased in the lOFC-BLA synapse. Furthermore, we optogenetically manipulated the mOFC-BLA or lOFC-BLA transmission in behaving mice and examined the effects on social and stress-coping behaviours. Optogenetic manipulation of the mOFC-BLA transmission altered social behaviour without affecting passive stress-coping behaviour, while optogenetic manipulation of the lOFC-BLA transmission altered passive stress-coping behaviour without affecting social behaviour. Our results suggest that adolescent social isolation induces distinct postsynaptic changes in the mOFC-BLA and lOFC-BLA synapses, and these changes may separately contribute to abnormalities in social and emotional development.


Conflict of interest statement

The authors declare no competing interests.

Figures

Fig. 1
Fig. 1. Adolescent social isolation decreased social behaviour and increased passive stress-coping behaviour in mice.
A Time schedule of the experiments. Subjected mice (IS group) were singly housed in plastic cages during adolescence (3–8 weeks of age) and subjected to behavioural tests in adulthood (8 weeks of age~). Control mice (G group) were housed in groups of 3–4 in the plastic cages during the same period. B Time spent in the centre area in the OFT. t(22) = −1.258, p = 0.222, unpaired t test. C Time spent in the open arm in the EPM. t(22) = 0.2737, p = 0.787, unpaired t test. D Percentage of social investigation in the SIT. The social investigation ratio was calculated as follows: (time spent investigating the mice cage / [time spent investigating the mice cage + time spent investigating the empty cage]) x 100. t(22) = 4.209, p < 0.001, unpaired t test. E Time of immobility in the FST. t(22) = −2.167, p = 0.041, Student’s t test. F Time of immobility in the TST. t(15.307) = −2.166, p = 0.046, unpaired t test. Open bars represent group-reared mice (G, n = 12). Filled bars represent socially isolated mice (IS, n = 12). *: p < 0.01, ***: p < 0.001.
Fig. 2
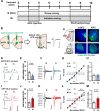
Fig. 2. Adolescent social isolation induced distinct effects on postsynaptic properties in the medial and lateral OFC-BLA pathways.
A Time schedule of the experiments. B Schematic representations of the optogenetic isolation of mOFC-BLA or lOFC-BLA synaptic transmissions in the acute brain slice. C Representative photographs of ChR2-EYFP expression in the viral injection site in the mOFC (left top) or lOFC (right top, scale bar: 1 mm) and projection axon terminals in the BLA (left and right bottom, scale bar 250 μm). D Representative traces of AMPAR (at −70 mV) and ANPA/NMDA-mixed EPSCs (at +40 mV) in the mOFC-BLA synapse obtained from G (left) and IS mice (right). NMDAR-EPSC is measured at 60 ms after blue light stimulation. E The AMPA/NMDA current ratio in the mOFC-BLA synapse. t(22) = 6.042, p < 0.001, unpaired t test. G n = 12 cells, IS: n = 12 cells from 3 mice. F Representative traces of AMPAR-EPSC in the mOFC-BLA synapse at various holding potentials. G The current-voltage relationship in the mOFC-BLA synapse (at all holding potentials, p > 0.05, unpaired t test or Mann–Whitney U test). H The rectification index (EPSC amplitude at −60 mV / EPSC amplitude at +60 mV) in the mOFC-BLA synapse. t(20) = 0.419, p = 0.680, unpaired t test. G: n = 11 cells from 4 mice, IS: n = 12 cells from 3 mice. I Representative traces of AMPAR- and ANPA/NMDA-mixed EPSCs in the lOFC-BLA synapse. J The AMPA/NMDA current ratio in the lOFC-BLA synapse. t(21) = −3.906, p < 0.001, unpaired t test. G: n = 11 cells, IS: n = 12 cells from 3 mice. K Representative traces of AMPAR-EPSC in the lOFC-BLA synapse at various holding potentials. L The current-voltage relationship in the lOFC-BLA synapse (at holding potentials + 20, +40, and +60 mV, p < 0.01, unpaired t test). M The rectification index in the lOFC-BLA synapse. t(13.538) = −4,238, p < 0.001, unpaired t test. G: n = 10 cells, IS: n = 12 cells from 3 mice. Open bars represent G mice. Filled bars represent IS mice. Scale bar: 20 ms, 100 pA. **: p < 0.01, ***: p < 0.001.
Fig. 3
Fig. 3. Adolescent social isolation did not induce significant effects on the paired-pulse ratio in both mOFC-BLA and lOFC-BLA synapses.
A Representative traces of EPSCs in the mOFC-BLA synapse evoked by paired optical stimulation (50 ms interval) at −70 mV. B The paired-pulse ratio in the mOFC-BLA synapse at 50, 100, 250, 500 ms pulse-interval (at all pulse intervals, p > 0.05, unpaired t test or Mann–Whitney U test). G: n = 14 cells from 4 mice. IS: n = 14 cells from 6 mice. C Representative traces of EPSCs in the lOFC-BLA synapse evoked by paired optical stimulation (50 ms interval) at −70 mV. D The paired-pulse ratio in the lOFC-BLA synapse (at all pulse intervals, p > 0.05, unpaired t test). G: n = 14 cells from 3 mice, IS: n = 14 cells from 5 mice.
Fig. 4
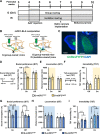
Fig. 4. mOFC-BLA pathway modulates social but not passive stress-coping behaviour.
A Time schedule of the experiments. B Schematic representations of the viral injection and LED optic fibre placement for optogenetic manipulation of the mOFC-BLA transmission. C Representative photograph of ChR2-EYFP expression in the injection site (left, scale bar: 1 mm) and ChR2-EYFP-expressing axon terminal from the mOFC and optic fibre tips in the BLA (right, scale bar: 250 μm). Asterisk represents the fibre tip. D The experimental procedure for optogenetic manipulation of the mOFC-BLA pathway during the SIT (left). The mice were subjected to the test with optical stimulation on the first day (On) and without the stimulation on the second day (Off). The percentage of social investigation in the SIT with mOFC-BLA inactivation (right). E The total distance travelled in the SIT with mOFC-BLA inactivation. Open bars represent group-reared EYFP-expressing mice. (G-mOFCEYFP, n = 13). Filled bars represent group-reared NpHR-expressing mice (G-mOFCNpHR, n = 12). F The experimental procedure for optogenetic manipulation during the TST (left). The mice were subjected to the test without optical stimulation in the first half (3 min) and with optical stimulation in the second half (3 min) of the test session. The time of immobility in the TST with mOFC-BLA inactivation (right). G-mOFCEYFP: n = 12, G-mOFCNpHR: n = 12. G The percentage of social investigation in the SIT with mOFC-BLA activation. H The total distance travelled in the SIT with mOFC-BLA activation. Open bars represent EYFP-expressing group-reared mice (G-mOFCEYFP: n = 16). The shaded bar represents EYFP-expressing isolated mice (IS-mOFCEYFP, n = 16). Filled bars represent ChR2-expressing isolated mice (IS-mOFCChR2, n = 15). I The time of immobility in the TST with mOFC-BLA activation. G-mOFCEYFP: n = 16, IS-mOFCEYFP: n = 14, IS-mOFCChR2: n = 15. *: p < 0.05, ***: p < 0.001. All statistical values are described in Supplementary Table S1.
Fig. 5
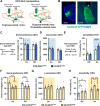
Fig. 5. lOFC-BLA pathway modulates passive stress-coping but not social behaviour.
A Schematic representation of optogenetic manipulation of the lOFC-BLA transmission. B Representative photograph of ChR2-EYFP expression in the injection site (left, scale bar: 1 mm) and ChR2-EYFP-expressing axon terminal from the lOFC and optic fibre tips in the BLA (right, scale bar: 250 μm). The asterisk represents the fibre tip. C Experimental procedure for optogenetic manipulation of the lOFC-BLA pathway during the SIT (left). Percentage of social investigation in the SIT with lOFC-BLA activation (right). D Total distance travelled in the SIT with lOFC-BLA activation. Open bars represent group-reared EYFP-expressing mice. (G-lOFCEYFP, n = 13). Filled bars represent group-reared ChR2-expressing mice (G-lOFCChR2, n = 11). E The experimental procedure for optogenetic manipulation during the TST (left). The time of immobility in the TST with lOFC-BLA activation (right). G-lOFCEYFP: n = 13, G-lOFCChR2, n = 11. F Percentage of social investigation in the SIT with lOFC-BLA inactivation. G Total distance travelled in the SIT with lOFC-BLA inactivation. Open bars represent EYFP-expressing group-reared mice (G-lOFCEYFP, n = 13). The shaded bar represents EYFP-expressing isolated mice (IS-lOFCEYFP, n = 13). Filled bars represent ChR2-expressing isolated mice (IS-lOFCNpHR, n = 15). H Time of immobility in the TST with lOFC-BLA inactivation. G-lOFCEYFP: n = 13, IS-lOFCEYFP: n = 12, IS-lOFCNpHR: n = 15. *: p < 0.05, **: p < 0.01, ***: p < 0.001. All statistical values are described in Supplementary Table S2.

Similar articles

Cited by

References

    1. Meaney MJ. Maternal care, gene expression, and the transmission of individual differences in stress reactivity across generations. Annu Rev Neurosci. 2001;24:1161–92. doi: 10.1146/annurev.neuro.24.1.1161. - DOI - PubMed
    1. Bick J, Nelson CA. Early adverse experiences and the developing brain. Neuropsychopharmacology. 2016;41:177–96. doi: 10.1038/npp.2015.252. - DOI - PMC - PubMed
    1. Andersen SL. Trajectories of brain development: point of vulnerability or window of opportunity? Neurosci Biobehav Rev. 2003;27:3–18. doi: 10.1016/S0149-7634(03)00005-8. - DOI - PubMed
    1. Blakemore SJ, Choudhury S. Development of the adolescent brain: implications for executive function and social cognition. J Child Psychol Psychiatry. 2006;47:296–312. doi: 10.1111/j.1469-7610.2006.01611.x. - DOI - PubMed
    1. Baarendse PJ, Counotte DS, O’Donnell P, Vanderschuren LJ. Early social experience is critical for the development of cognitive control and dopamine modulation of prefrontal cortex function. Neuropsychopharmacology. 2013;38:1485–94. doi: 10.1038/npp.2013.47. - DOI - PMC - PubMed

Publication types