

Proteomic analysis of adipose tissue revealing differentially abundant proteins in highly efficient mid-lactating dairy cows
- PMID: 35697844
- PMCID: PMC9192684
- DOI: 10.1038/s41598-022-13964-x
Proteomic analysis of adipose tissue revealing differentially abundant proteins in highly efficient mid-lactating dairy cows
Abstract
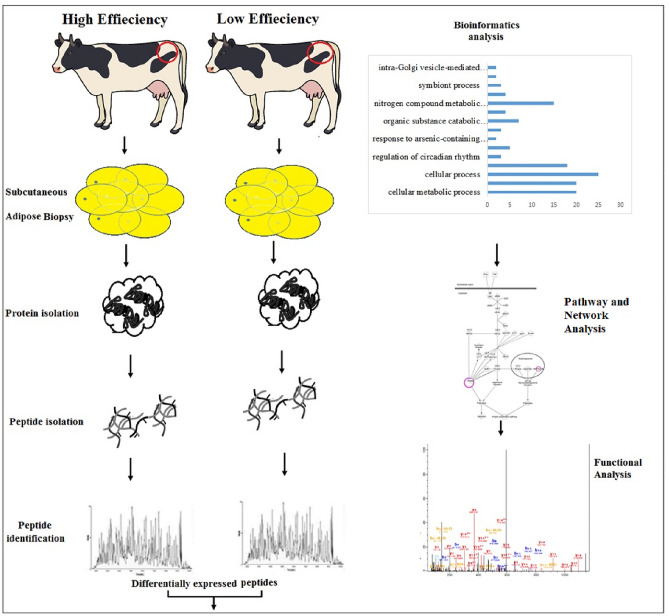
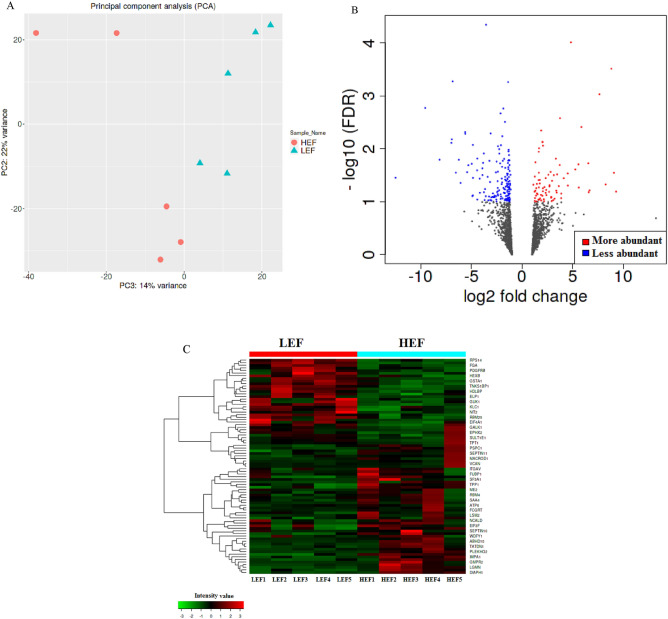
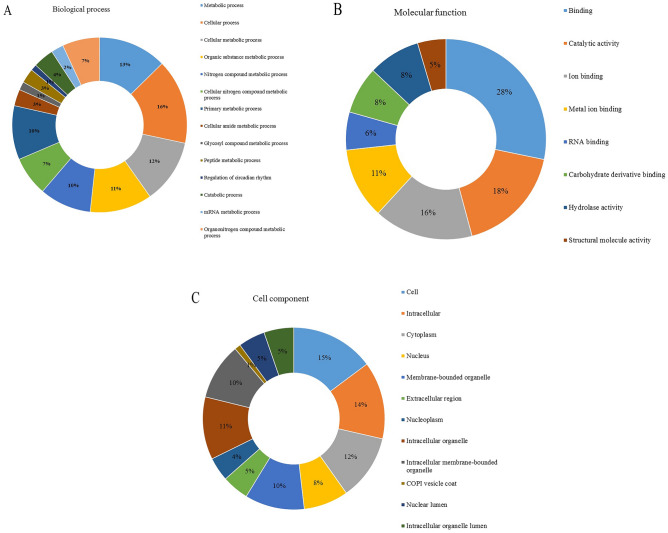
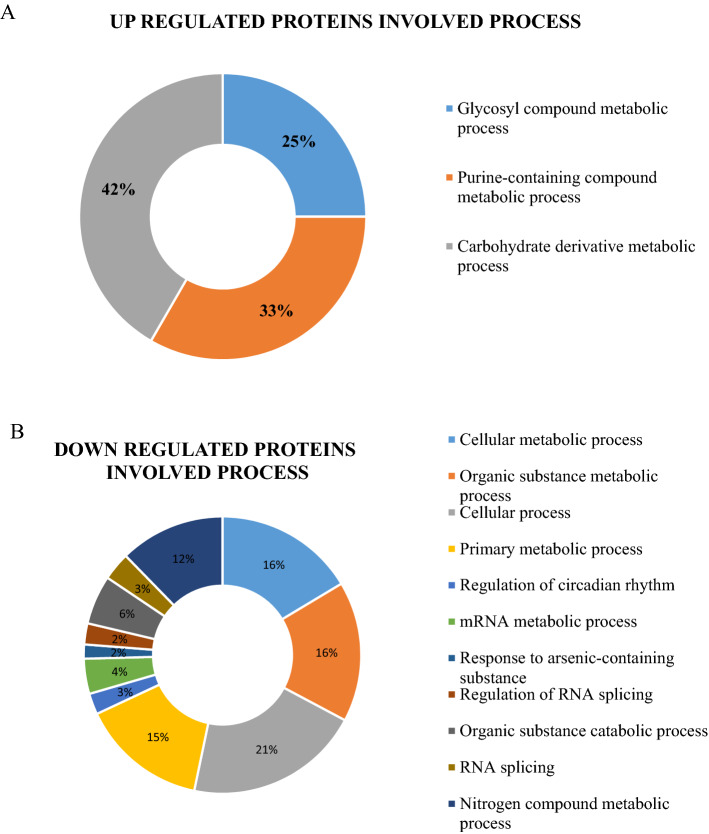
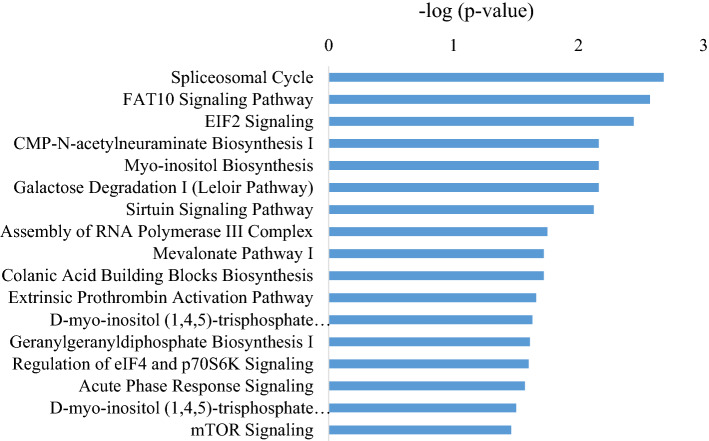
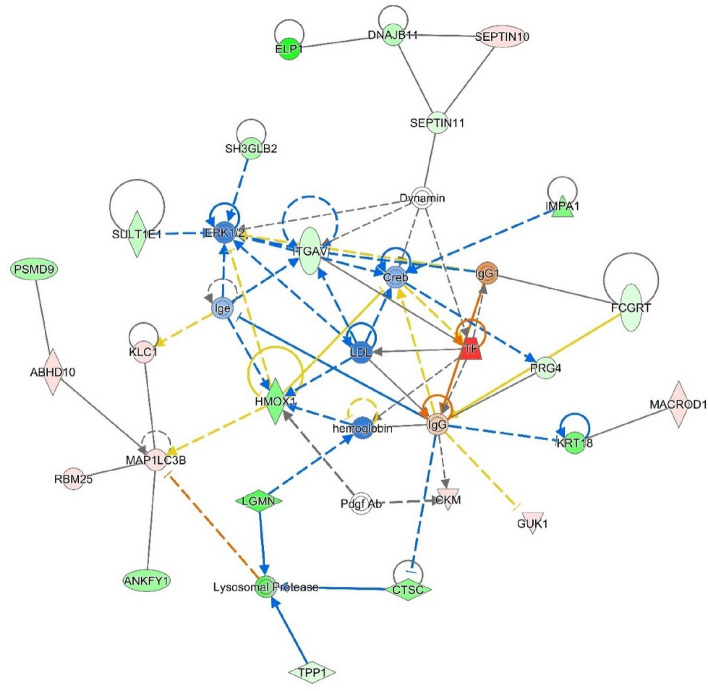
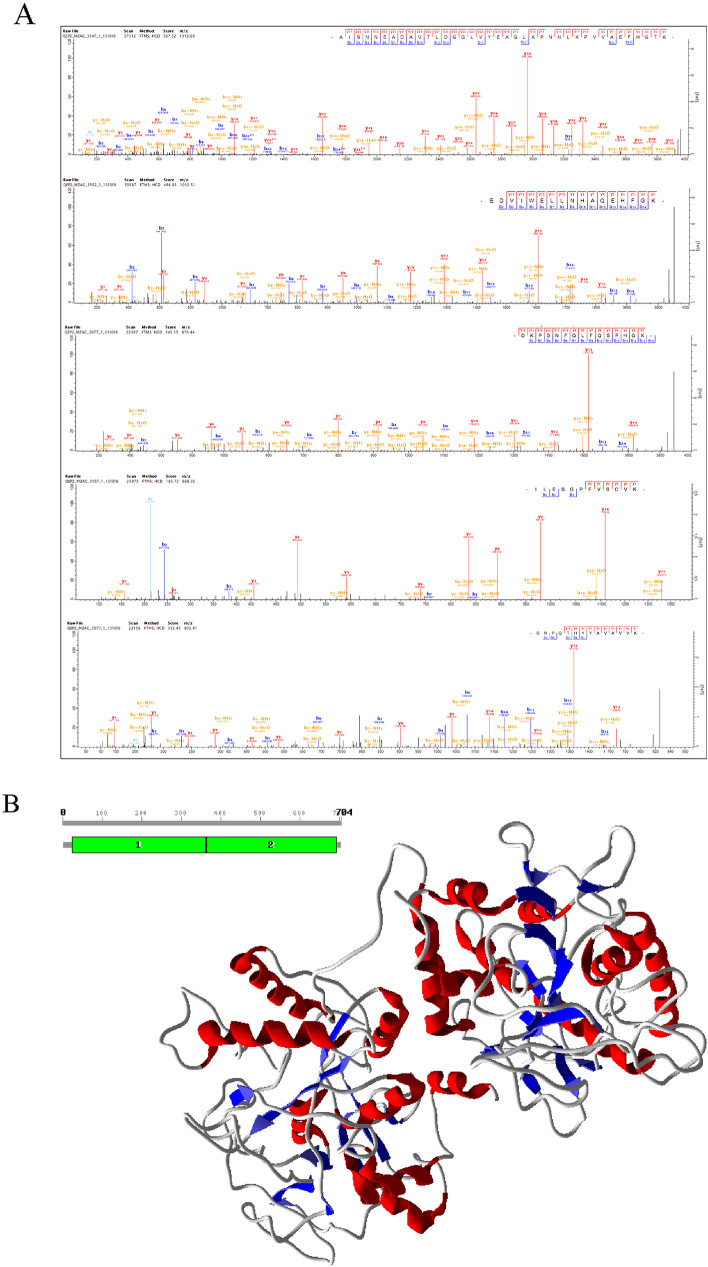
The improvement of nutrient utilization efficiency in dairy cows represents an important task in view of the current rising demand for animal products and sustainable resource usage. In this perspective, the identification of appropriate markers to identify the most efficient animals for dairy production becomes a crucial factor. Residual feed intake (RFI), which represents the difference between predicted and actual intake, is used to define the efficiency of cows. In this study, subcutaneous adipose tissue (AT) was collected from five high efficient (HEF) and five low efficient (LEF) mid-lactation Holstein dairy cows, that represented subgroups of the 20% lowest RFI values (HEF) and highest 20% RFI values (LEF), out of a cohort of 155 cows that were examined for feed efficiency at the individual dairy barn at Volcani Institute, Israel. Adipose samples were examined for proteomic analysis by nano-LC/MS-MS and gene expression by RT-PCR. A total of 101 differential proteins (P ≤ 0.05 and fold change ± 1.5) and two protein networks related to feed efficiency were found between HEF and LEF cows. Among the enriched top canonical pathways, FAT10 signaling, EIF2 signaling, Sirtuin signaling, Acute phase response signaling, Protein ubiquitination and mTOR signaling pathways were related to feed efficiency in AT. Furthermore, abundance of transferrin (TF; FC = 78.35, P = 0.02) enriched pathways, including mTOR signaling, LXR/RXR and FXR/RXR activation was found in AT of HEF cows. Relative mRNA expression of RBM39, which is involved in energy metabolism, was decreased in AT of HEF versus LEF. The relationship found between the AT proteins and/or metabolic pathways and the feed efficiency demonstrates that AT may reflect metabolic adaptations to high efficiency, and suggests that these proteins together with their metabolic mechanisms are suitable candidates as biomarkers to identify efficient cows for dairy production.
© 2022. The Author(s).
Conflict of interest statement
The authors declare no competing interests.
Figures
References
-
- Arthur PF, Archer JA, Herd RM. Feed intake and efficiency in beef cattle: Overview of recent Australian research and challenges for the future. Aust. J. Exp. Agric. 2004;44:361–369. doi: 10.1071/EA02162. - DOI
-
- Arthur JPF, Herd RM. Residual feed intake in beef cattle. Rev. Bras. Zootec. 2008;37:269–279. doi: 10.1590/S1516-35982008001300031. - DOI
-
- Herd RM, Oddy VH, Richardson EC. Biological basis for variation in residual feed intake in beef cattle. 1. Review of potential mechanisms. Aust. J. Exp. Agric. 2004;44:423–430. doi: 10.1071/EA02220. - DOI
Publication types
MeSH terms
Substances
LinkOut - more resources
Full Text Sources
Molecular Biology Databases
Miscellaneous
