. 2022 Jun;54(6):792-803.
doi: 10.1038/s41588-022-01090-3. Epub 2022 Jun 13.

Genetic analysis of right heart structure and function in 40,000 people

Collaborators, Affiliations

Genetic analysis of right heart structure and function in 40,000 people

James P Pirruccello et al. Nat Genet. 2022 Jun.

Abstract

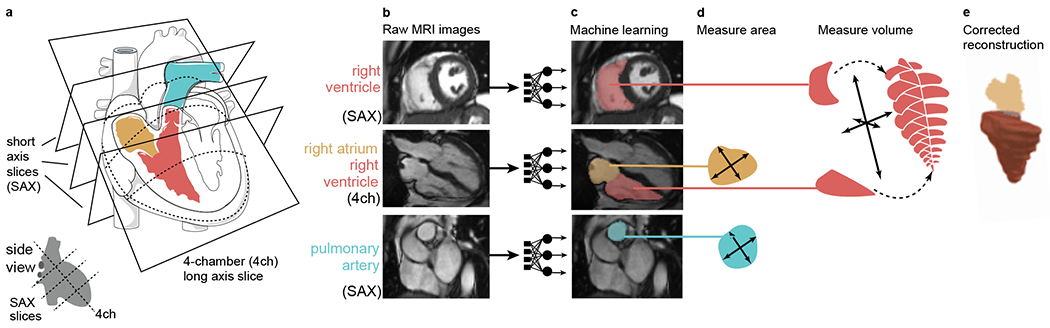
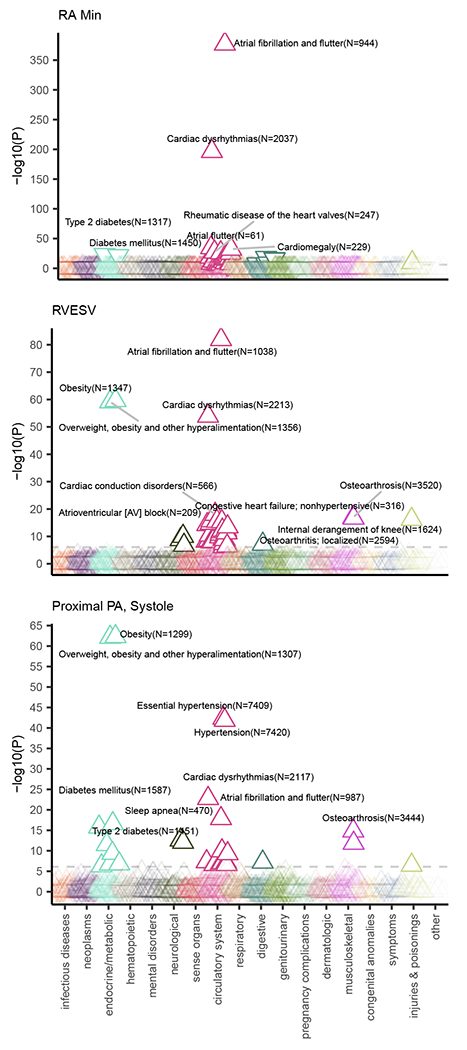
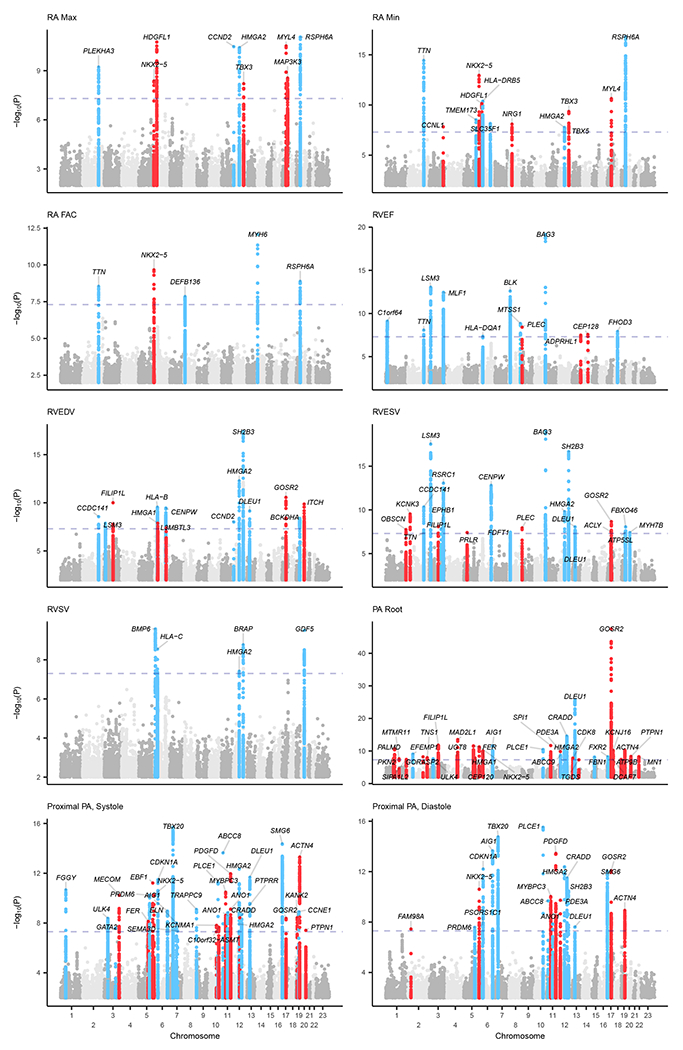
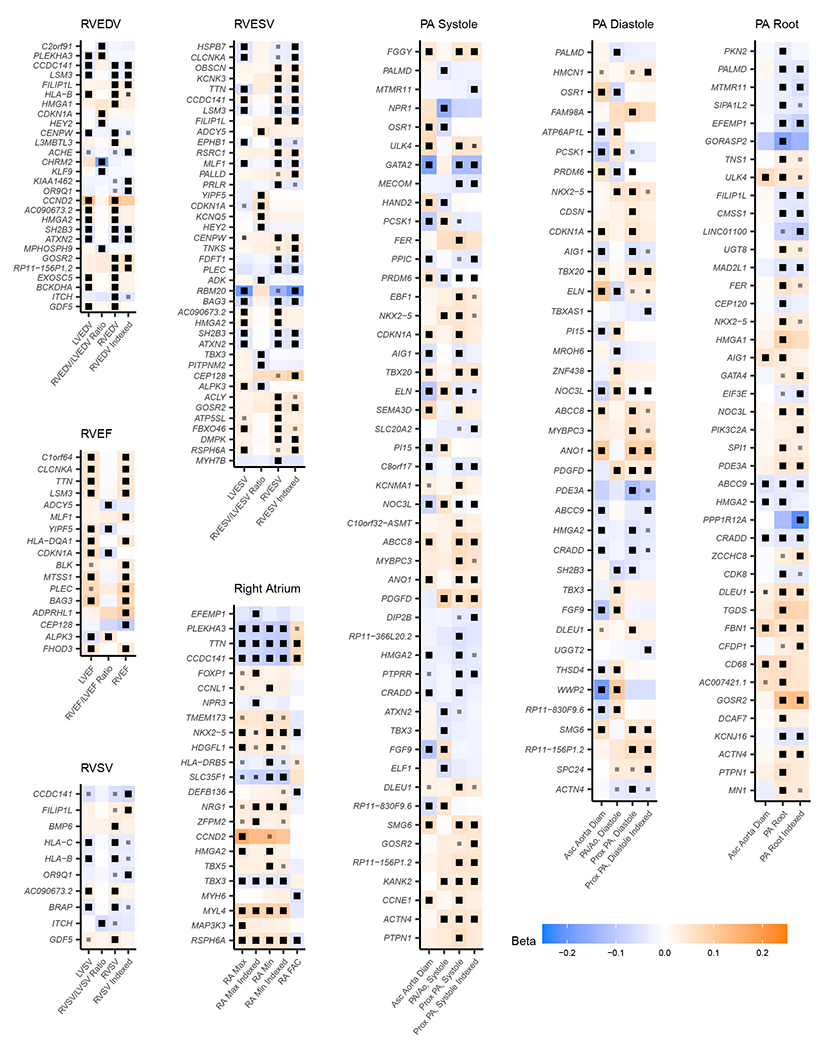
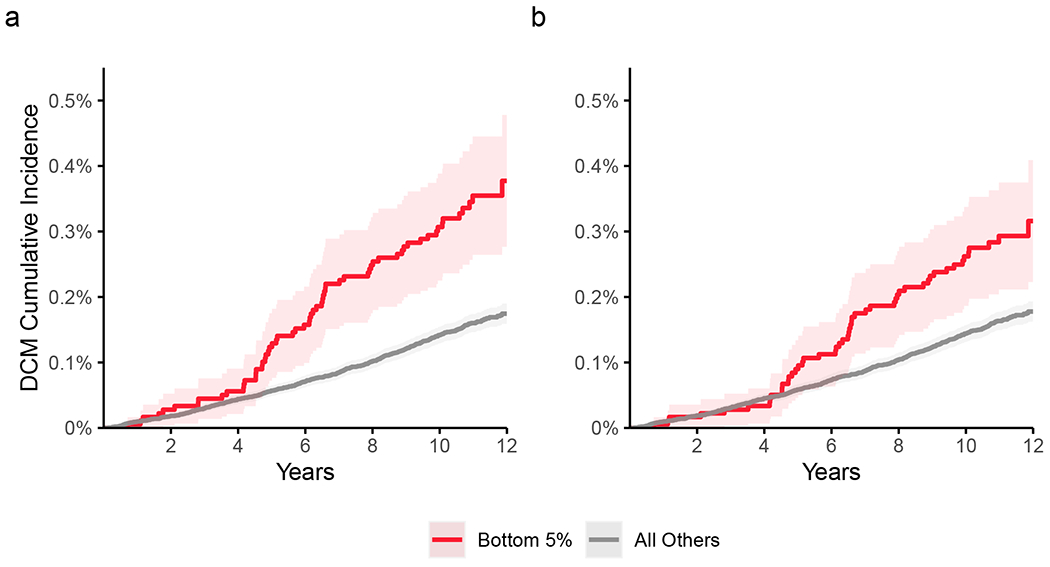
Congenital heart diseases often involve maldevelopment of the evolutionarily recent right heart chamber. To gain insight into right heart structure and function, we fine-tuned deep learning models to recognize the right atrium, right ventricle and pulmonary artery, measuring right heart structures in 40,000 individuals from the UK Biobank with magnetic resonance imaging. Genome-wide association studies identified 130 distinct loci associated with at least one right heart measurement, of which 72 were not associated with left heart structures. Loci were found near genes previously linked with congenital heart disease, including NKX2-5, TBX5/TBX3, WNT9B and GATA4. A genome-wide polygenic predictor of right ventricular ejection fraction was associated with incident dilated cardiomyopathy (hazard ratio, 1.33 per standard deviation; P = 7.1 × 10⁻¹³) and remained significant after accounting for a left ventricular polygenic score. Harnessing deep learning to perform large-scale cardiac phenotyping, our results yield insights into the genetic determinants of right heart structure and function.


Conflict of interest statement

J.P.P. has served as a consultant for Maze Therapeutics. P.B. is supported by grants from Bayer AG and IBM applying machine learning in cardiovascular disease. S.A.L. receives sponsored research support from Bristol Myers Squibb / Pfizer, Bayer AG, Boehringer Ingelheim, and Fitbit, and has consulted for Bristol Myers Squibb / Pfizer and Bayer AG, and participates in a research collaboration with IBM. K.N. is employed by IBM Research. J.E.H. is supported by a grant from Bayer AG focused on machine-learning and cardiovascular disease and a research grant from Gilead Sciences. J.E.H. has received research supplies from EcoNugenics. A.A.P. is employed as a Venture Partner at GV; he is also supported by a grant from Bayer AG to the Broad Institute focused on machine learning for clinical trial design. P.T.E. received sponsored research support from Bayer AG and IBM Research. P.T.E. has also served on advisory boards or consulted for Bayer AG, Quest Diagnostics, MyoKardia and Novartis. The Broad Institute has filed for a patent on an invention from P.T.E., M.E.L., and J.P.P. related to a genetic risk predictor for aortic disease. All remaining authors report no competing interests.

Figures

Figure 1 |
Figure 1 |. Right heart measurement with deep learning.
Measurement of right heart structures from cardiovascular magnetic resonance imaging using deep learning. In all panels, the PA is colored turquoise, the RV is colored red, and the RA is colored yellow. The magnetic resonance images in this figure are reproduced by kind permission of UK Biobank ©. a, Graphical depictions of the right heart structures in a cutaway view of the heart. The art in this panel is derived from Servier Medical Art (licensed under creative commons by attribution, CC-BY-3.0). b, Cardiovascular magnetic resonance imaging. SAX, short axis view; 4ch, four-chamber long axis view. The RV is visible in the SAX and 4ch views, the RA in the 4ch view, and the PA in the basal SAX view. c, The raw images are fed into the trained deep learning model, producing pixel-by-pixel output (here, colorized and laid on top of the raw images). d, The deep learning models are applied to all images, allowing measurement of the right heart structures. e, The right ventricular surface is reconstructed by combining data from SAX and 4ch images (see Online Methods), allowing a volumetric measurement.
Figure 2 |
Figure 2 |. Right heart structures are associated with PheCode-based disease definitions.
PheCode-based disease labels (x-axis) are plotted against a transformation of their association P-value (y-axis) with three right heart phenotypes: minimum right atrial area, RVESV, and proximal PA diameter. The values are derived from a linear model that associates the presence or absence of a PheCode-based disease with the right heart measurement, after adjustment for anthropometric covariates and genetic principal components. The direction of the arrow indicates whether the presence of the disease is associated with an increase (upward arrow) or a decrease (downward arrow) of the right heart measurement. The color indicates the disease grouping (as labeled on the x-axis). All values are available in Supplementary Table 3.
Figure 3 |
Figure 3 |. Alterations in right ventricular volume with prevalent disease.
Disease diagnoses that occur prior to the date of MRI are linked with distinct changes in the volume of the RV throughout the cardiac cycle. For all panels, the x-axis represents fractions of a cardiac cycle (divided evenly into 50 components, starting at end-diastole). a-c, The y-axis represents volume in mL. Values are generated with a linear model for each time point accounting for the left ventricular volume at that time point, as well as clinical covariates; the gray line represents the population without disease, while the orange line represents the population with disease. In the UK Biobank, participants with pulmonary hypertension (a) have elevated right ventricular volume throughout the cardiac cycle, even after accounting for left ventricular volume. Those with heart failure (b) predominantly have elevated left ventricular volume, with relative sparing of their right ventricular volume (see Supplementary Fig. 4 for right ventricular volume without adjustment for left ventricular volume). Cataract (c) is used as a control to demonstrate little association between a non-cardiovascular disease and the volume of the RV. d-f, For pulmonary hypertension (d), heart failure (e), and cataract (f), at each time point the right ventricular volume of individuals with disease is subtracted from the volume without disease and divided by the volume without disease. This represents the percentage above or below the disease-free right ventricular volume for those with disease.
Figure 4 |
Figure 4 |. Manhattan plots of right heart traits.
Manhattan plots show the chromosomal position (x-axis) and the strength of association (−log10 of the P-value, y-axis) for all non-BSA-indexed phenotypes. The X-chromosome is represented as “Chromosome 23.” Loci that contain SNPs with P < 5 × 10⁻⁸ were labeled with the name of the nearest gene; genes may appear multiple times for the same trait when multiple variants at the same locus are in linkage equilibrium with one another (r2 < 0.001). Loci were colored blue if they were also associated with left heart phenotypes with P < 5 × 10⁻⁸, and red otherwise. SNPs with P > 0.01 are not plotted. Manhattan plots by compartment are available in Supplementary Figure 7 (RA), Supplementary Figure 8 (RV), and Supplementary Figure 9 (pulmonary root and PA).
Figure 5 |
Figure 5 |. Right heart loci.
Right heart loci are shown grouped by trait. Where a paired left-heart phenotype is available, the effect size and P-value for the same SNP are shown next to its corresponding right heart trait. Each grid region represents the lead SNP (sorted in chromosomal order and tagged by its nearest gene, labeled on the y-axis) for each trait (x-axis). The effect magnitude (Beta) is represented with shades of orange (increase) and blue (decrease), and the effect direction is oriented with respect to the minor allele within the study population. Black boxes within a grid region indicate that the association between the SNP and the trait has BOLT-LMM P < 5 × 10⁻⁸; those with a smaller gray box indicate BOLT-LMM P < 5 × 10⁻⁶. Exact effect sizes and P values are provided in Supplementary Table 7 for traits with BOLT-LMM P < 5 × 10⁻⁸, and in the publicly available summary statistics where BOLT-LMM P ≥ 5 × 10⁻⁸. “PA/Ao” is the ratio of the PA diameter to the ascending aortic diameter. “Indexed” traits have been divided by body surface area. Genes may appear multiple times for the same trait when multiple variants at the same locus are in linkage equilibrium with one another (r2 < 0.001).
Figure 6 |
Figure 6 |. Cumulative incidence of dilated cardiomyopathy stratified by genetic prediction of RVEF.
359,899 UK Biobank participants were unrelated within 3 degrees of the participants who underwent MRI. 603 participants were diagnosed with dilated cardiomyopathy (DCM) after enrollment. Those in the bottom 5% of genetically predicted RVEF are depicted in red, and the remaining 95% are depicted in gray. The darker shades of red and gray represent the central estimate of the cumulative incidence (defined as 1 minus the Kaplan-Meier survival estimate). The lighter shades of red and gray represent the respective 95% confidence intervals (based on the standard error). The x-axis depicts years since enrollment in the UK Biobank; the y-axis depicts cumulative incidence of dilated cardiomyopathy. a, Strata based on genetic prediction of RVEF. Those in the bottom 5% had an elevated risk of DCM (62 incident cases; Cox HR 2.2; P = 7.6 × 10⁻⁹). b, Strata based on genetic prediction of RVEF after residualization for genetic prediction of LVESVi. Those in the bottom 5% had an elevated risk of DCM (52 incident cases; Cox HR 1.8; P = 5.4 × 10⁻⁵). The Schoenfeld global P value for both models was 0.26, indicating no violation of the proportional hazards assumption.

References

    1. Olson EN Gene regulatory networks in the evolution and development of the heart. Science 313, 1922–1927 (2006). - PMC - PubMed
    1. Koshiba-Takeuchi K et al. Reptilian heart development and the molecular basis of cardiac chamber evolution. Nature 461, 95–98 (2009). - PMC - PubMed
    1. Farmer CG Evolution of the vertebrate cardio-pulmonary system. Annual Review of Physiology 61, 573–592 (1999). - PubMed
    1. Galli D et al. Atrial myocardium derives from the posterior region of the second heart field, which acquires left-right identity as Pitx2c is expressed. Development 135, 1157–1167 (2008). - PubMed
    1. Meilhac SM & Buckingham ME The deployment of cell lineages that form the mammalian heart. Nature Reviews Cardiology 15, 705–724 (2018). - PubMed

Methods-only References

    1. Is R et al. Distribution, determinants, and normal reference values of thoracic and abdominal aortic diameters by computed tomography (from the Framingham Heart Study). Am J Cardiol 111, 1510–1516 (2013). - PMC - PubMed
    1. He K, Zhang X, Ren S & Sun J Deep residual learning for image recognition. arXiv:1512.03385 [cs] (2015).
    1. Krizhevsky A, Sutskever I & Hinton GE ImageNet classification with deep convolutional neural networks. Commun. ACM 60, 84–90 (2017).
    1. Kingma DP & Ba J Adam: a method for stochastic optimization. arXiv:1412.6980 [cs] (2017).
    1. Smith LN Cyclical learning rates for training neural networks. arXiv:1506.01186 [cs] (2015).

Publication types