Genome-wide association analysis reveals insights into the genetic architecture of right ventricular structure and function
- PMID: 35697868
- PMCID: PMC11929962
- DOI: 10.1038/s41588-022-01083-2
Genome-wide association analysis reveals insights into the genetic architecture of right ventricular structure and function
Abstract
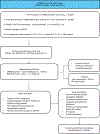
Right ventricular (RV) structure and function influence the morbidity and mortality from coronary artery disease (CAD), dilated cardiomyopathy (DCM), pulmonary hypertension and heart failure. Little is known about the genetic basis of RV measurements. Here we perform genome-wide association analyses of four clinically relevant RV phenotypes (RV end-diastolic volume, RV end-systolic volume, RV stroke volume, RV ejection fraction) from cardiovascular magnetic resonance images, using a state-of-the-art deep learning algorithm in 29,506 UK Biobank participants. We identify 25 unique loci associated with at least one RV phenotype at P < 2.27 ×10⁻⁸, 17 of which are validated in a combined meta-analysis (n = 41,830). Several candidate genes overlap with Mendelian cardiomyopathy genes and are involved in cardiac muscle contraction and cellular adhesion. The RV polygenic risk scores (PRSs) are associated with DCM and CAD. The findings substantially advance our understanding of the genetic underpinning of RV measurements.
© 2022. The Author(s), under exclusive licence to Springer Nature America, Inc.
Conflict of interest statement
Competing interests
S.E.P. acts as a consultant for and is shareholder of Circle Cardiovascular Imaging (Calgary, Alberta, Canada). All other authors have no competing interests.
Figures


References
-
- Naksuk N. et al. Right ventricular dysfunction and long-term risk of sudden cardiac death in patients with and without severe left ventricular dysfunction. Circ. Arrhythm. Electrophysiol. 11, e006091 (2018). - PubMed
-
- Voelkel NF et al. Right ventricular function and failure. Circulation 114, 1883–1891 (2006). - PubMed
Publication types
MeSH terms
Grants and funding
- N01 HC095168/HL/NHLBI NIH HHS/United States
- PG/14/89/31194/BHF_/British Heart Foundation/United Kingdom
- MC_QA137853/MRC_/Medical Research Council/United Kingdom
- 75N92020D00001/HL/NHLBI NIH HHS/United States
- DH_/Department of Health/United Kingdom
- N01 HC095167/HL/NHLBI NIH HHS/United States
- N02 HL64278/HL/NHLBI NIH HHS/United States
- P30 DK063491/DK/NIDDK NIH HHS/United States
- 203553/Z/16/Z/WT_/Wellcome Trust/United Kingdom
- N01 HC095160/HL/NHLBI NIH HHS/United States
- 75N92020D00002/HL/NHLBI NIH HHS/United States
- HHSN268201500003C/HL/NHLBI NIH HHS/United States
- N01 HC095161/HL/NHLBI NIH HHS/United States
- 75N92020D00005/HL/NHLBI NIH HHS/United States
- N02 HL064278/HL/NHLBI NIH HHS/United States
- N01 HC095169/HL/NHLBI NIH HHS/United States
- MR/L016311/1/MRC_/Medical Research Council/United Kingdom
- N01 HC095159/HL/NHLBI NIH HHS/United States
- 75N92020D00003/HL/NHLBI NIH HHS/United States
- UL1 TR001420/TR/NCATS NIH HHS/United States
- 75N92020D00004/HL/NHLBI NIH HHS/United States
- N01 HC095163/HL/NHLBI NIH HHS/United States
- 75N92020D00007/HL/NHLBI NIH HHS/United States
- R01 HL086719/HL/NHLBI NIH HHS/United States
- HHSN268201500003I/HL/NHLBI NIH HHS/United States
- UL1 TR001079/TR/NCATS NIH HHS/United States
- UL1 TR000040/TR/NCATS NIH HHS/United States
- WT_/Wellcome Trust/United Kingdom
- N01 HC095166/HL/NHLBI NIH HHS/United States
- MC_PC_17228/MRC_/Medical Research Council/United Kingdom
- N01 HC095162/HL/NHLBI NIH HHS/United States
- 75N92020D00006/HL/NHLBI NIH HHS/United States
- UL1 TR001881/TR/NCATS NIH HHS/United States
- N01 HC095165/HL/NHLBI NIH HHS/United States
- K24 HL103844/HL/NHLBI NIH HHS/United States
- N01 HC095164/HL/NHLBI NIH HHS/United States
LinkOut - more resources
Full Text Sources
Miscellaneous

