. 2022 Aug;23(4):513-534.
doi: 10.1007/s10162-022-00851-5. Epub 2022 Jun 13.

Tonotopic Selectivity in Cats and Humans: Electrophysiology and Psychophysics

Affiliations

Tonotopic Selectivity in Cats and Humans: Electrophysiology and Psychophysics

Francois Guérit et al. J Assoc Res Otolaryngol. 2022 Aug.

Abstract

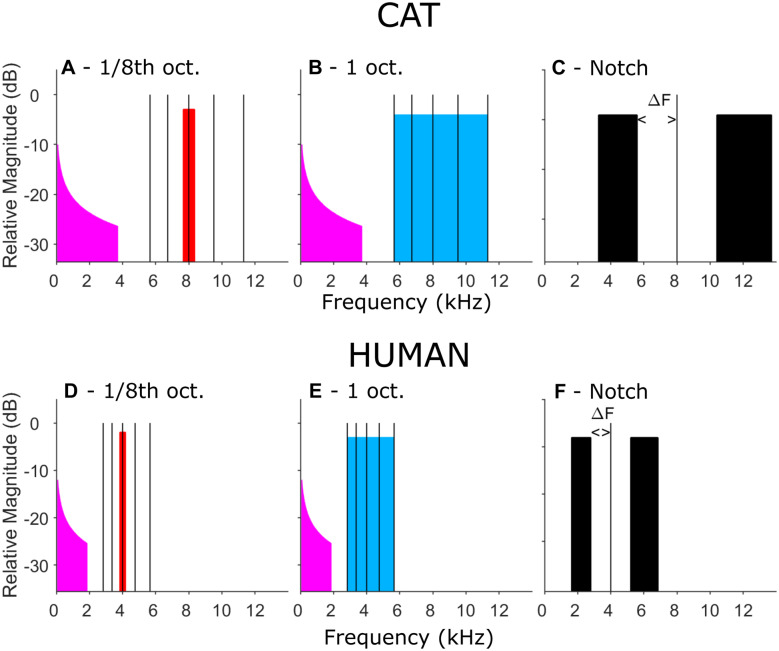
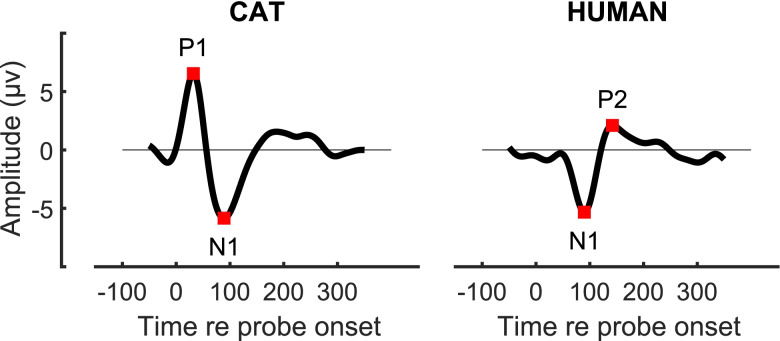
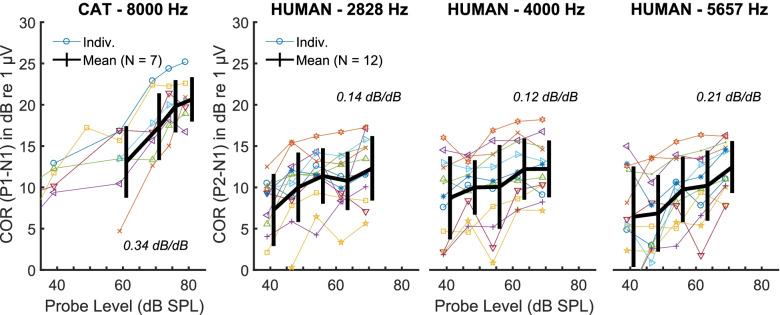
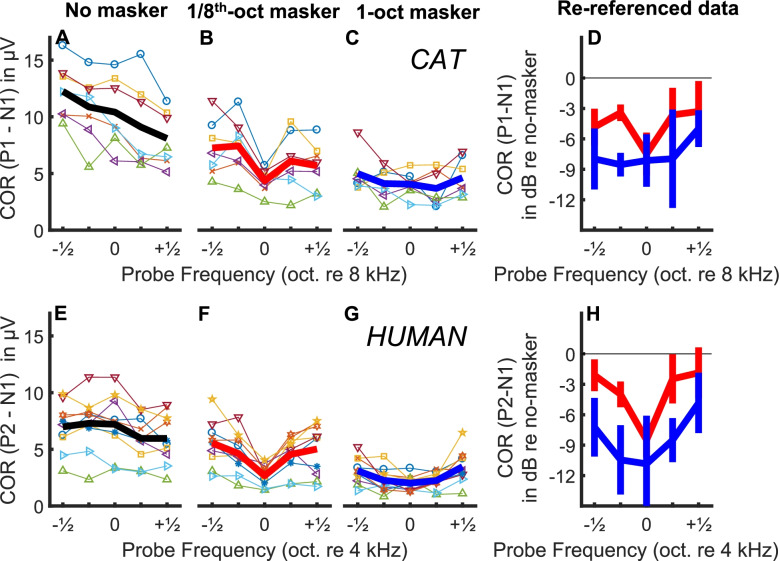
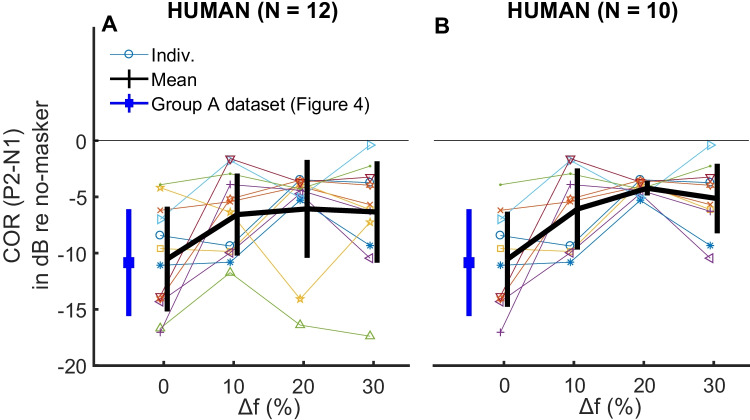
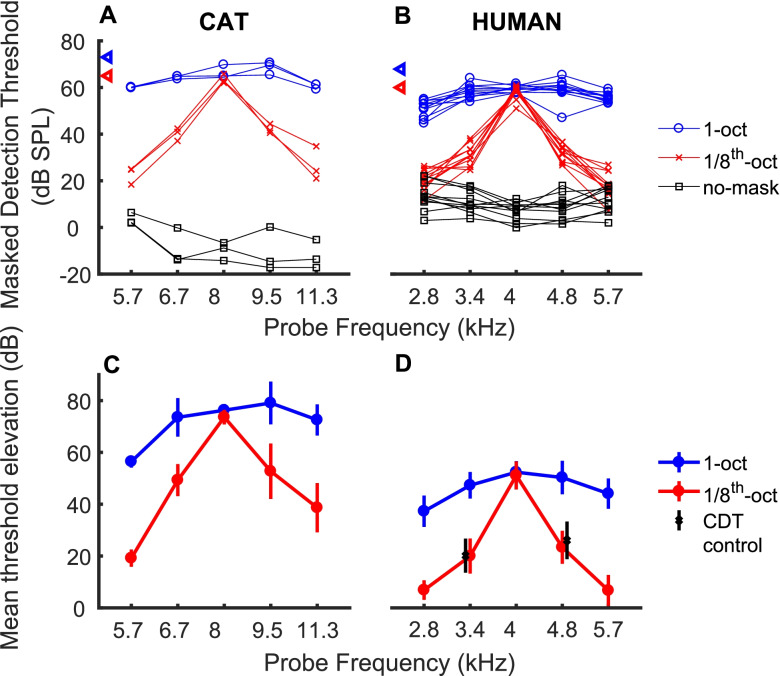
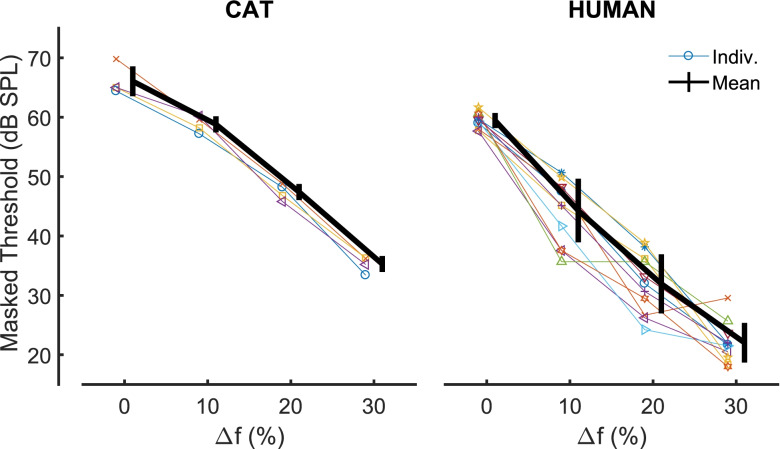
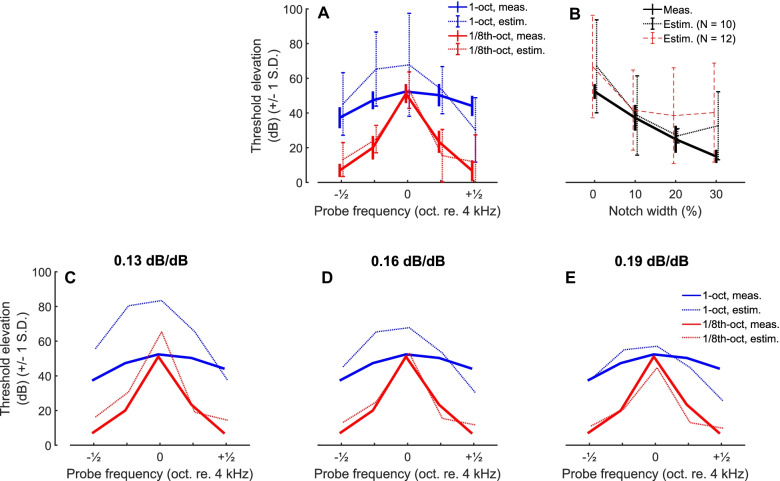
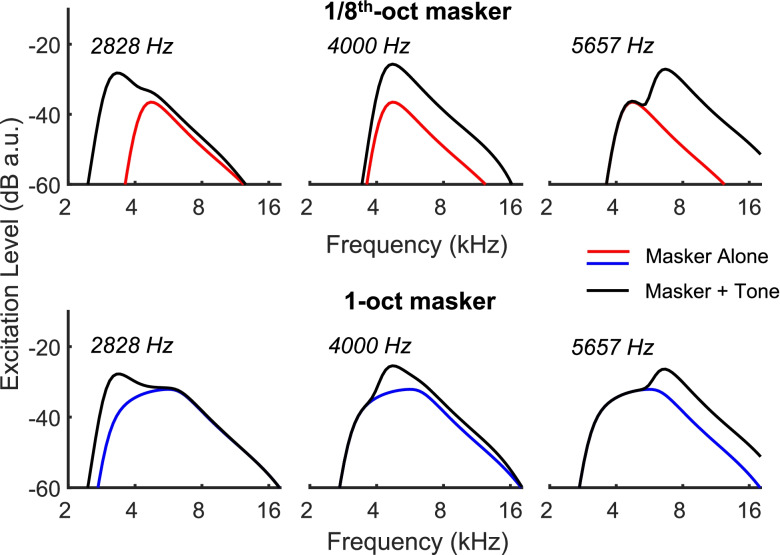
We describe a scalp-recorded measure of tonotopic selectivity, the "cortical onset response" (COR) and compare the results between humans and cats. The COR results, in turn, were compared with psychophysical masked-detection thresholds obtained using similar stimuli and obtained from both species. The COR consisted of averaged responses elicited by 50-ms tone-burst probes presented at 1-s intervals against a continuous noise masker. The noise masker had a bandwidth of 1 or 1/8th octave, geometrically centred on 4000 Hz for humans and on 8000 Hz for cats. The probe frequency was either - 0.5, - 0.25, 0, 0.25 or 0.5 octaves re the masker centre frequency. The COR was larger for probe frequencies more distant from the centre frequency of the masker, and this effect was greater for the 1/8th-octave than for the 1-octave masker. This pattern broadly reflected the masked excitation patterns obtained psychophysically with similar stimuli in both species. However, the positive signal-to-noise ratio used to obtain reliable COR measures meant that some aspects of the data differed from those obtained psychophysically, in a way that could be partly explained by the upward spread of the probe's excitation pattern. Our psychophysical measurements also showed that the auditory filter width obtained at 8000 Hz using notched-noise maskers was slightly wider in cat than previous measures from humans. We argue that although conclusions from COR measures differ in some ways from conclusions based on psychophysics, the COR measures provide an objective, noninvasive, valid measure of tonotopic selectivity that does not require training and that may be applied to acoustic and cochlear-implant experiments in humans and laboratory animals.

Keywords: cat; cortical onset response; electrophysiology; human; psychophysics; tonotopic selectivity.


Figures

Fig. 1
Fig. 1
Stimulus spectra. A, B 1/8th-oct (A, red) and 1-oct (B, blue) maskers for cats, centred on 8 kHz. Pink noise (magenta) was used to mask quadratic distortion products. Vertical black lines indicate probe frequencies, which were presented one at a time at varying levels. C Notched-noise stimuli for cats. Lower- and upper-frequency masker bands were held constant in width equal to the lower and upper halves of the 1-oct masker. The probe frequency was fixed at 8 kHz and the notch width varied among 20, 40 and 60 % (ΔF = 10, 20, and 30 %) of the centre frequency. D, E 1/8-oct, 1-oct, and notched maskers for humans, all centred on 4 kHz. F. Notched-noise stimuli used for humans
Fig. 2
Fig. 2
Examples of cat (left panel) and human (right panel) cortical onset response (COR) waveforms
Fig. 3
Fig. 3
Growth of the unmasked COR with probe level in cats (left panel) and humans (right three panels). For the humans, we measured the COR level-growth at 2828, 4000 and 5657 Hz. Human data is from participant group B. Individual symbols/colours match those of Fig. 5 (notched-noise results)
Fig. 4
Fig. 4
Masked COR patterns in humans (group A) and cats. AC Individual (thin lines) and group (thick line) cat COR masked patterns, in µV. D Mean masked COR when re-referenced to the no-masker condition. Blue line is for the 1-oct masker, red line is for the 1/8th-oct masker. Error bars indicate ± 1 SD. EH Same as AD but in humans
Fig. 5
Fig. 5
Masked COR patterns in humans (group B) for the different notched-noise conditions. Results are shown in dB relative to the unmasked COR. Left panel shows the results for all participants in group B, with the black thick line showing the mean ± 1 standard deviation. For comparison, we show the masked COR obtained in group A with the 1-oct masker and a 4-kHz probe frequency in blue. That condition and the notched-noise condition with 0 % Δf are identical in terms of stimulation. Right panel shows the same results when removing two outlier participants with high amounts of masking for Δf of 20 and 30 %. Individual colours and symbols match those of Fig. 3
Fig. 6
Fig. 6
Response latencies for Cat 2. Data are combined across all tested masker conditions, probe frequencies and probe levels. Hold time was the time in seconds from masker onset to probe onset. Hold times of 2–5 s are represented in the 4 panels. Green, blue, magenta and white bars represent the proportions of trials that were scored as early release, false alarm, hit and miss, as described in the text. Latencies longer than 1 s after the end of the hit window are combined in one bar for each hold time. Early releases were not included in measures of percent correct. Blue, magenta and black numbers indicate the respective proportions of scored trials (i.e. not early releases) for each hold number
Fig. 7
Fig. 7
A, B Masked and unmasked detection thresholds. Each line represents thresholds of one cat (A) or human (B) listener. Blue, red and black lines denote 1-oct, 1/8-oct, and no masker conditions, respectively. Blue and red triangles on the ordinate indicate RMS masker levels. C-D. Mean threshold elevations. Mean values represent the mean of the masked threshold for each condition and listener minus the no-masker threshold for that listener. Symbols and error bars indicate means and standard deviations. Blue and red indicate 1- and 1/8-oct masker conditions, respectively. Black symbols and error bars near probe frequencies of 3.4 and 4.8 kHz in D indicate a condition in which an extra 1/8th-oct masker was added to mask cubic distortion products, as discussed in the text. Those symbols are displaced slightly horizontally to improve visibility
Fig. 8
Fig. 8
Masked thresholds in notched-noise conditions. Left panel represents individual data (thin lines) and mean (thick line) from 4 individual cats. Right panel shows data collected in human participant group B. Individual colours/symbols match those of Figs. 3 and 5
Fig. 9
Fig. 9
Comparison of psychophysical and COR results in humans. A Noise-band experiment. Thick lines show psychophysical results, and dotted lines the COR estimate obtained by dividing the COR masking (in dB re unmasked, group A) by 0.16, the average slope of the unmasked probe level growth measured in group B. B Notched-noise experiment. Solid line shows the psychophysical results, red dashed line shows the COR estimate averaged across all participants (N = 12). Black dashed line shows the results with the two outlier participants removed (N = 10). CE Same analysis as A (without the error bars for visibility) when using different slopes: 0.13 dB/dB (C, lower 5 % confidence interval value), 0.16 dB/dB (D, average slope) and 0.19 dB/dB (E, upper 95 % confidence interval value)
Fig. 10
Fig. 10
Simulated excitation patterns for masker-alone (blue/red lines) and masker plus probe (black lines). Top and bottom rows are for the narrow-band and wideband-masker conditions respectively. Probe frequency was 2828, 4000 and 5657 Hz in the left, middle and right plots, respectively. All simulations were generated using the nonlinear gammachirp auditory filter bank implemented in the AIM-MAT software package (Gaudrain et al. 2015)

Similar articles

Cited by

References

    1. Alves-Pinto A, Sollini J, Wells T, Sumner CJ (2016) Behavioural estimates of auditory filter widths in ferrets using notched-noise maskers. J Acoust Soc Am 139:EL19–EL24. 10.1121/1.4941772 - PMC - PubMed
    1. Baker RJ, Rosen S. Auditory filter nonlinearity across frequency using simultaneous notched-noise masking. J Acoust Soc Am. 2006;119:454–462. doi: 10.1121/1.2139100. - DOI - PubMed
    1. Bierer JA, Bierer SM, Middlebrooks JC. Partial tripolar cochlear implant stimulation: Spread of excitation and forward masking in the inferior colliculus. Hear Res. 2010;270:134–142. doi: 10.1016/j.heares.2010.08.006. - DOI - PMC - PubMed
    1. Bierer JA, Faulkner KF. Identifying cochlear implant channels with poor electrode-neuron interface: partial tripolar, single-channel thresholds and psychophysical tuning curves. Ear Hear. 2010;31:247–258. doi: 10.1097/AUD.0b013e31822f3442. - DOI - PMC - PubMed
    1. Bierer JA, Middlebrooks JC. Auditory cortical images of cochlear-implant stimuli: dependence on electrode configuration. J Neurophysiol. 2002;87:478–492. doi: 10.1152/jn.00212.2001. - DOI - PubMed

Publication types