Review
. 2022 Dec;23(6):1285-1304.
doi: 10.1007/s11154-022-09737-6. Epub 2022 Jun 14.

Mortality and morbidity in ageing men: Biology, Lifestyle and Environment

Affiliations
Review

Mortality and morbidity in ageing men: Biology, Lifestyle and Environment

Erfei Zhao et al. Rev Endocr Metab Disord. 2022 Dec.

Abstract

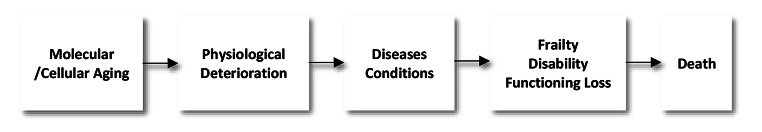
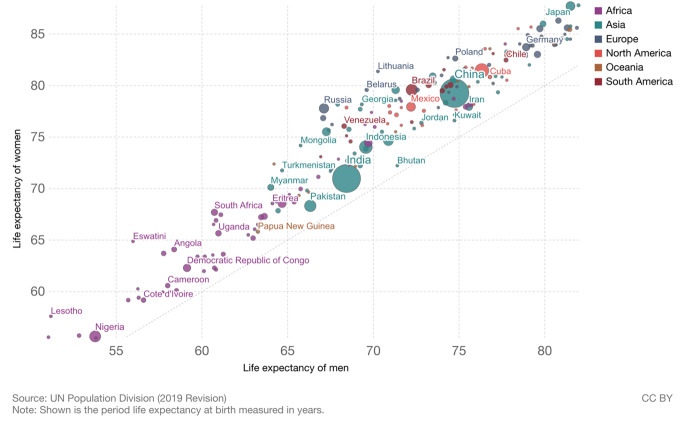
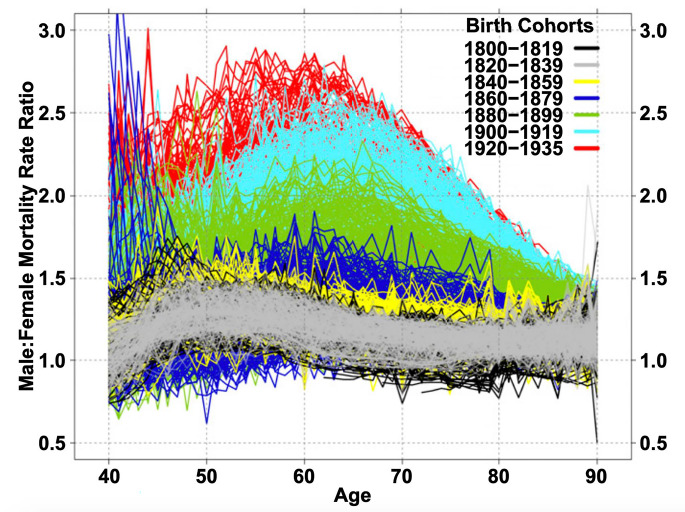
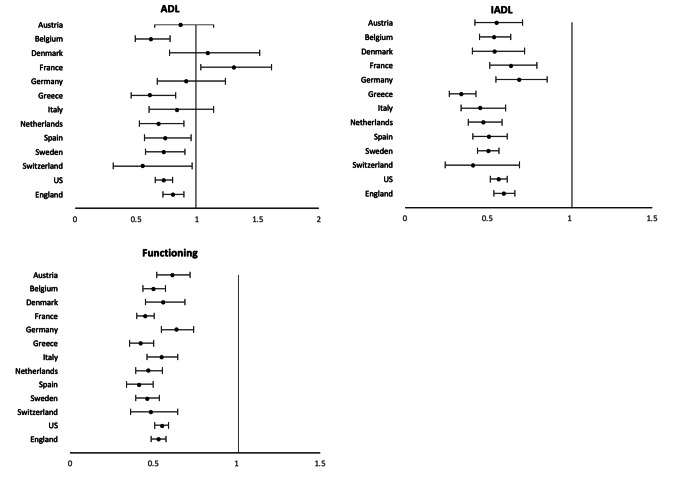
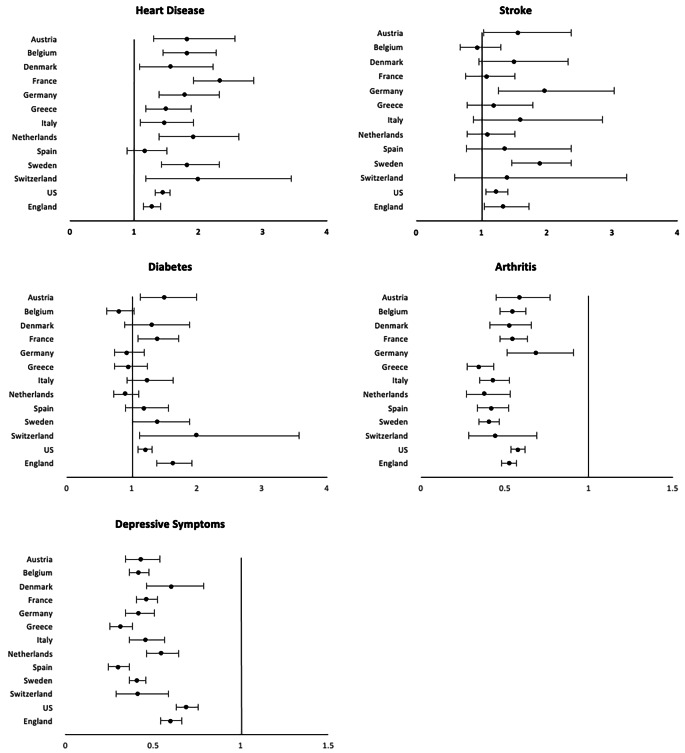
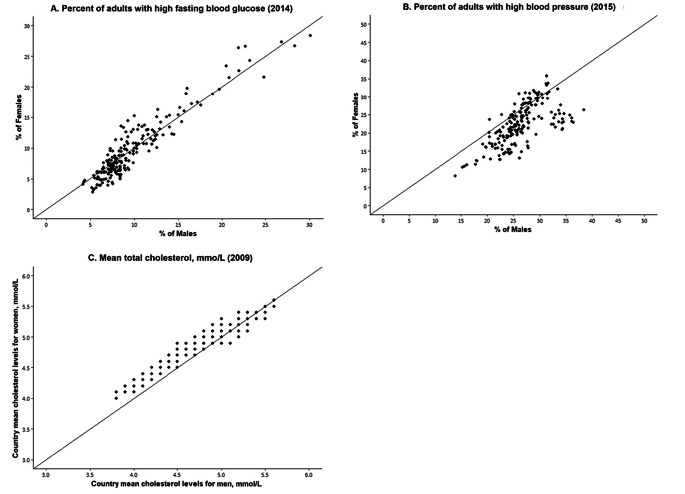
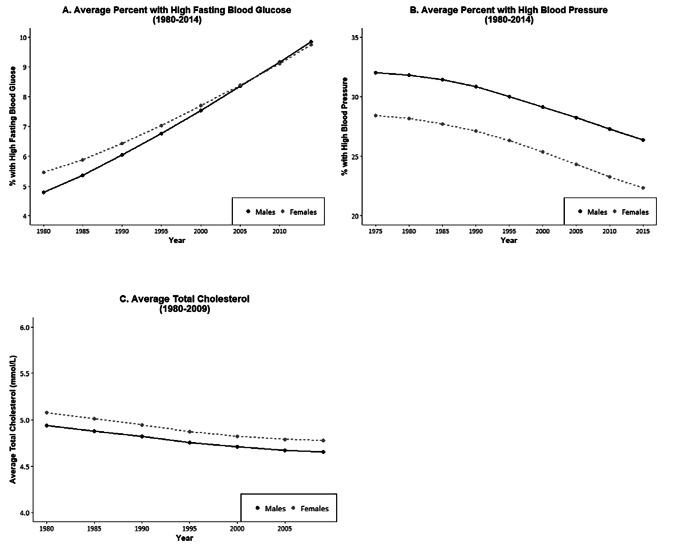
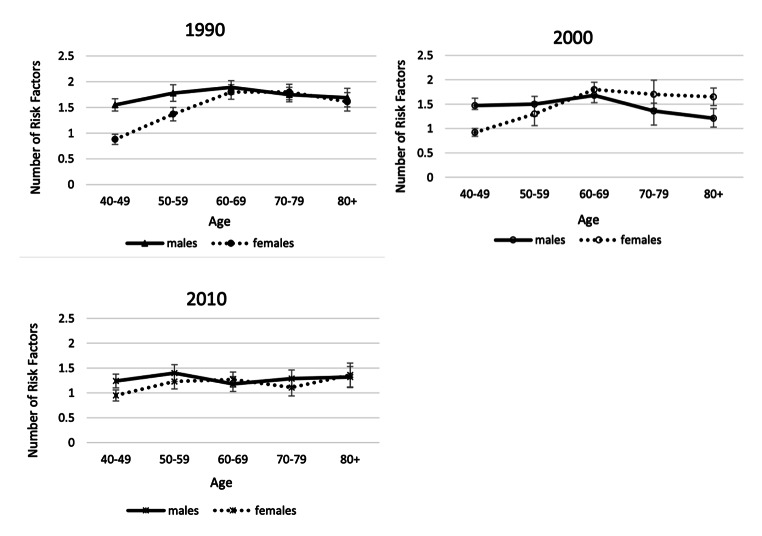
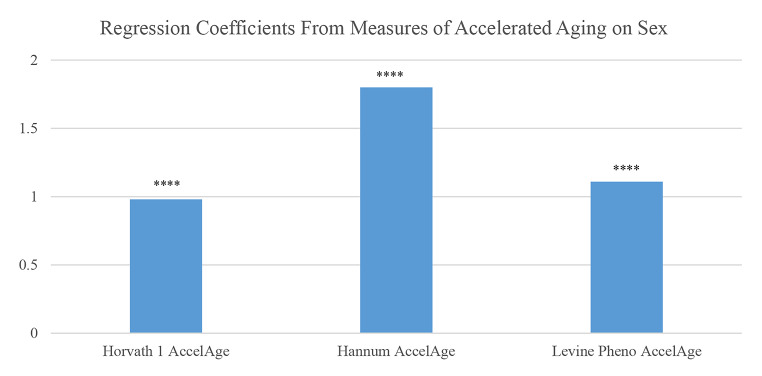
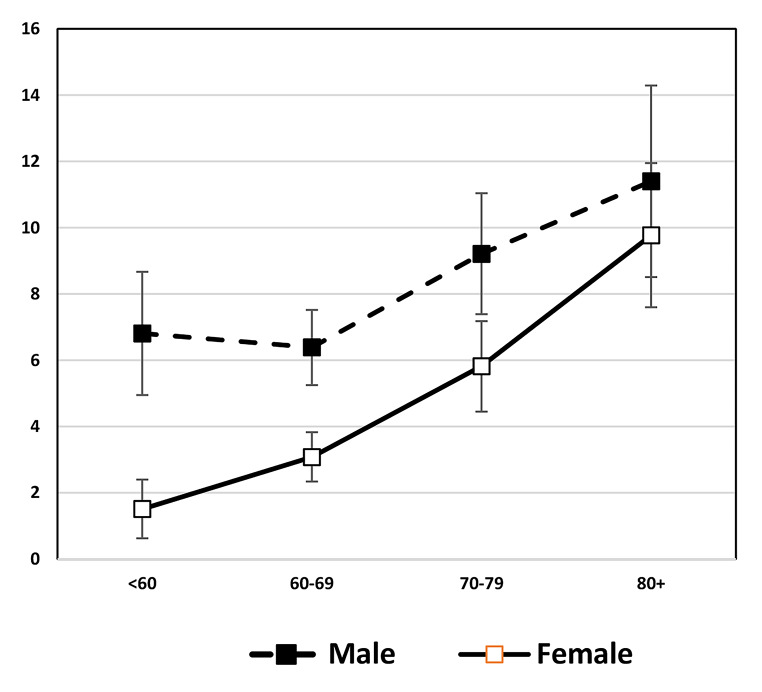
Males live shorter lives than women in all countries. The universality of shorter male life expectancy is a 21st Century phenomena. It occurs with the decline in infectious diseases and the rise in cardiovascular diseases accounting for mortality. Male/female differences in morbidity are not as succinctly characterized. Men have a higher prevalence of lethal diseases, which is linked to their lower life expectancy. Women have more non-lethal conditions such as depression and arthritis; which may also be linked in part to longer survival. Men have better physical functioning and less disability which is partly explained by gender differences in diseases and also by their greater strength, size, and stamina. Gender differences in risk factors for disease have changed over time with the prevalence and treatment of risk as well as differential behavior by gender. Examination of what are seen as basic molecular and cellular measures related to aging indicates men age faster than women; however, even these basic biological measures result from a combination of biology, behavior, and social factors.

Keywords: Cholesterol; Diabetes; Epigenetic aging; Gender; Heart Disease; Hypertension; Life Expectancy; Sex; Stroke.


Conflict of interest statement

No conflict of interest.

Figures

Fig. 1
Fig. 1
Health Change with Age - The morbidity process. Dimensions indicate time pattern of age-related health change at the population level. Updated version of Crimmins et al. [3]
Fig. 2
Fig. 2
Life expectancy of women vs. life expectancy of men 2019. Source: United Nations, Department of Economic and Social Affairs, Population Division (2019). World Population Prospects: The 2019 Revision, DVD Edition. Max Roser, Esteban Ortiz-Ospina and Hannah Ritchie (2013) - “Life Expectancy”. Published online at OurWorldInData.org. Retrieved from: ‘https://ourworldindata.org/life-expectancy’ [4]
Fig. 3
Fig. 3
Male-Female mortality ratios for single-year birth cohorts for 13 countries: 1800–1935 [6]
Fig. 4
Fig. 4
Odds Ratios indicating the effect of being male on ADL, IADL, and functioning difficulties for older populations in 13 countries. Odds ratios from logistic regressions of sex on the presence of condition when age controlled; vertical line indicates equality for men and women. U.S. data come from the Health and Retirement Study (HRS), England data come from the English Longitudinal Study of Ageing (ELSA), and other countries are from the Survey of Health, Ageing and Retirement in Europe (SHARE) [21]
Fig. 5
Fig. 5
Odds ratios indicating effect of being male on presence of disease or condition among the older population (age ≥ 50 years). Vertical line indicates equality for men and women. U.S. data come from the Health and Retirement Study (HRS), England data come from the English Longitudinal Study of Ageing (ELSA), and other countries are from the Survey of Health, Ageing and Retirement in Europe (SHARE) [21]
Fig. 6
Fig. 6
Percent of Men/Women with High Risk Levels of Fasting Glucose and High Blood Pressure and Mean Total Cholesterol in 191 Individual Countries. Original data from WHO Global Health Observatory Data Repository [111]
Fig. 7
Fig. 7
Average Percent of Men and Women with High Glucose, High Blood Pressure, and Average Cholesterol Level in almost 200 Countries over Recent Decades. The number of countries is 191 for blood glucose and blood pressure, and 189 countries for cholesterol. Values are age standardized. Data are from WHO Global Health Observatory Data Repository [111]
Fig. 8
Fig. 8
Mean number of high-risk cardiovascular risk factors (range: 0–8) by age and sex among men and women aged 40 and over in the United States: 1990, 2000, 2010. Data are from NHANES. Cardiovascular risk indicators include systolic and diastolic blood pressure, body mass index (BMI), total cholesterol, high-density lipoprotein (HDL) cholesterol, low density lipoprotein (LDL) cholesterol, triglycerides, and glycated hemoglobin (HbA1c) [112]
Fig. 9
Fig. 9
Years of accelerated epigenetic aging and accelerated pace of aging for men compared to women based on 3 epigenetic clocks: Americans over age 56. Notes: Controlled for education, race/ethnicity, obesity, smoking, and cell distribution based on HRS flow cytometry. Source: Data are from the Health and Retirement Study [114]
Fig. 10
Fig. 10
Percent Immunosenescent (% CD4/CD8 < 1) by age and sex among Americans over age 56: Health and Retirement Study. 2016 Data from Health and Retirement Study [115]

Similar articles

Cited by

References

    1. Barford A, Dorling D, Davey Smith G, Shaw M. Life expectancy: women now on top everywhere. BMJ. 2006;332(7545):808. doi: 10.1136/bmj.332.7545.808. - DOI - PMC - PubMed
    1. Crimmins EM, Shim H, Zhang YS, Kim JK. Differences between Men and Women in Mortality and the Health Dimensions of the Morbidity Process. Clin Chem. 2019;65(1):135–45. doi: 10.1373/clinchem.2018.288332. - DOI - PMC - PubMed
    1. Crimmins EM. Lifespan and Health span: Past, Present, and Promise. Gerontologist. 2015;55(6):901–11. doi: 10.1093/geront/gnv130. - DOI - PMC - PubMed
    1. United Nations, Department of Economic and Social Affairs, Population Division. World Population Prospects: The 2019 Revision, DVD Edition. Max Roser, Esteban Ortiz-Ospina and Hannah Ritchie - “Life Expectancy”. 2013. https://ourworldindata.org/life-expectancy. Accessed 19 Jan 2022.
    1. Nemtsov A, Neufeld M, Rehm J. Are Trends in Alcohol Consumption and Cause-Specific Mortality in Russia Between 1990 and 2017 the Result of Alcohol Policy Measures? J Stud Alcohol Drugs. 2019;80(5):489–98. doi: 10.15288/jsad.2019.80.489. - DOI - PubMed

Publication types